. 2019 Jul 30;17(1):88.
doi: 10.1186/s12964-019-0403-x.

WDR76 degrades RAS and suppresses cancer stem cell activation in colorectal cancer

Affiliations

WDR76 degrades RAS and suppresses cancer stem cell activation in colorectal cancer

Eun Ji Ro et al. Cell Commun Signal. .

Abstract

Background: Stabilization of RAS is a key event for the hyper-activation of Wnt/β-catenin signaling and activation of cancer stem cell (CSC) in colorectal cancer (CRC). WD Repeat protein 76 (WDR76) mediates the polyubiquitination-dependent degradation of RAS in hepatocellular carcinoma (HCC). We investigated whether WDR76 destabilizes RAS and acts as a tumor suppressor inhibiting CSC activation in CRC.

Methods: We generated mice with deletion of Wdr76 (Wdr76-/-) and crosses of Wdr76-/- with ApcMin/+ (Wdr76-/-; ApcMin/+) and compared them with wildtype mice (Wdr76+/+) and ApcMin/+ mice (Wdr76+/+; ApcMin/+), respectively. Intestinal crypt lengthening, tumorigenesis and CSC activation were analyzed by histology, immunohistochemistry, and immunoblotting. CRC cell line was engineered to stably express or knockdown WDR76 or control vector and was analyzed after spheroid culture.

Results: Wdr76-/- mice, with increased Ras level, displayed crypt elongation and hyper-proliferation. Wdr76-/-; ApcMin/+ mice developed more tumors with bigger sizes than ApcMin/+ mice and their tumors showed increased proliferation and CSC activation with elevated RAS and β-catenin levels. In CRC cells, overexpression or knockdown of WDR76 decreased or increased the numbers and sizes of CRC spheroids with inhibition or activation of CSC markers, respectively. In human CRC, lower level of WDR76 was associated with poor patient survival.

Conclusions: In analyses of mice with deletion of Wdr76 and CRC spheroids, we found that RAS stability plays important roles in tumorigenesis by affecting proliferation and CSC activation. Our results suggest that destabilization of RAS by WDR76 is a potential strategy for targeting malignant CRC involving CSC activation.

Keywords: Cancer stem cell; Colorectal Cancer; RAS stability; Tumor suppressor; WDR76.


Conflict of interest statement

The authors declare that they have no competing interests.

Figures
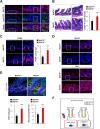
Fig. 1
Fig. 1
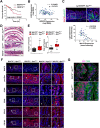
Loss of Wdr76 increases Ras protein level and crypt length in the murine small intestine. a Confocal immunofluorescence of Wdr76 and Lgr5-GFP in Lgr5-EGFP mouse intestinal sections: Wdr76 (red), Lgr5-GFP (green), and DAPI (blue). b-e Analysis of small intestinal sections of 15-week-old Wdr76+/+ and Wdr76−/− mice b H&E stained sections of small intestine from Wdr76+/+ and Wdr76−/− mice and quantification of the length of small intestinal crypts. c Confocal immunofluorescence and quantification of PCNA in small-intestine sections of Wdr76+/+ and Wdr76−/− mice. d Confocal immunofluorescence of Wdr76 (red) and Ras (red) in intestinal sections of Wdr76+/+ and Wdr76−/− mice. e Confocal immunofluorescence of Ki67 and Ras in small-intestine sections of Wdr76+/+ and Wdr76−/− mice with quantifications of Ki67+ cells in crypts and Ras expression levels in Ki67+ crypt cells. a-e Boxes indicate the enlarged areas. Crypts are indicated by dotted lines. Scale bars represent 20 μm. All measurements or counts are based on at least 10 crypts per 5 fields of view. *** p < 0.001. f Schema depicting the effects of Wdr76 deletion (Wdr76 KO) in normal small intestine
Fig. 2
Fig. 2
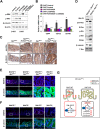
Loss of Wdr76 increases Ras protein levels and exacerbates CRC tumorigenesis. a Kaplan-Meier analysis of overall survival in colon cancer patients, classified by WDR76 expression (WDR76 high and WDR76 low groups are defined as those with FPKM values above the 66th percentile and below the 33rd percentile, respectively). Log-rank (Mantel-Cox) test, p = 0.0441. b Linear regression curve showing LGR5 and WDR76 expression levels in log2 in 104 CRC patients (GSE21510). c Confocal immunofluorescence of Wdr76 and Lgr5-GFP in ApcMin/+; Lgr5-EGFP intestinal sections with linear regression curve showing Lgr5 and Wdr76 expression in tumors. Quantitative expression levels based on at least 10 tumors per 10 fields of view. *** p < 0.001. Wdr76 (red), Lgr5-GFP (green), and DAPI (blue). Boxes indicate the enlarged areas. Tumor areas are indicated by dotted lines. T: Tumor; NT: Non-tumor. Scale bars represent 20 μm. d-g Analysis of small intestinal sections of 15-week-old Wdr76+/+; ApcMin/+and Wdr76−/−; ApcMin/+ mice d H&E stained sections of small intestines from Wdr76+/+; ApcMin/+and Wdr76−/−; ApcMin/+ mice. Tumors are indicated by arrowheads. Scale bars represent 20 μm. e Quantification of the total number and size (pixel) of tumors per mouse (Wdr76+/+, n = 6; Wdr76−/−, n = 6). **p < 0.01. f Confocal immunofluorescence of Wdr76, Ras, PCNA, CD44, CD133, and CD166 in sections of small intestine from Wdr76+/+; ApcMin/+and Wdr76−/−; ApcMin/+ mice. Boxes indicate the enlarged areas. Tumors are indicated by dotted lines. T: Tumor. Scale bars represent 100 μm (left) and 20 μm (right). g Confocal immunofluorescence of Ki67 (red) and Ras (green) in tumor sections of Wdr76+/+; ApcMin/+and Wdr76−/−; ApcMin/+ mice. Tumors are indicated by dotted lines. Scale bars represent 20 μm
Fig. 3
Fig. 3
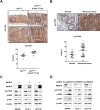
Loss of Wdr76 activates the Wnt/β-catenin pathway in CRC. a Western blot of D-WT and D-MT cells after treatment with AS703026 and LY294002. b Relative mRNA levels of CSC markers in D-WT and D-MT cells treated with AS703026 and LY294002. c Immunohistochemical staining of Ras and β-catenin in intestinal sections of 15-week-old ApcMin/+ and ApcMin/+; K-RasG12DLA2 mice. Boxes indicate the enlarged areas. Scale bars represent 100 μm (left panel) and 20 μm (right panel). d Western blots of tumors extracts from 15-week-old Wdr76+/+; ApcMin/+and Wdr76−/−; ApcMin/+ mice incubated with the indicated antibodies. e Confocal immunofluorescence of Wdr76 and β-catenin in small-intestine sections of 15-week-old Wdr76+/+; ApcMin/+ and Wdr76−/−; ApcMin/+ mice. Boxes indicate the enlarged areas. Tumors are indicated by dotted lines. T: Tumor. Scale bars represent 100 μm (left panel) and 20 μm (right panel). f Confocal immunofluorescence of Wdr76 and β-catenin in small-intestine sections of 15-week-old Wdr76+/+ and Wdr76−/− mice. Boxes indicate the enlarged areas. Intestinal crypts are indicated by dotted lines. Scale bars represent 100 μm (left panel) and 20 μm (right panel). g Schema depicting the effects of Wdr76 deletion in CRC harboring Apc mutation
Fig. 4
Fig. 4
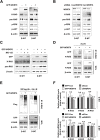
WDR76 regulates the RAS protein level and downstream signaling pathway activities in CRC cells. a Immunohistochemical staining of Ras in intestinal sections of ApcMin/+and ApcMin/+; K-RasG12DLA2 mice and quantifications of Ras expression using Image J. * p < 0.05. b Immunohistochemical staining of RAS in intestinal sections of from human patients with CRC microarray and quantification of RAS expression using Image J. * p < 0.05. a-b Western blot of extracts from CRC cell lines SW480, DLD-1, and HCT116 transiently transfected with Flag-Control (Control) or Flag-WDR76 (WDR76 OE) a and shControl-GFP (Control) or shWDR76-GFP (WDR76 KD) b using the indicated antibodies
Fig. 5
Fig. 5
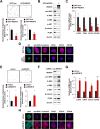
WDR76 induces proteasomal degradation of wild-type and oncogenic K-RAS in CRC cells. a-b Western blots of extracts from D-WT and D-MT cells stably expressing GFP-Control or GFP-WDR76 a and shControl-GFP or shWDR76-GFP b using the indicated antibodies. c Western blots of extracts from D-WT and D-MT cells stably expressing GFP-Control or GFP-WDR76 with or without MG-132 treatment (20 μM, 4 h) using the indicated antibodies. d-e Immunoprecipitation d and ubiquitination e of K-RAS in ALLN-treated (25 μg/mL, 12 h) D-WT and D-MT cells stably expressing GFP-Control or GFP-WDR76 with immunoblotting against the indicated antibodies. f Relative mRNA levels of the indicated genes from D-WT and D-MT cells stably expressing either GFP-Control, GFP-WDR76, shControl-GFP, or shWDR76-GFP quantified by RT-qPCR. n.s.: not significant
Fig. 6
Fig. 6
WDR76 regulates CSC activation in CRC spheroids harboring oncogenic KRAS mutation. a-d Five-day spheroid cultures of D-MT cells stably expressing GFP-Control or GFP-WDR76 were analyzed. a Number and size of spheroids were quantified using Image J. *** p < 0.001. * p < 0.05, ** p < 0.01. b Extracts were immunoblotted using the indicated antibodies. c Relative mRNA levels of the indicated genes were quantified by RT-qPCR. * p < 0.05, ** p < 0.01, and *** p < 0.001. d Immunocytochemistry was performed using the indicated antibodies and counterstaining with DAPI. Scale bars represent 20 μm. e-h Five-day spheroid cultures of D-MT cells stably expressing shControl-GFP or shWDR76-GFP were analyzed. e Number and size of spheroids were quantified using Image J. * p < 0.05, ** p < 0.01. f Extracts were immunoblotted using the indicated antibodies. g Relative mRNA levels of the indicated genes were quantified by RT-qPCR. * p < 0.05, ** p < 0.01, and *** p < 0.001. h Immunocytochemistry was performed using the indicated antibodies and counterstaining with DAPI. Scale bars represent 20 μm

Similar articles

Cited by

References

    1. Barker N, Ridgway RA, van Es JH, van de Wetering M, Begthel H, van den Born M, et al. Crypt stem cells as the cells-of-origin of intestinal cancer. Nature. 2009;457(7229):608–611. doi: 10.1038/nature07602. - DOI - PubMed
    1. Merlos-Suarez A, Barriga FM, Jung P, Iglesias M, Cespedes MV, Rossell D, et al. The intestinal stem cell signature identifies colorectal cancer stem cells and predicts disease relapse. Cell Stem Cell. 2011;8(5):511–524. doi: 10.1016/j.stem.2011.02.020. - DOI - PubMed
    1. Zeuner A, De Maria R. Not so lonely at the top for cancer stem cells. Cell Stem Cell. 2011;9(4):289–290. doi: 10.1016/j.stem.2011.09.006. - DOI - PubMed
    1. Ricci-Vitiani L, Lombardi DG, Pilozzi E, Biffoni M, Todaro M, Peschle C, et al. Identification and expansion of human colon-cancer-initiating cells. Nature. 2007;445(7123):111–115. doi: 10.1038/nature05384. - DOI - PubMed
    1. Plaks V, Kong N, Werb Z. The cancer stem cell niche: how essential is the niche in regulating stemness of tumor cells? Cell Stem Cell. 2015;16(3):225–238. doi: 10.1016/j.stem.2015.02.015. - DOI - PMC - PubMed

Publication types