. 2019 Sep;29(9):1506-1520.
doi: 10.1101/gr.246777.118. Epub 2019 Jul 30.

Identifying loci under positive selection in complex population histories

Affiliations

Identifying loci under positive selection in complex population histories

Alba Refoyo-Martínez et al. Genome Res. 2019 Sep.

Abstract

Detailed modeling of a species' history is of prime importance for understanding how natural selection operates over time. Most methods designed to detect positive selection along sequenced genomes, however, use simplified representations of past histories as null models of genetic drift. Here, we present the first method that can detect signatures of strong local adaptation across the genome using arbitrarily complex admixture graphs, which are typically used to describe the history of past divergence and admixture events among any number of populations. The method-called graph-aware retrieval of selective sweeps (GRoSS)-has good power to detect loci in the genome with strong evidence for past selective sweeps and can also identify which branch of the graph was most affected by the sweep. As evidence of its utility, we apply the method to bovine, codfish, and human population genomic data containing panels of multiple populations related in complex ways. We find new candidate genes for important adaptive functions, including immunity and metabolism in understudied human populations, as well as muscle mass, milk production, and tameness in specific bovine breeds. We are also able to pinpoint the emergence of large regions of differentiation owing to inversions in the history of Atlantic codfish.


Figures

Figure 1.
Figure 1.
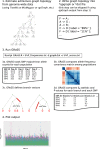
Schematic of GRoSS workflow.
Figure 2.
Figure 2.
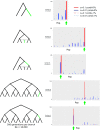
Evaluation of GRoSS performance using simulations in SLiM 2, with 100 diploid individuals per population panel. We simulated different selective sweeps under strong (s = 0.1) and intermediate (s = 0.01) selection coefficients for a three-population tree, a six-population graph with a 50%/50% admixture event, and a 16-population tree. We obtained the maximum branch score within 100 kb of the selected site and computed the number of simulations (out of 100) in which the branch of this score corresponded to the true branch in which the selected mutation arose (highlighted in green). (cond = 5%) Simulations conditional on the beneficial mutation reaching 5% frequency or more; (cond = 1%) simulations conditional on the beneficial mutation reaching 1% frequency or more; (Pop) population branch. The green arrow denotes the values of the statistic corresponding to the branch in which the selected mutation arose.
Figure 3.
Figure 3.
Evaluation of GRoSS performance using simulations in SLiM 2, with 100 diploid individuals per population panel. We produced precision-recall (left) and ROC (center and right) curves comparing simulations under selection to simulations under neutrality for a three-population tree, a six-population graph with a 50%/50% admixture event, and a 16-population tree. The right-most ROC curves are a zoomed-in version of the center ROC curves, in which the false-positive rate is limited to be equal to or less than 0.1.
Figure 4.
Figure 4.
We ran GRoSS on human genomic data. (A) Population tree including panels from phase 3 of the 1000 Genomes Project. (B) Population graph including imputed panels from the Human Origins SNP capture data from Lazaridis et al. (2014).
Figure 5.
Figure 5.
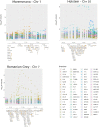
We ran GRoSS on a population graph of bovine breeds. P-values were obtained either (1) by computing chi-squared statistics per SNP, or (2) after averaging the per-SNP statistics in 10-SNP windows with a 1-SNP step size, obtaining a P-value from the averaged statistic. Holstein and Maremmana cattle photos obtained from Wikimedia Commons (authors: Verum; Giovanni Bidi). Romanian Grey cattle screen-shot obtained from a CC-BY YouTube video (author: Paolo Caddeo).
Figure 6.
Figure 6.
Zoomed-in plots of GRoSS output for three regions found to have strong evidence for positive selection in the 10-SNP bovine scan. Genes were retrieved using Ensembl via the Gviz R Bioconductor library (Hahne and Ivanek 2016).
Figure 7.
Figure 7.
Large regions of high differentiation in the codfish data. Branches colored in orange are branches whose corresponding SB scores evince the high-differentiation region. Branches colored in red are branches whose corresponding SB scores evince the high-differentiation region and have at least one SNP with −log10 (P) > 5 inside the region.

Similar articles

Cited by

References

    1. The 1000 Genomes Project Consortium. 2015. A global reference for human genetic variation. Nature 526: 68–74. 10.1038/nature15393 - DOI - PMC - PubMed
    1. Akbari A, Vitti JJ, Iranmehr A, Bakhtiari M, Sabeti PC, Mirarab S, Bafna V. 2018. Identifying the favored mutation in a positive selective sweep. Nat Methods 15: 279–282. 10.1038/nmeth.4606 - DOI - PMC - PubMed
    1. Akey JM, Zhang G, Zhang K, Jin L, Shriver MD. 2002. Interrogating a high-density SNP map for signatures of natural selection. Genome Res 12: 1805–1814. 10.1101/gr.631202 - DOI - PMC - PubMed
    1. Andrés AM, Hubisz MJ, Indap A, Torgerson DG, Degenhardt JD, Boyko AR, Gutenkunst RN, White TJ, Green ED, Bustamante CD, et al. 2009. Targets of balancing selection in the human genome. Mol Biol Evol 26: 2755–2764. 10.1093/molbev/msp190 - DOI - PMC - PubMed
    1. Árnason E, Halldórsdóttir K. 2015. Nucleotide variation and balancing selection at the Ckma gene in Atlantic cod: analysis with multiple merger coalescent models. PeerJ 3: e786 10.7717/peerj.786 - DOI - PMC - PubMed

Publication types