. 2019 Sep;29(9):1429-1441.
doi: 10.1101/gr.244780.118. Epub 2019 Jul 30.

Estrogen-independent molecular actions of mutant estrogen receptor 1 in endometrial cancer

Affiliations

Estrogen-independent molecular actions of mutant estrogen receptor 1 in endometrial cancer

Zannel Blanchard et al. Genome Res. 2019 Sep.

Abstract

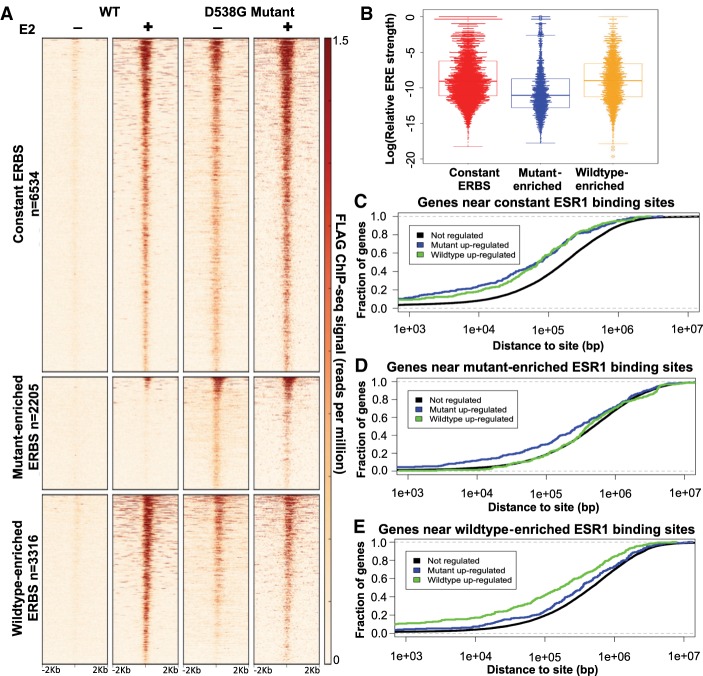
Estrogen receptor 1 (ESR1) mutations have been identified in hormone therapy-resistant breast cancer and primary endometrial cancer. Analyses in breast cancer suggest that mutant ESR1 exhibits estrogen-independent activity. In endometrial cancer, ESR1 mutations are associated with worse outcomes and less obesity, however, experimental investigation of these mutations has not been performed. Using a unique CRISPR/Cas9 strategy, we introduced the D538G mutation, a common endometrial cancer mutation that alters the ligand binding domain of ESR1, while epitope tagging the endogenous locus. We discovered estrogen-independent mutant ESR1 genomic binding that is significantly altered from wild-type ESR1. The D538G mutation impacted expression, including a large set of nonestrogen-regulated genes, and chromatin accessibility, with most affected loci bound by mutant ESR1. Mutant ESR1 is distinct from constitutive ESR1 activity because mutant-specific changes are not recapitulated with prolonged estrogen exposure. Overall, the D538G mutant ESR1 confers estrogen-independent activity while causing additional regulatory changes in endometrial cancer cells that are distinct from breast cancer cells.


Figures

Figure 1.
Figure 1.
Generation and characterization of ESR1 wild-type and D538G mutant models. (A) CRISPR-mediated epitope tagging strategy was used to generate heterozygous FLAG-tagged wild-type ESR1 and D538G mutant ESR1 Ishikawa cell lines. (B) Immunoblotting for FLAG and ESR1 in Ishikawa parental cells, two heterozygous FLAG-tagged wild-type and three heterozygous FLAG-tagged D538G mutant cell lines show protein expression of epitope-tagged ESR1 and total ESR1. (C) The ESR1 wild-type and mutant allele expression frequencies based on RNA-seq data is shown for each D538G clonal cell line. (D) Estrogen response element (ERE) reporter activity as measured by luciferase activity was assayed in DMSO- and E2-induced conditions. Experiments were performed in triplicate, and the average luciferase activity for two wild-type and three D538G mutant clones is shown. (***) P = 0.0002; (****) P < 0.0001; error bars represent SEM.
Figure 2.
Figure 2.
D538G mutant drives a distinct transcriptional program. (A) Heatmap shows the relative expression of E2 up- and down-regulated genes as well as mutant-specific differentially expressed genes. Sample types are indicated by the column annotations described in the legend. Validation of RNA-seq results by qPCR are shown for ligand-independent E2–up-regulated genes PGR (B) and MMP17 (C) as well as mutant-specific up-regulated gene EHF (D) and down-regulated gene EPHA3 (E). BE show average expression levels, normalized to wild-type cells without E2 treatment, for two ESR1 wild-type and three D538G mutant clones after 8-h E2 or DMSO (vehicle) induction. Error bars represent SEM.
Figure 3.
Figure 3.
D538G mutant affects migration but not proliferation in endometrial cancer cells. (A) Bar graphs indicating the doubling times for ESR1 wild-type and D538G mutant cell lines in full media and hormone-deprived (HD) media. The relative wound densities of two ESR1 wild-type and three D538G mutant cell lines are shown over 24 h following scratch/wounding of cell monolayer in full serum media (B) and HD media (D). Images show the initial wound (pink) and migratory cells (orange) in wild-type and D538G mutant cells at 0 and 24 h in full serum media (C) and HD media (E). Proliferation and migration figures represent at least three independent experiments, performed in triplicate. Error bars represent SEM.
Figure 4.
Figure 4.
D538G mutation alters ESR1 genomic binding. (A) Heatmap displays ESR1 binding in representative wild-type and D538G mutant clones, in which each row is an ESR1 binding site. The heatmaps include sites that are constant in wild-type and mutant lines (top), sites that are enriched in the mutant lines (middle), and sites that are enriched in wild-type lines (bottom). (B) Plot shows that the distribution of the predicted relative affinity for ESR1, based on the best match to an ERE, is higher in constant binding sites (red) and wild-type–enriched sites (yellow) than D538G mutant-enriched ESR1 binding sites (blue). Cumulative distribution plots show the fraction of mutant up-regulated, down-regulated, or not regulated genes that have a constant (C), mutant-enriched (D), or wild-type–enriched (E) ESR1 binding site within a given distance from the transcription start site.
Figure 5.
Figure 5.
ESR1 D538G mutation alters chromatin accessibility at multiple loci. (A) Principal component analysis shows the relationship between ATAC-seq signal of ESR1 wild-type (blue circle) and D538G mutant cell lines (red circle). (B) Less than 10% of all ATAC-seq sites overlap with ESR1 binding sites, whereas 55% of mutant-enriched ATAC-seq sites overlap ESR1 binding sites, including constant ESR1 binding (brown) and mutant-enriched ESR1 binding (blue). Fifteen percent of wild-type–enriched ATAC-seq sites overlap ESR1 binding sites. Representative browser tracks show ATAC-seq signal increases with the D538G mutation at a region near EHF (C) and ATAC-seq signal decreases at an intergenic region on Chromosome 8 (D). Wild-type ATAC-seq signal DMSO/+E2 (blue), D538G DMSO (pink), and D538G + E2 (red) are scaled to the same value at each locus.
Figure 6.
Figure 6.
Prolonged E2 exposure does not recapitulate D538G mutant regulatory consequences. (A) Heatmap shows the relative expression of mutant-specific differentially expressed genes as well as genes up- and down-regulated in response to prolonged E2 (each row is a gene). Samples are indicated by the column annotations described in the legend. (B) Venn diagram shows the overlap between genes up-regulated in wild-type lines exposed to prolonged E2 and mutant-specific up-regulated genes. (C) Venn diagram shows the overlap between genes down-regulated in wild-type lines exposed to prolonged E2 and mutant-specific down-regulated genes. (D) Principal component analysis of ATAC-seq signal exhibits three sample groups: wild-type lines with 1-h or no E2 treatment (navy circle), wild-type lines with prolonged E2 exposure (gray circle, numbers indicate days of treatment), and D538G mutant lines (red circle).

Similar articles

Cited by

References

    1. Backes FJ, Walker CJ, Goodfellow PJ, Hade EM, Agarwal G, Mutch D, Cohn DE, Suarez AA. 2016. Estrogen receptor-α as a predictive biomarker in endometrioid endometrial cancer. Gynecol Oncol 141: 312–317. 10.1016/j.ygyno.2016.03.006 - DOI - PMC - PubMed
    1. Bahreini A, Li Z, Wang P, Levine KM, Tasdemir N, Cao L, Weir H, Puhalla S, Davidson NE, Stern AM, et al. 2017. Mutation site and context dependent effects of ESR1 mutation in genome-edited breast cancer cell models. Breast Cancer Res 19 10.1186/s13058-017-0851-4 - DOI - PMC - PubMed
    1. Bailey TL, Boden M, Buske FA, Frith M, Grant CE, Clementi L, Ren J, Li WW, Noble WS. 2009. MEME Suite: tools for motif discovery and searching. Nucleic Acids Res 37: W202–W208. 10.1093/nar/gkp335 - DOI - PMC - PubMed
    1. Buenrostro JD, Giresi PG, Zaba LC, Chang HY, Greenleaf WJ. 2013. Transposition of native chromatin for fast and sensitive epigenomic profiling of open chromatin, DNA-binding proteins and nucleosome position. Nat Methods 10: 1213–1218. 10.1038/nmeth.2688 - DOI - PMC - PubMed
    1. The Cancer Genome Atlas Network. 2012. Comprehensive molecular portraits of human breast tumours. Nature 490: 61–70. 10.1038/nature11412 - DOI - PMC - PubMed

Publication types