. 2019 Oct 7;9(10):3139-3152.
doi: 10.1534/g3.119.400347.

Genome-Wide Association and Gene Co-expression Network Analyses Reveal Complex Genetics of Resistance to Goss's Wilt of Maize

Affiliations

Genome-Wide Association and Gene Co-expression Network Analyses Reveal Complex Genetics of Resistance to Goss's Wilt of Maize

Amritpal Singh et al. G3 (Bethesda). .

Abstract

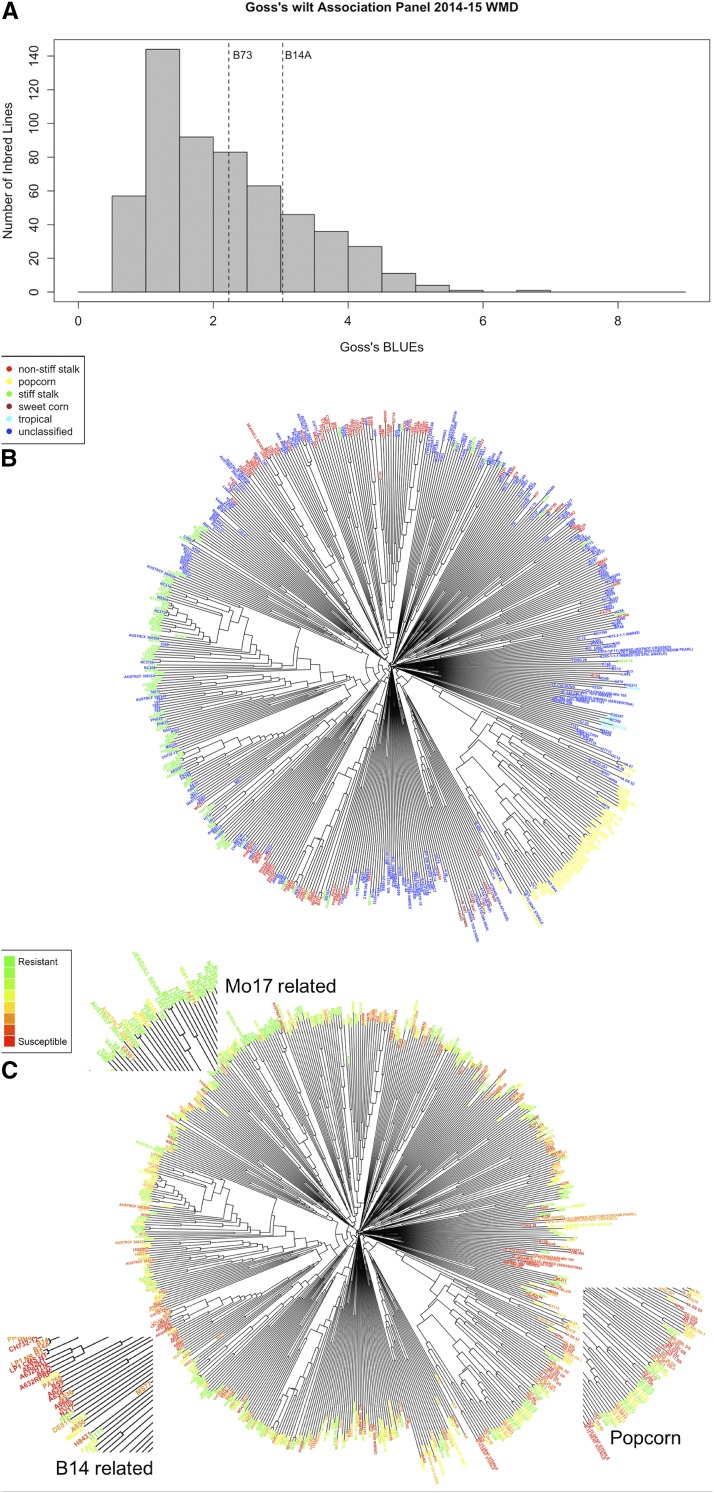
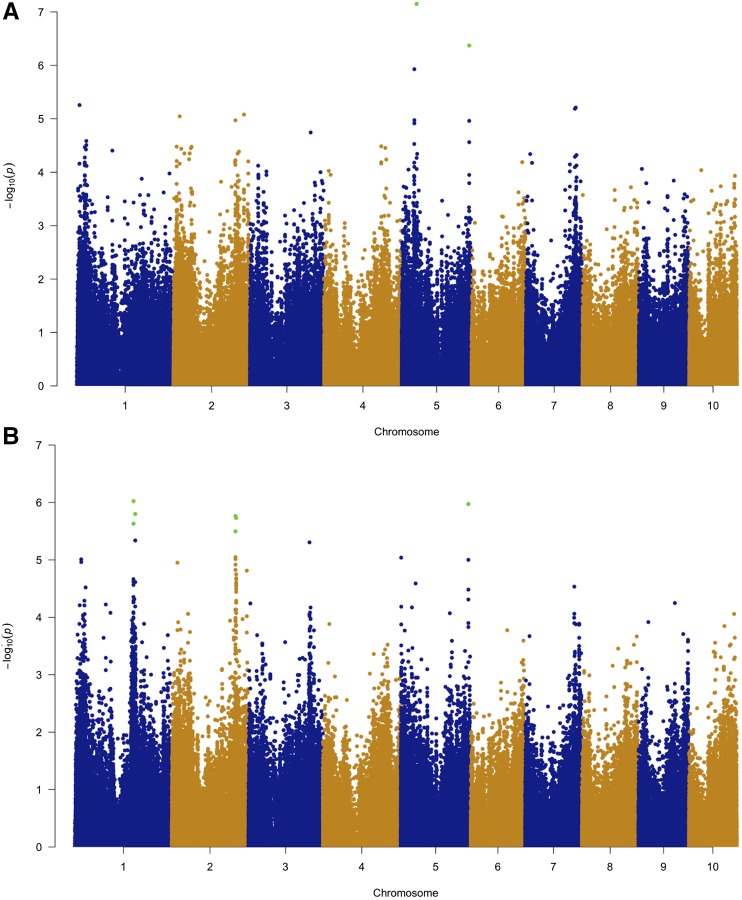
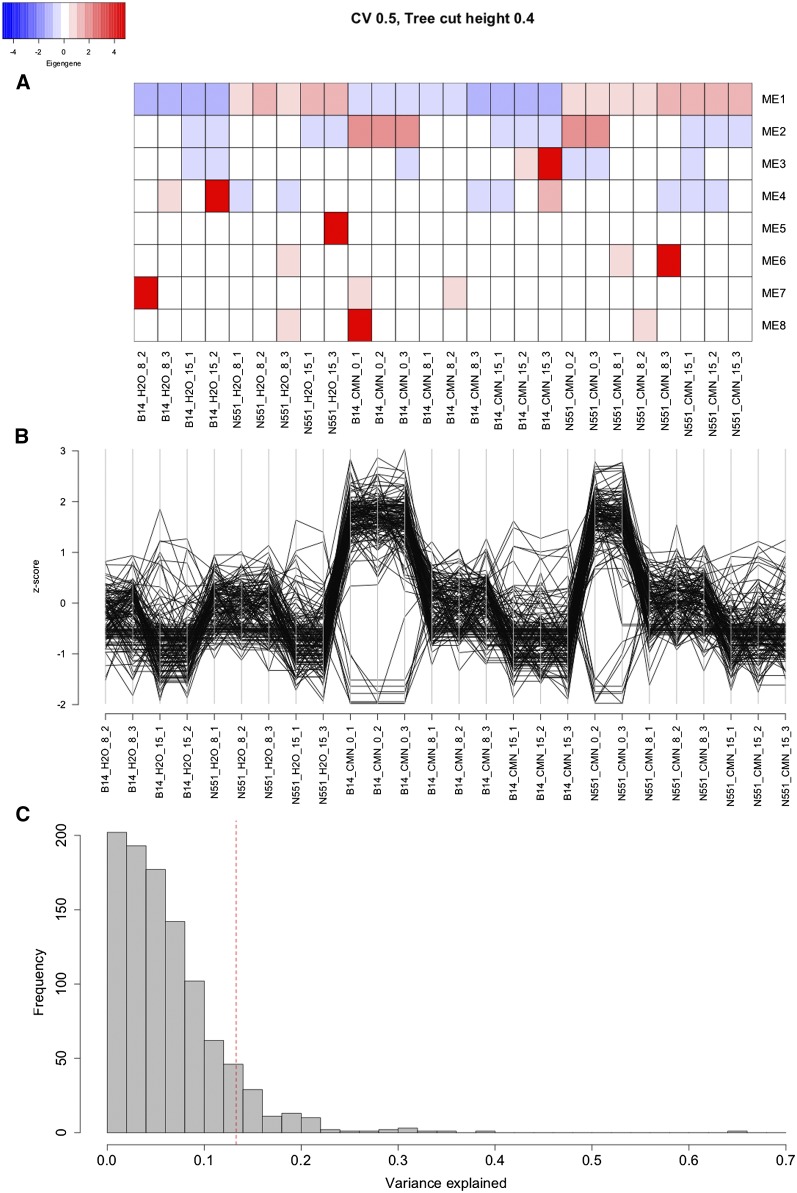
Goss's bacterial wilt and leaf blight is a disease of maize caused by the gram positive bacterium Clavibacter michiganensis subsp. nebraskensis (Cmn). First discovered in Nebraska, Goss's wilt has now spread to major maize growing states in the United States and three provinces in Canada. Previous studies conducted using elite maize inbred lines and their hybrids have shown that resistance to Goss's wilt is a quantitative trait. The objective of this study was to further our understanding of the genetic basis of resistance to Goss's wilt by using a combined approach of genome-wide association mapping and gene co-expression network analysis. Genome-wide association analysis was accomplished using a diversity panel consisting of 555 maize inbred lines and a set of 450 recombinant inbred lines (RILs) from three bi-parental mapping populations, providing the most comprehensive screening of Goss's wilt resistance to date. Three SNPs in the diversity panel and 10 SNPs in the combined dataset, including the diversity panel and RILs, were found to be significantly associated with Goss's wilt resistance. Each significant SNP explained 1-5% of the phenotypic variation for Goss's wilt (total of 8-11%). To augment the results of genome-wide association mapping and help identify candidate genes, a time course RNA sequencing experiment was conducted using resistant (N551) and susceptible (B14A) maize inbred lines. Gene co-expression network analysis of this time course experiment identified one module of 141 correlated genes that showed differential regulation in response to Cmn inoculations in both resistant and susceptible lines. SNPs inside and flanking these genes explained 13.3% of the phenotypic variation. Among 1,000 random samples of genes, only 8% of samples explained more phenotypic variance for Goss's wilt resistance than those implicated by the co-expression network analysis. While a statistically significant enrichment was not observed (P < 0.05), these results suggest a possible role for these genes in quantitative resistance at the field level and warrant more research on combining gene co-expression network analysis with quantitative genetic analyses to dissect complex disease resistance traits. The results of the GWAS and co-expression analysis both support the complex nature of resistance to this important disease of maize.

Keywords: Clavibacter; Goss’s wilt; Maize (Zea mays); genome-wide association mapping; genotyping-by-sequencing; quantitative disease resistance; quantitative trait loci; single nucleotide polymorphism; weighted gene co-expression network analysis.


Figures

Figure 1
Figure 1
Genetic relationship among the inbred lines of the diversity panel and distribution of Goss’s wilt among the inbred lines. (a) Histogram showing the distribution of weighted mean disease BLUEs for inbred lines included in the diversity panel. Vertical dotted lines display the check lines B73 and B14A; (b) Neighbor joining tree of 555 lines of the diversity panel created from a distance matrix calculated using the GBS SNP data. Labels are colored coded by the six subpopulation groups within the diversity panel; (c) The same neighbor joining tree as in (b) but labels are color coded according to Goss’s weighted mean disease values. Red color indicates that a line is susceptible and green color represents resistant lines. Specific groups are zoomed to indicate trends in Goss’s wilt resistance distribution. For example, most of the B14-related lines were susceptible while Mo17-related lines were relatively resistant. N551 is present in the B14 zoomed window along with B14A.
Figure 2
Figure 2
Manhattan plots showing results from genome-wide association mapping. (a) GWAS results on the diversity panel (N =555) displayed in a Manhattan plot where the y-axis is the negative log10 of p-values for the SNPs from model [2]. Associations that passed the false-discovery rate of 0.10 are colored green; (b) genome-wide association mapping results on the combined dataset (N =1005) displayed in a Manhattan plot where the y-axis is the -log10(P) for the SNPs from model [2]. Associations that passed the false-discovery rate of 0.10 are colored green.
Figure 3
Figure 3
Comparison of physical positions of QTL detected in bi-parental linkage mapping and GWAS. Bi-parental linkage mapping was conducted by Singh et al. (2016), and significant SNPs from GWAS in the combined dataset co-located on chromosomes 1, 2, and 5. The x-axis of each plot represents the physical position of each SNP, and the y-axis displays the negative log10 of p-values for each SNP included in the GWAS. Gray colored solid points represent all SNPs used in GWAS. Significant SNPs in the GWAS are indicated by green dots, and 2-LOD support interval of QTL detected by Singh et al. (2016) are shown by the red or blue windows.
Figure 4
Figure 4
Expression patterns of eight modules identified using weighted gene co-expression network analysis (WGCNA) across different samples. (a) Heatmap of eigen genes of eight modules. An eigen gene is representative of the gene expression pattern of genes inside that module. Labels of the columns are inbred line_treatment_hours_rep; (b) Normalized expression of genes inside module two obtained from WGCNA across all the samples. This module showed changes in gene expression in both susceptible line B14A as well as resistant line N551 in response to Cmn; (c) Distribution of phenotypic variance explained by SNPs inside and flanking the 1,000 random samples of genes. As a comparison, phenotypic variation explained by SNPs inside and flanking the genes of module two is depicted by red vertical dashed line.

Similar articles

Cited by

References

    1. Abendroth L. J., Elmore R. W., Boyer M. J., and Marlay S. K., 2011. Corn Growth and Development Iowa State University Press, Ames, https://store.extension.iastate.edu/product/6065.
    1. Alexander D. H., Novembre J., and Lange K., 2009. Fast model-based estimation of ancestry in unrelated individuals. Genome Res. 19: 1655–1664. 10.1101/gr.094052.109 - DOI - PMC - PubMed
    1. Anders S., Pyl P. T., and Huber W., 2015. HTSeq—a Python framework to work with high-throughput sequencing data. Bioinformatics 31: 166–169. - PMC - PubMed
    1. Asai T., Tena G., Plotnikova J., Willmann M. R., Chiu W.-L. et al. , 2002. MAP kinase signalling cascade in Arabidopsis innate immunity. Nature 415: 977–983. 10.1038/415977a - DOI - PubMed
    1. Balint-Kurti P. J., Yang J., Esbroeck G. V., Jung J., and Smith M. E., 2010. Use of a Maize Advanced Intercross Line for Mapping of QTL for Northern Leaf Blight Resistance and Multiple Disease Resistance. Crop Sci. 50: 458–466. 10.2135/cropsci2009.02.0066 - DOI

Publication types

LinkOut - more resources