. 2019 Sep;181(1):127-141.
doi: 10.1104/pp.19.00303. Epub 2019 Jul 30.

Pectin Chemistry and Cellulose Crystallinity Govern Pavement Cell Morphogenesis in a Multi-Step Mechanism

Affiliations

Pectin Chemistry and Cellulose Crystallinity Govern Pavement Cell Morphogenesis in a Multi-Step Mechanism

Bara Altartouri et al. Plant Physiol. 2019 Sep.

Abstract

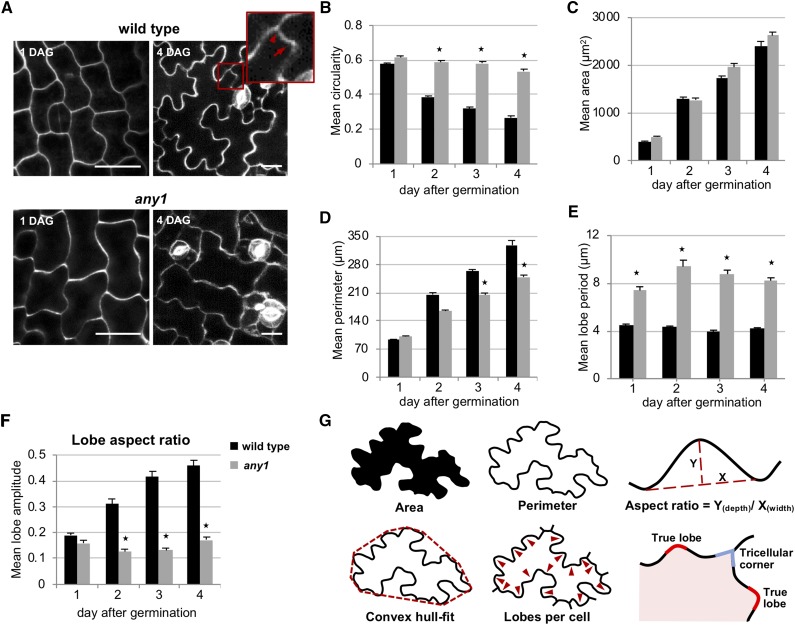
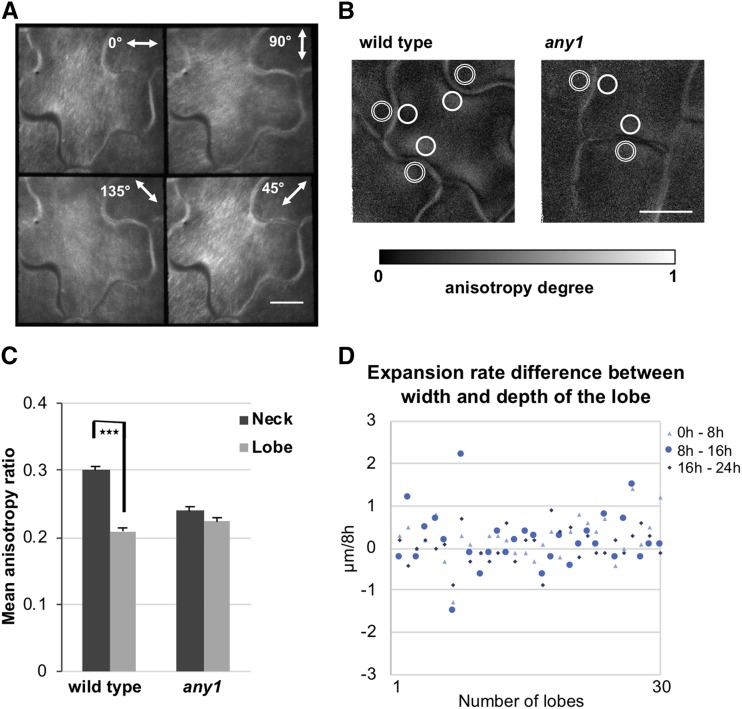
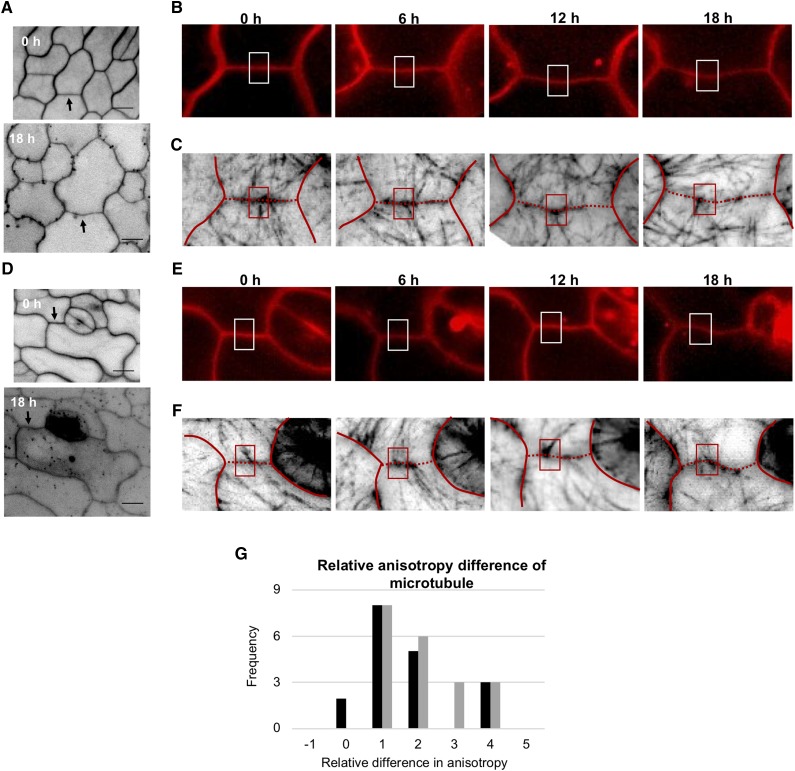
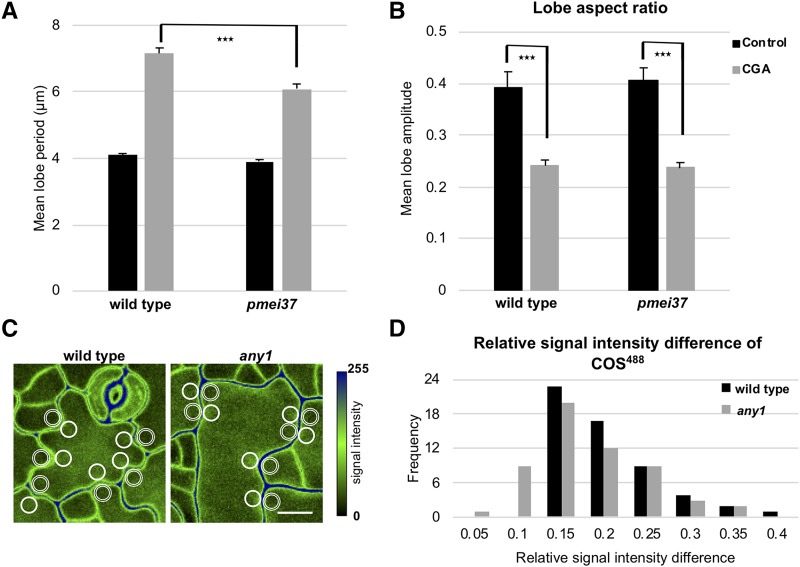
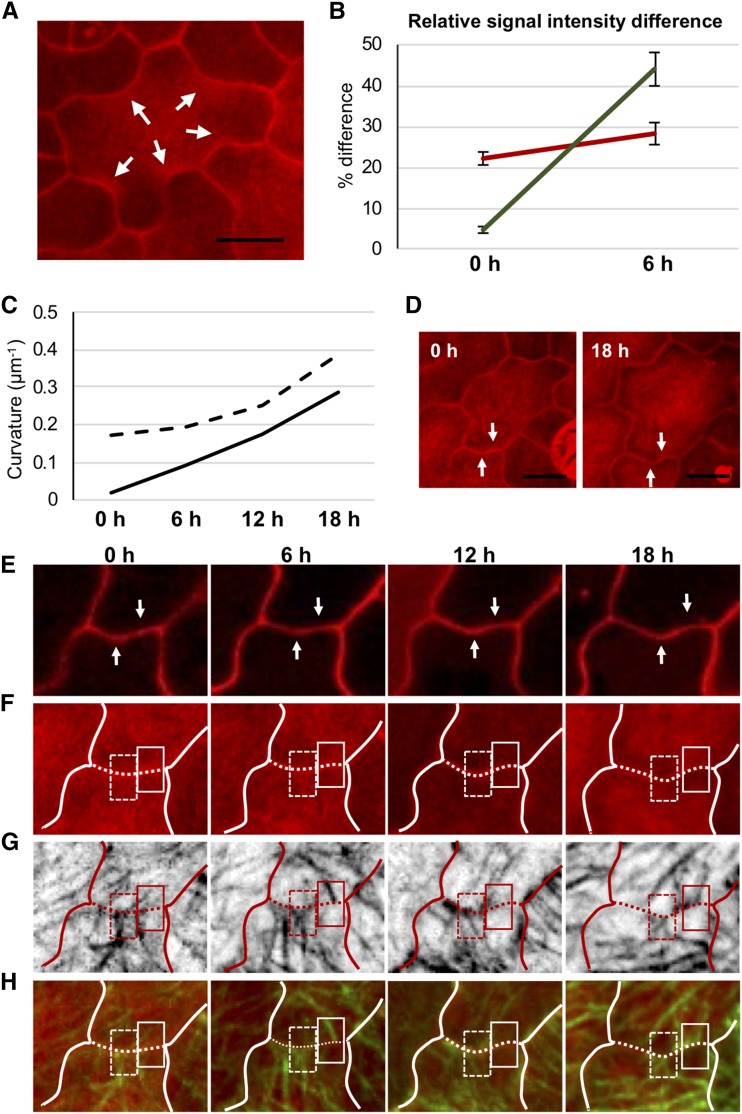
Simple plant cell morphologies, such as cylindrical shoot cells, are determined by the extensibility pattern of the primary cell wall, which is thought to be largely dominated by cellulose microfibrils, but the mechanism leading to more complex shapes, such as the interdigitated patterns in the epidermis of many eudicotyledon leaves, is much less well understood. Details about the manner in which cell wall polymers at the periclinal wall regulate the morphogenetic process in epidermal pavement cells and mechanistic information about the initial steps leading to the characteristic undulations in the cell borders are elusive. Here, we used genetics and recently developed cell mechanical and imaging methods to study the impact of the spatio-temporal dynamics of cellulose and homogalacturonan pectin distribution during lobe formation in the epidermal pavement cells of Arabidopsis (Arabidopsis thaliana) cotyledons. We show that nonuniform distribution of cellulose microfibrils and demethylated pectin coincides with spatial differences in cell wall stiffness but may intervene at different developmental stages. We also show that lobe period can be reduced when demethyl-esterification of pectins increases under conditions of reduced cellulose crystallinity. Our data suggest that lobe initiation involves a modulation of cell wall stiffness through local enrichment in demethylated pectin, whereas subsequent increase in lobe amplitude is mediated by the stress-induced deposition of aligned cellulose microfibrils. Our results reveal a key role of noncellulosic polymers in the biomechanical regulation of cell morphogenesis.


Figures

Figure 1.
Figure 1.
Shape analysis of Arabidopsis pavement cells of wild type and any1. A, Fluorescence micrographs of pavement cells on the abaxial side of a cotyledon at 1 d (left) and 4 d (right) after germination of wild type (upper row) and any1 (lower row) stained with PI. Scale bars = 20 μm. Cell border enclosed in the red rectangle is magnified to show the difference between true lobe (arrow) and tricellular junction (arrowhead). B to F, Developmental changes in the mean circularity (B), cell area (C), cell perimeter (D), lobe period (E), and lobe aspect ratio (F) of the wild-type (black bars) and any1 (gray bars) pavement cells from 1 to 4 d after germination. Lobe period equals square root of convex hull area divided by number of lobes per cell. G, Illustrations of cell area, cell perimeter, lobe aspect ratio, convex hull-fit, number of lobes per cell, and difference between true lobe and tricellular junction. Lobe aspect ratio in (F) is the ratio of depth/width of the lobe. Error bars = se; 55 > n > 40 cells from six to eight seedlings for each measurement. Asterisks indicate statistically significant differences between wild-type and any1 pavement cells of the same developmental stage (P < 0.001, Student’s t-test). The mean lobe aspect ratio in (F) represents all the true lobes in the measured cells.
Figure 2.
Figure 2.
Cellulose alignment at the periclinal wall of wild-type and any1 pavement cells. A, Fluorescence polarization at four different angles of cellulose microfibrils stained with S4B at 3 d after germination of wild-type pavement cells. B, Anisotropy degree of cellulose microfibrils represented by the pixel intensity at 1 d after germination of wild-type and any1 cells. Double-lined circles (lobe regions) and solid-lined circles (neck regions) indicate examples of regions of interest used for the graph in (C). Scale bars = 10 μm. C, Anisotropy of cellulose alignment at the neck and the corresponding lobe regions of the wild type and any1 mutant at 1 d after germination measured based on the signal intensity of each pixel at different emission angles. Error bars = se. Asterisks indicate statistically significant differences (P < 0.001, paired t test). n = 54 necks and adjacent lobes of the same undulation. All necks from two or three cells taken from 13 and 16 seedlings for wild type and any1, respectively, were used in this analysis. D, Difference in the expansion rates between the width and the depth of the lobe at the early stages of lobe formation in the wild type. The same lobe was monitored over 24 h at 8 h intervals. The difference in expansion rates between the width and the depth of the lobe was calculated as (widthth – widthth-8h) – (depthth – depthth-8h). n = 30 lobes. All lobes from two cells from three different seedlings were used in the analysis.
Figure 3.
Figure 3.
Mechanical stiffness of the periclinal wall of the wild-type and any1 pavement cells assessed by Brillouin microscopy. A and B, Fluorescence micrograph (PI label, left) and Brillouin shift (stiffness map, right) of wild-type (A) and any1 (B) pavement cells at 1 d after germination. The Brillouin shift is given in gigahertz and presented as a heatmap. In the micrographs, the dotted lines indicate cell outlines. Double-lined circles (lobe regions) and solid-lined circles (neck regions) indicate examples of regions of interest used for (C) and (D). Scale bars = 10 μm. Regions of interest = 9 μm2 and pixel size = 1 μm2. Asterisks indicate the central region of a cell where the Brillouin shift in the any1 is significantly reduced compared to the wild type (P < 0.001, Student’s t test). n = 25 cells for wild type and any1. C and D, The mean value of Brillouin shift (C) and the calculated longitudinal modulus (D) of the neck and the corresponding lobe regions in wild-type (black line) and any1 (gray line) pavement cells. Error bars = se. n = 40 necks and corresponding lobes of the same undulation. All necks from two or three cells from six seedlings for wild type and any1 were used in this analysis.
Figure 4.
Figure 4.
Arrangement of cortical microtubules during the development of undulations in wild-type and any1 pavement cells expressing GFP:TUB6. A to F, Fluorescence micrographs of wild-type (A–C) and any1 (D–F) pavement cells at 1 d after germination monitored over 18 h. The cell wall (stained with PI in A, B, D, and E) and cortical microtubules (GFP:TUB6, C and F) were visualized in 6-h time-lapse intervals. Arrows in (A) and (D) indicate the cell wall region that is represented in time-lapse images. Rectangles in (B) and (E) indicate the region on the anticlinal wall forming an undulation; (C) and (F) show the arrangement of cortical microtubules at the periclinal wall during the initiation and the development of the bend (rectangles). Red lines in (C) and (F) trace the anticlinal wall that is shown in (B) and (E), respectively. The dotted regions in (C) and (F) represents the anticlinal wall of interest. G, Frequency of the relative difference in cortical microtubule anisotropy between the prospective neck and the corresponding lobe of the same undulation at time 0 at the periclinal wall in GFP:TUB6 (black bars) and GFP:TUB6/any1 (gray bars). n = 18 necks and 18 adjacent lobes from seven seedlings for GFP:TUB6 and 20 necks and 20 adjacent lobes from 11 seedlings for GFP:TUB6/any1. Scale bars = 10 μm.
Figure 5.
Figure 5.
Role of demethyl-esterified pectin in the shaping of pavement cells. A and B, Mean lobe period (A) and mean lobe aspect ratio (B) in wild type and pmei37 at 4 d after germination for control (DMSO; black bars) and seedlings grown in the presence of CGA (gray bars). Error bars = se. 70 > n > 50 cells from 10 to 15 seedlings for each measurement for (A), and n = all lobes of 12 cells from eight seedlings for each measurement for (B). Asterisks indicate statistically significant differences (P < 0.001, Student’s t-test). C, Fluorescence micrographs (maximum projection of z-stacks) of wild-type and any1 pavement cells stained with COS488 at 1 d after germination. Double-lined circles (lobe regions) and solid-lined circles (neck regions) indicate examples of regions of interest used in (D) to calculate the abundance of demethylated pectin at lobe/neck pairs. Scale bar = 10 μm. D, Distribution of the relative differences in the signal intensity of COS488 between the neck and the corresponding lobe of the same undulation. n = 56 necks and 56 corresponding lobes from seven seedlings for wild type and any1.
Figure 6.
Figure 6.
Temporal association between the dynamics of demethyl-esterified pectin and cortical microtubules at developing cell border curvatures. A, Fluorescence micrograph (maximum projection of z-stack) of pavement cells stained with PI of wild type at 1 d after germination. Arrows indicate local enrichment in PI label at the neck regions of developed cell border curvatures. B, Relative differences in the signal intensity of PI (red) and GFP:TUB6 (green) label between prospective necks and adjacent regions at the periclinal wall at times 0 and 6 h. n = 17 prospective neck regions from three seedlings. Error bars = se. At time 0, all measured cell border regions were straight, whereas at 6 h they showed slight but discernible curvature. C, Evolution of curvature (calculated as reciprocal of its radius) in the two cell border regions indicated in (D), (E), (F), (G), and (H) over a 18-h observation period. Black dashed and solid lines represent the cell border segments identified by white dashed and solid rectangles in (F), (G), and (H), respectively. The black/white dashed line/rectangle indicates a cell border segment that is already curved at time 0, whereas the black/white solid line/rectangle identifies a cell border segment that is straight at time 0 and develops a curvature by 18 h. D to H, Fluorescence micrographs of wild-type epidermis monitored over 18 h and visualized in 6-h time-lapse intervals. D, Maximum projections of z-stacks of sample shown in (E), (F), and (H), stained with PI. E, Single optical sections of sample shown in (D), showing the anticlinal wall stained with PI over time. Arrows in (D) and (E) indicate two cell border segments monitored in the time-lapse series (upward pointing arrow, curvature present at time 0; downward pointing arrow, straight at time 0). F, Maximum projections of z-stacks showing PI signal for demethyl-esterified pectin. G, Maximum projections of z-stacks showing cortical microtubules at the periclinal wall (GFP:TUB6). H, Merge of the PI and the GFP:TUB6 signals. White lines in (F) and (H) and red line in (G) trace the anticlinal wall that is shown in (E). The dotted regions of the white lines in (F), (G), and (H) represent the anticlinal wall of interest. Scale bars = 10 μm.
Figure 7.
Figure 7.
Proposed two-step mechanism for undulation formation during the development of pavement cells. In Step I, an increase in the wall stiffness at a prospective neck region is generated through localized enrichment in demethylated pectin. The increased stiffness at the prospective neck side of the undulation leads to differential expansion of the periclinal wall during cell growth with the neck side expanding less than the opposing lobe side. The resulting symmetry break and stiffness differential generate a local elevation of stress (Sampathkumar et al., 2014; Bidhendi et al., 2019), which in turn attracts accumulation of microtubules at the neck (Hamant et al., 2008), resulting in deposition of cellulose, and by consequence, an augmentation of lobe expansion through a feedback loop (Step II). This feedback-driven augmentation of lobe depth is absent in the any1 mutant, where cellulose crystallinity and alignment are low.

Comment in

  • Seeing the Cell Wall in a New Light.
    Shaw SL. Shaw SL. Plant Physiol. 2019 Sep;181(1):9-11. doi: 10.1104/pp.19.00776. Plant Physiol. 2019. PMID: 31467140 Free PMC article. No abstract available.

References

    1. Altartouri B, Geitmann A (2015) Understanding plant cell morphogenesis requires real-time monitoring of cell wall polymers. Curr Opin Plant Biol 23: 76–82 - PubMed
    1. Anderson CT, Carroll A, Akhmetova L, Somerville C (2010) Real-time imaging of cellulose reorientation during cell wall expansion in Arabidopsis roots. Plant Physiol 152: 787–796 - PMC - PubMed
    1. Aouar L, Chebli Y, Geitmann A (2010) Morphogenesis of complex plant cell shapes: The mechanical role of crystalline cellulose in growing pollen tubes. Sex Plant Reprod 23: 15–27 - PubMed
    1. Armour WJ, Barton DA, Law AM, Overall RL (2015) Differential growth in periclinal and anticlinal walls during lobe formation in Arabidopsis cotyledon pavement cells. Plant Cell 27: 2484–2500 - PMC - PubMed
    1. Belteton SA, Sawchuk MG, Donohoe BS, Scarpella E, Szymanski DB (2018) Reassessing the roles of PIN proteins and anticlinal microtubules during pavement cell morphogenesis. Plant Physiol 176: 432–449 - PMC - PubMed

Publication types

LinkOut - more resources