. 2019 Jul 30;10(4):e00903-19.
doi: 10.1128/mBio.00903-19.

Mice Fed an Obesogenic Western Diet, Administered Antibiotics, and Subjected to a Sterile Surgical Procedure Develop Lethal Septicemia with Multidrug-Resistant Pathobionts

Affiliations

Mice Fed an Obesogenic Western Diet, Administered Antibiotics, and Subjected to a Sterile Surgical Procedure Develop Lethal Septicemia with Multidrug-Resistant Pathobionts

Sanjiv K Hyoju et al. mBio. .

Abstract

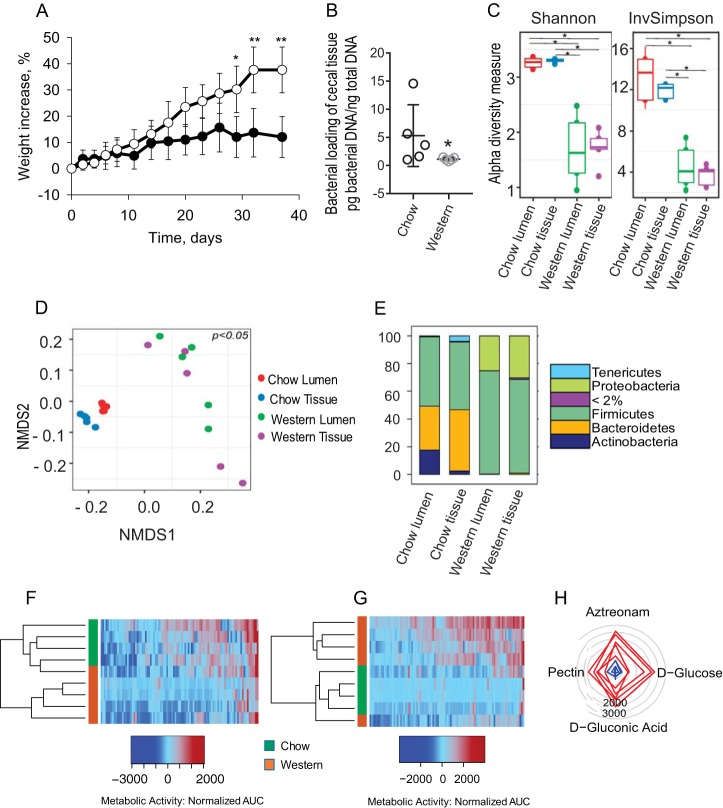
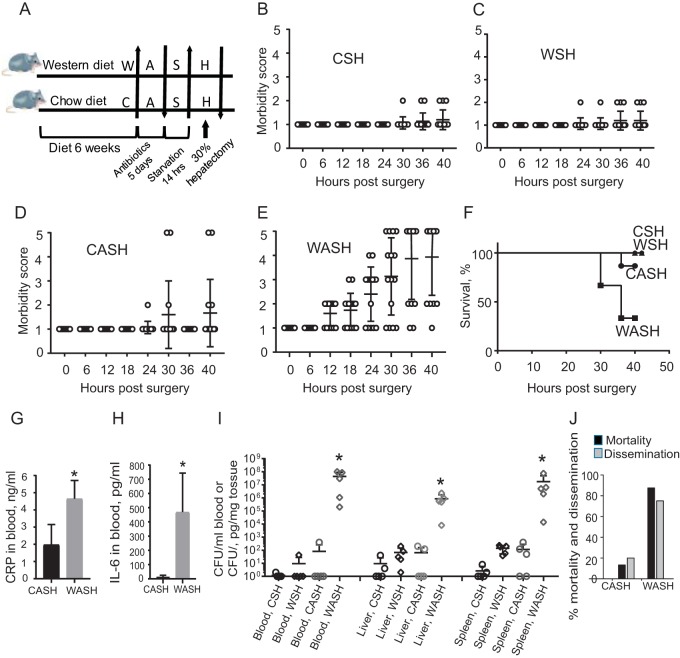
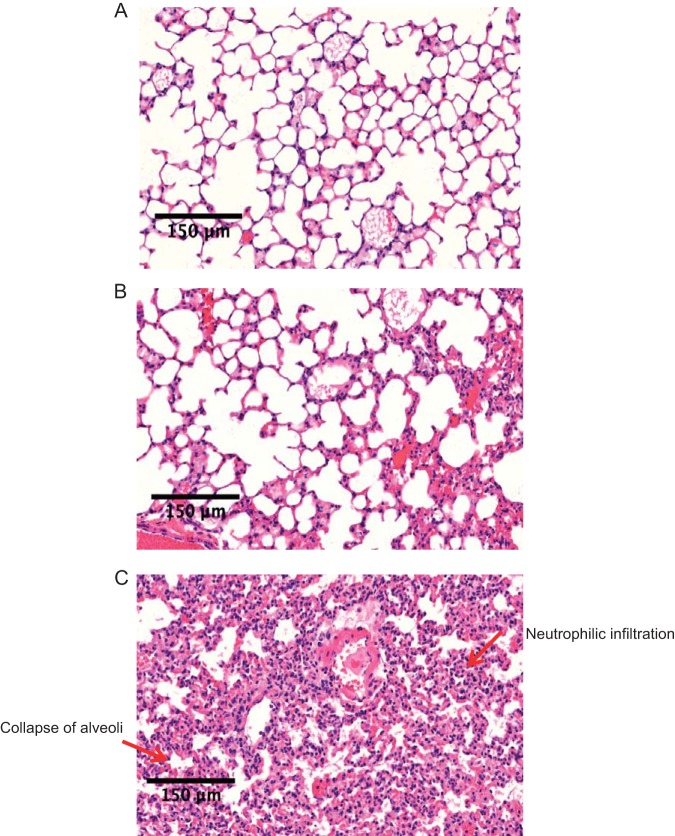
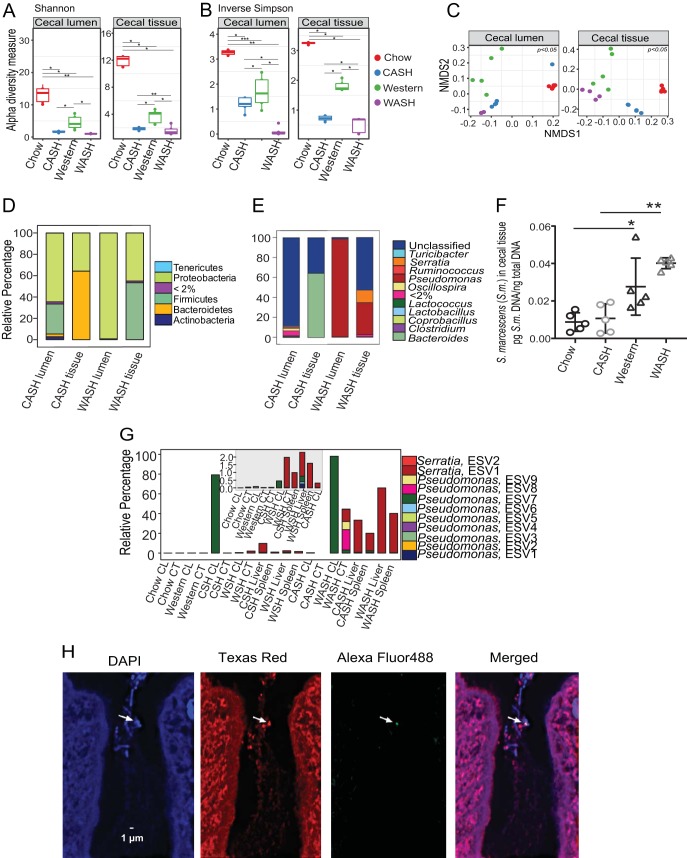
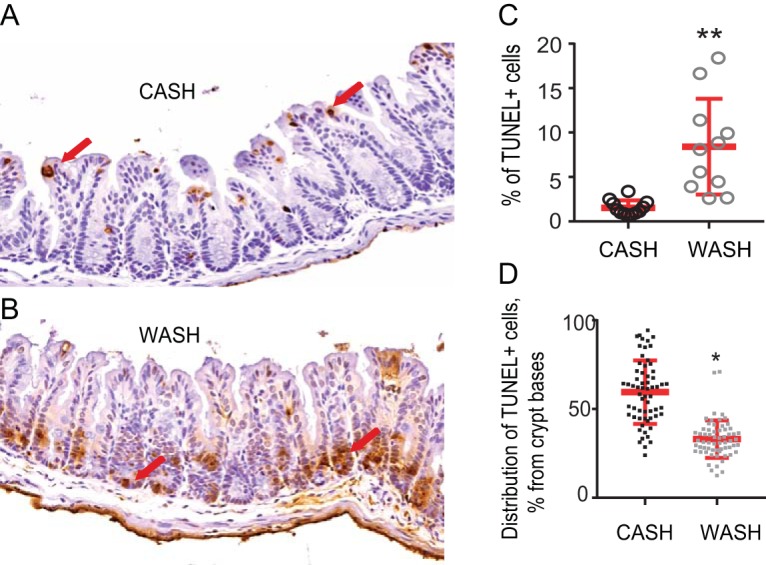
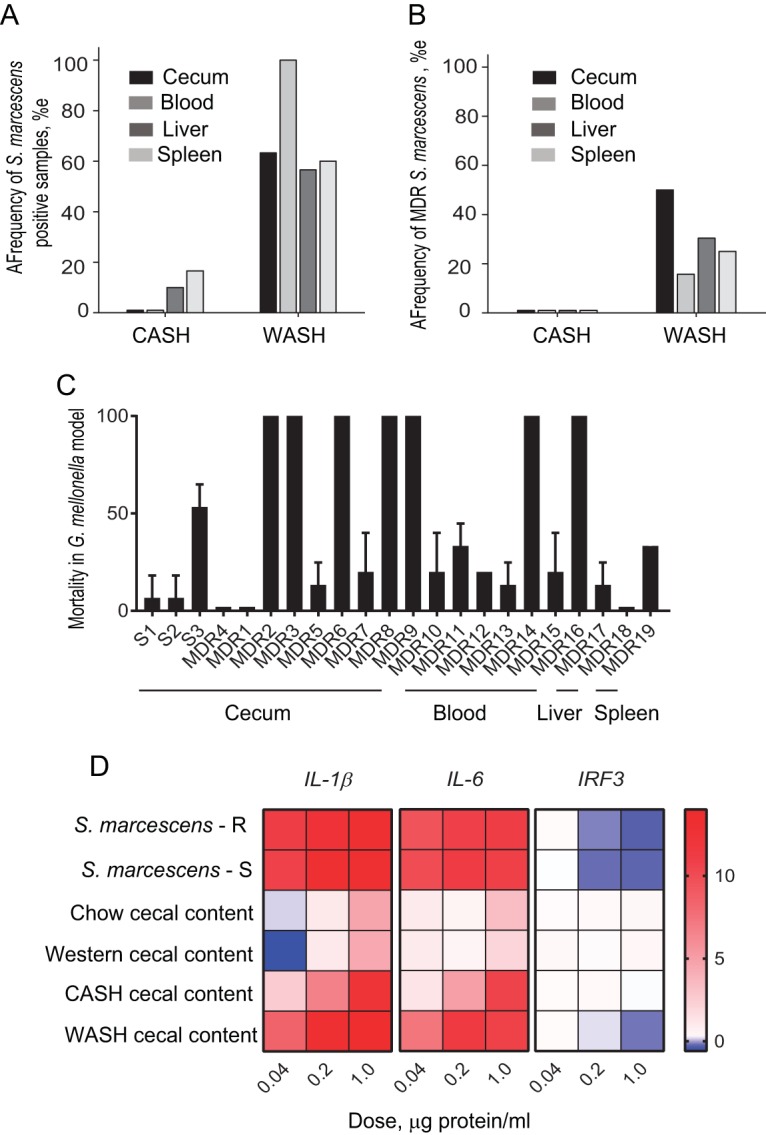
Despite antibiotics and sterile technique, postoperative infections remain a real and present danger to patients. Recent estimates suggest that 50% of the pathogens associated with postoperative infections have become resistant to the standard antibiotics used for prophylaxis. Risk factors identified in such cases include obesity and antibiotic exposure. To study the combined effect of obesity and antibiotic exposure on postoperative infection, mice were allowed to gain weight on an obesogenic Western-type diet (WD), administered antibiotics and then subjected to an otherwise recoverable sterile surgical injury (30% hepatectomy). The feeding of a WD alone resulted in a major imbalance of the cecal microbiota characterized by a decrease in diversity, loss of Bacteroidetes, a bloom in Proteobacteria, and the emergence of antibiotic-resistant organisms among the cecal microbiota. When WD-fed mice were administered antibiotics and subjected to 30% liver resection, lethal sepsis, characterized by multiple-organ damage, developed. Notable was the emergence and systemic dissemination of multidrug-resistant (MDR) pathobionts, including carbapenem-resistant, extended-spectrum β-lactamase-producing Serratia marcescens, which expressed a virulent and immunosuppressive phenotype. Analysis of the distribution of exact sequence variants belonging to the genus Serratia suggested that these strains originated from the cecal mucosa. No mortality or MDR pathogens were observed in identically treated mice fed a standard chow diet. Taken together, these results suggest that consumption of a Western diet and exposure to certain antibiotics may predispose to life-threating postoperative infection associated with MDR organisms present among the gut microbiota.IMPORTANCE Obesity remains a prevalent and independent risk factor for life-threatening infection following major surgery. Here, we demonstrate that when mice are fed an obesogenic Western diet (WD), they become susceptible to lethal sepsis with multiple organ damage after exposure to antibiotics and an otherwise-recoverable surgical injury. Analysis of the gut microbiota in this model demonstrates that WD alone leads to loss of Bacteroidetes, a bloom of Proteobacteria, and evidence of antibiotic resistance development even before antibiotics are administered. After antibiotics and surgery, lethal sepsis with organ damage developed in in mice fed a WD with the appearance of multidrug-resistant pathogens in the liver, spleen, and blood. The importance of these findings lies in exposing how the selective pressures of diet, antibiotic exposure, and surgical injury can converge on the microbiome, resulting in lethal sepsis and organ damage without the introduction of an exogenous pathogen.

Keywords: Western diet; gut microbiome; gut-derived sepsis; pathobionts; surgery.


Figures

FIG 1
FIG 1
Role of Western diet on gut microbial structure, membership, and function. (A) Change in mouse weight (%) over time: Western diet (open circles) versus chow (solid circles). *, P < 0.0001 (chow, n = 4; Western diet, n = 5). Statistical bars depict the standard errors (SEM). (B) Total bacterial DNA concentration in cecal tissue as determined by qPCR (n = 5 per group, P = 0.037 [nonparametric Mann-Whitney test]). (C) Alpha diversity based on Shannon and inverse Simpson (invSimpson) indexes. Asterisks indicate statistical significant differences (n = 5 mice per group; *, P < 0.05). (D) Nonmetric multidimensional scaling (NMDS) plots based on weighted UniFrac dissimilarity matrix between the four groups (n = 5 mice per group). The multigroup PERMANOVA revealed significant differences between groups: chow lumen versus chow tissue (P = 0.01); chow tissue versus Western tissue (P = 0.002); and chow lumen versus Western lumen (P = 0.004). There was no significant difference for Western lumen versus Western tissue. (E) Stack plots showing distribution of phyla with a relative abundance of >2%. The taxa with <2% abundance are placed under one category, i.e., “<2%.” Statistical analysis tested for the differential abundance at a P value of <0.05 with the Benjamini-Hochberg FDR correction in ANCOM (n = 5 mice per group). (F and G) Heat maps of phenotype microarrays tested with GENIII plate under anaerobic (F) and aerobic (G) conditions (chow, n = 4; Western diet, n = 5). (H) Radial plot representing the set of substrates with significantly higher metabolic activity of microbial populations from Western diet-fed versus chow-fed mice. Radial numbers represent the AUC values. Each line on the plot represents an individual mouse. The degree to which the line deviates toward a given metabolite on the plot represents the predisposition of the bacterial community to metabolize that metabolite.
FIG 2
FIG 2
Effect of Western diet (W) on lethal sepsis following antibiotic exposure (A), short-term starvation (S), and a 30% hepatectomy (H) (WASH). (A) Experimental protocol. (B to E) Postoperative morbidity scores in CSH (chow + starvation + hepatectomy), CASH (chow + antibiotics + starvation + hepatectomy), WSH (Western diet + starvation + hepatectomy), and WASH (Western diet + antibiotics + starvation + hepatectomy). Morbidity scores (MS): MS1, healthy mice; MS2, ruffled fur, normal fecal pellets (three to four pellets over 24 h); MS3, ruffled fur, fewer fecal pellets (one to two pellets over 24 h), hunched posture, increased respirations; MS4, ruffled fur, no pellets, hunched posture, increased respirations, do not move to touch; and MS5, animal on side, minimally responsive, rapid shallow respirations, gasping, moribund. WASH treatment compared to all groups: P < 0.0001 at 18, 24, 30, 36, and 40 h (n = 15/group [two-way ANOVA]). (F) Kaplan-Meier survival curves. WASH treatment compared to all other groups: P < 0.0001 (n = 15 mice/group, log-rank [Mantel-Cox] test). (G) Serum CRP for CASH and WASH treatments in blood samples collected at POD2 (n = 5 per group; *, P = 0.0008 [by t test]). Statistical bars depict the SEM. (H) Serum IL-6 from CASH and WASH treatments (n = 5 per group; *, P = 0.0135 [by t test]). Statistical bars depict the SEM. (I) Quantitative culture results on MacConkey plates: *, P = 0.003 (n = 5 per group [Mann-Whitney test]). (J) Percent mortality/dissemination across all experimental runs (n = 30, CASH treatment group; n = 40, WASH treatment group).
FIG 3
FIG 3
Effect of WASH treatment on organ damage. The lung histology of untreated (A), CASH-treated (B), and WASH-treated (C) mice is shown.
FIG 4
FIG 4
Comparative analysis of the cecal microbiota in CASH- and WASH-treated mice. (A and B) Alpha diversities based on Shannon (A) and invSimpson indexes (B). n = 5 mice per group; *, P < 0.05. (C) NMDS plots based on weighted UniFrac dissimilarity matrix: chow lumen versus CASH lumen (P = 0.002), chow tissue versus CASH tissue (P = 0.01), Western lumen versus WASH lumen (P = 0.03), Western tissue versus WASH tissue (P = 0.04), CASH lumen versus WASH lumen (P = 0.01), and CASH tissue versus WASH tissue (P = 0.03), evaluated using multigroup PERMANOVA. (D and E) Stack plots showing distribution of phyla (D) and genera (E) with relative abundances of >2%. A P value of <0.05 was determined with the Benjamini-Hochberg FDR correction in ANCOM. (F) qPCR analysis of cecal tissue-associated S. marcescens: Western versus chow (*, P = 0.048, n = 5 per group) and WASH versus CASH (**, P = 0.0005, n = 5 per group), determined using an unpaired t test with Welch’s corrections. (G) Distribution of ESVs belonging to the genera Serratia and Pseudomonas. The smaller inset shows the distribution of ESVs with low abundance (i.e., <2%). (H) FISH analysis of cecal tissue of untreated chow-fed mice indicates the presence of S. marcescens within a bacterial cluster inside a crypt (indicated by an arrow).
FIG 5
FIG 5
Effect of WASH treatment on cecal crypts. (A and B) Representative images demonstrating the abundance and distribution of TUNEL-positive cells in the cecal crypts of CASH-treated (A) and WASH-treated (B) mice. (C) Percent TUNEL-positive cells in cecal crypts (n = 3 mice [one-third of each tissue slide was counted separately]; **, P = 0.0017). (D) Percent distance of distribution of TUNEL-positive cells from the base to the top of the crypts (n = 3 mice [62 crypts with TUNEL-positive cells were counted per group]; *, P < 0.0001 [unpaired t test with Welch’s corrections]).
FIG 6
FIG 6
Quantitative and qualitative analysis of retrieved strains of Serratia marcescens. (A) Frequency of S. marcescens culture-positive organs in CASH and WASH treatment groups (n = 30 mice per group). (B) Frequency of S. marcescens MDR strains among isolates. (C) Virulence/killing assays using Galleria mellonella injected with selected antibiotic-sensitive and MDR strains of S. marcescens isolated from WASH-treated mice. Time of incubation after injection, 14 h (n = 45 larvae per bacterial strain [15 larvae × 3 biological replicates]). L, liver; S, spleen. (D) Heat maps representing the expression of genes encoding IL-1β, IL-6, and IRF3 in MEF cells in response to filtered lysates of S. marcescens and cecal contents from chow-fed, Western diet-fed, and CASH- and WASH-treated groups. The data are normalized to the expression of GAPDH (n = 3 per group). Error bars indicate the SEM.

Comment in

References

    1. Torpy JM, Burke AE, Glass RM. 2010. JAMA patient page: postoperative infections. JAMA 303:2544. doi: 10.1001/jama.303.24.2544. - DOI - PubMed
    1. Sullivan E, Gupta A, Cook CH. 2017. Cost and consequences of surgical site infections: a call to arms. Surg Infect 18:451–454. doi: 10.1089/sur.2017.072. - DOI - PubMed
    1. Stone PW. 2009. Economic burden of healthcare-associated infections: an American perspective. Expert Rev Pharmacoecon Outcomes Res 9:417–422. doi: 10.1586/erp.09.53. - DOI - PMC - PubMed
    1. Călina D, Docea AO, Rosu L, Zlatian O, Rosu AF, Anghelina F, Rogoveanu O, Arsene AL, Nicolae AC, Drăgoi CM, Tsiaoussis J, Tsatsakis AM, Spandidos DA, Drakoulis N, Gofita E. 2017. Antimicrobial resistance development following surgical site infections. Mol Med Rep 15:681–688. doi: 10.3892/mmr.2016.6034. - DOI - PMC - PubMed
    1. Micek ST, Hampton N, Kollef M. 2018. Risk factors and outcomes for ineffective empiric treatment of sepsis caused by Gram-negative pathogens: stratification by onset of infection. Antimicrob Agents Chemother 62. doi: 10.1128/AAC.00007-18. - DOI - PMC - PubMed

Publication types