. 2019 Jul 30;10(4):e00937-19.
doi: 10.1128/mBio.00937-19.

Endogenous Retrovirus-Derived Long Noncoding RNA Enhances Innate Immune Responses via Derepressing RELA Expression

Affiliations

Endogenous Retrovirus-Derived Long Noncoding RNA Enhances Innate Immune Responses via Derepressing RELA Expression

Bin Zhou et al. mBio. .

Abstract

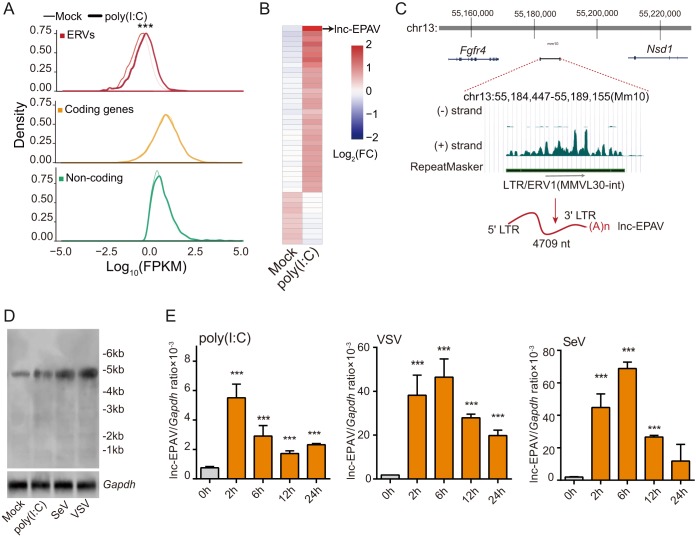
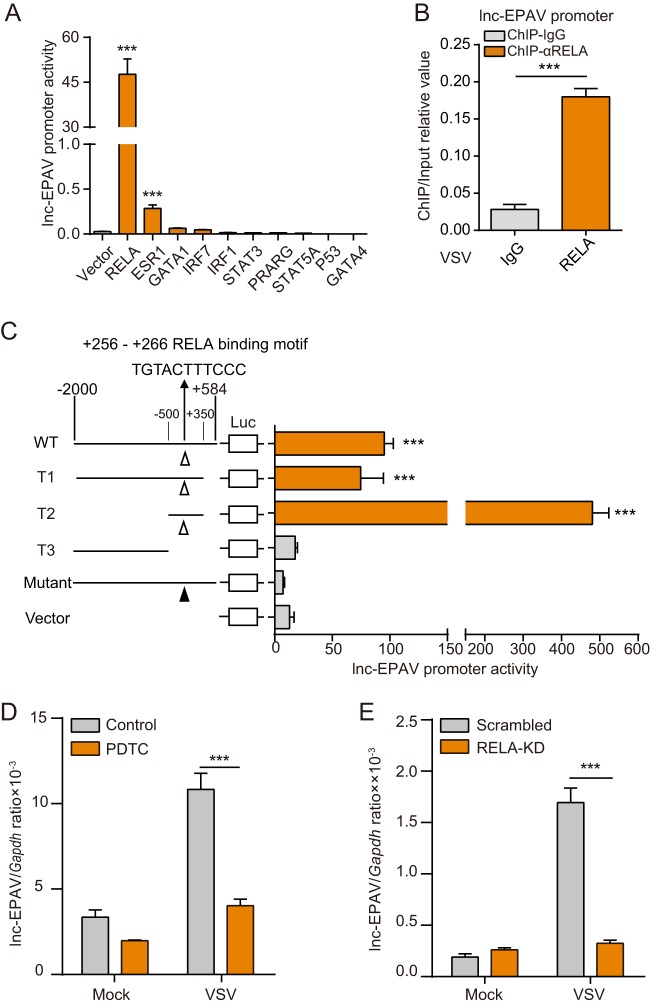
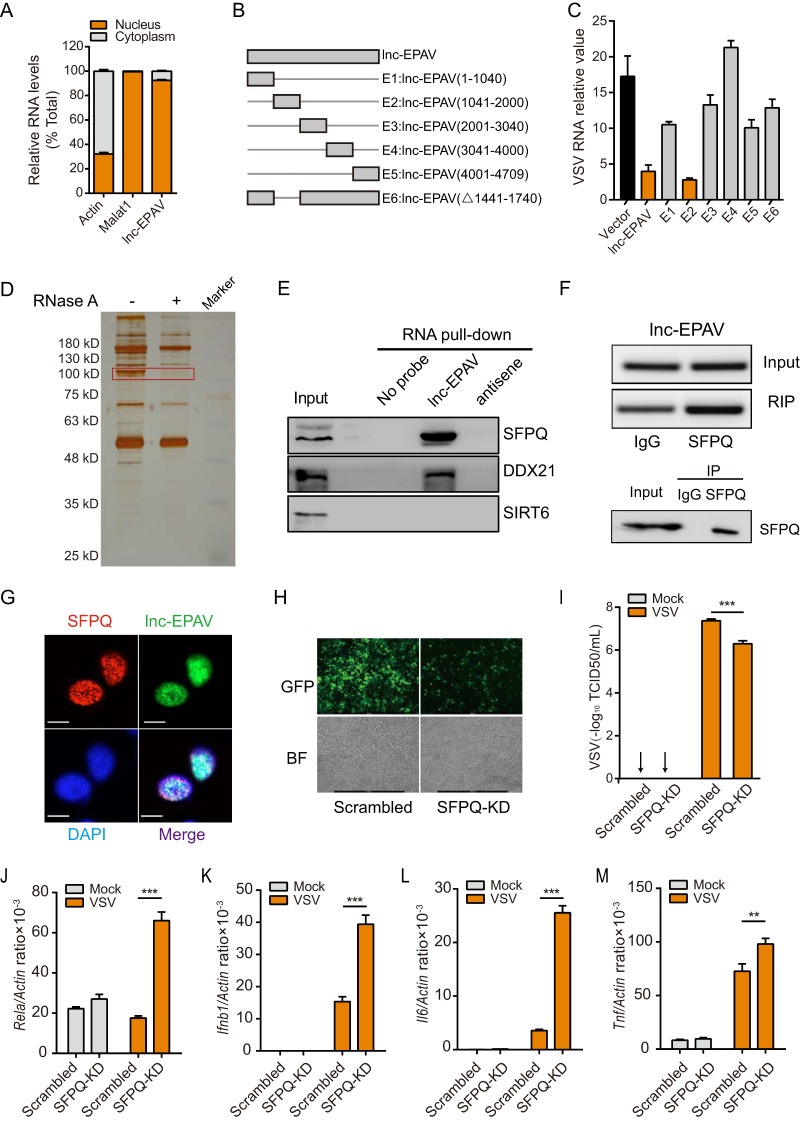
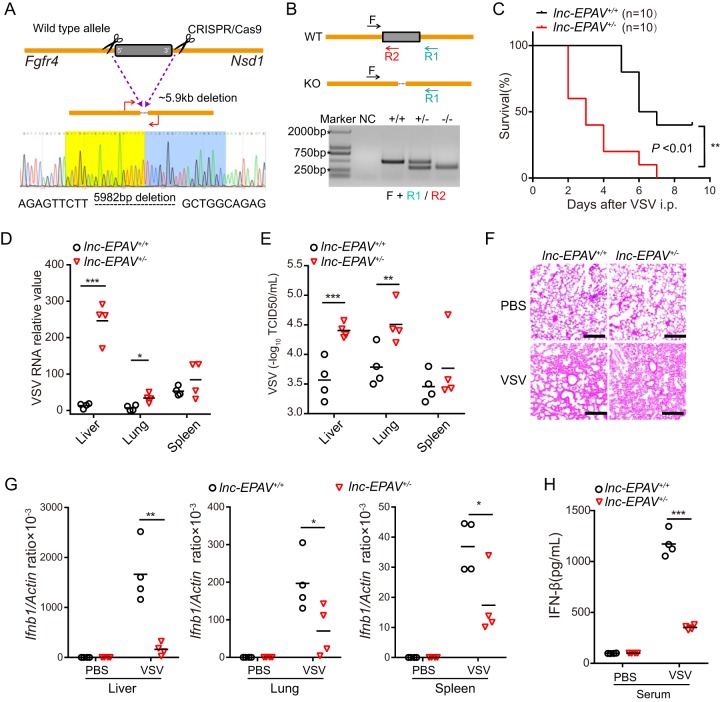
Endogenous retroviruses (ERVs) are transposable elements that cause host genome instability and usually play deleterious roles in disease such as tumorigenesis. Recent advances also suggest that this "enemy within" may encode a viral mimic to induce antiviral immune responses through viral sensors. Here, through whole-genome transcriptome analysis with RNA sequencing (RNA-Seq), we discovered that a full-length ERV-derived long noncoding RNA (lncRNA), designated lnc-EPAV (ERV-derived lncRNA positively regulates antiviral responses), was a positive regulator of NF-κB signaling. lnc-EPAV expression was rapidly upregulated by viral RNA mimics or RNA viruses to facilitate the expression of RELA, an NF-κB subunit that plays a crucial role in antiviral responses. Transcriptome analysis of lnc-EPAV-silenced macrophages showed that lnc-EPAV was critical for RELA target gene expression and innate immune responses. Consistently, lnc-EPAV-deficient mice exhibited reduced expression of type I interferons (IFNs) and, consequently, increased viral loads and mortality following lethal RNA virus infection. Mechanistically, lnc-EPAV promoted expression of RELA by competitively binding to and displacing SFPQ, a transcriptional repressor of Rela Altogether, our work demonstrates an alternative mechanism by which ERVs regulate antiviral immune responses.IMPORTANCE Endogenous retroviruses are transposable genetic elements comprising 8% to 10% of the human and mouse genomes. Although most ERVs have been inactivated due to deleterious mutations, some are still transcribed. However, the biological functions of transcribed ERVs are largely unknown. Here, we identified a full-length ERV-derived lncRNA, designated lnc-EPAV, as a positive regulator of host innate immune responses. We found that silencing lnc-EPAV impaired virus-induced cytokine production, resulting in increased viral replication in cells. The lnc-EPAV-deficient mice exhibited enhanced susceptibility to viral challenge. We also found that lnc-EPAV regulated expression of RELA, an NF-κB subunit that plays a critical role in antiviral responses. ERV-derived lncRNA coordinated with a transcription repressor, SFPQ, to control Rela transcription. Our report provides new insights into the previously unrecognized immune gene regulatory mechanism of ERV-derived lncRNAs.

Keywords: NF-κB; antiviral immune responses; endogenous retroviruses; gene regulation; lncRNA.


Figures

FIG 1
FIG 1
ERV-derived noncoding RNAs are induced by poly(I·C) stimulation in BMDMs. (A) Standardized expression levels (density distribution plots, log10 FPKM) of ERV-derived transcripts, coding genes (NM in RefSeq gene annotation), and known noncoding RNAs (NR in RefSeq gene annotation) in BMDMs treated with 10 μg/ml poly(I·C) for 2 h. ***, P < 0.001 (Kolmogorov-Smirnov test [KS test]). (B) Heat map of differentially expressed FL-ERVs (FPKM, ≥1; fold change, ≥2) in BMDMs stimulated with poly(I·C) versus mock stimulation. Expression levels are coded in colors ranging from blue (downregulation) to red (upregulation). (C) Schematic diagram of lnc-EPAV. lnc-EPAV is located on chromosome 13qB1 and is flanked by the coding genes Fgfr4 and Nsd1 (upper panel). FL-ERV-derived lncRNA lnc-EPAV is transcribed from positive (+) DNA strand (lower panel). (D and E) The lnc-EPAV expression was determined by Northern blotting analysis (D) and qPCR analysis (E) in BMDMs. BMDMs were stimulated with poly(I·C) (10 μg/ml) or infected with SeV or VSV for the indicated times. Data shown represent means ± SEM. ***, P < 0.001 (Student′s t test). Data are representative of results from at least three independent experiments.
FIG 2
FIG 2
lnc-EPAV is activated by NF-κB subunit RELA. (A) Dual-luciferase assays of lnc-EPAV promoter activity in HEK293T cells transfected with either an empty vector or the indicated transcription factor plasmids. (B) ChIP-qPCR analysis of RELA binding in the lnc-EPAV promoter in BMDMs infected with VSV (multiplicity of infection [MOI] = 0.1) for 6 h. (C) Schematic illustration of truncation and mutation constructs of lnc-EPAV promoter region (nt −2000 to +584 relative to TSS) (left). Quantification of the lnc-EPAV promoter activity in HEK293T cells transfected with various truncated variants of lnc-EPAV promoter together with RELA plasmid (right). (D) qPCR analysis of lnc-EPAV expression from BMDMs pretreated with PDTC (10 μM) for 6 h and then infected with VSV (MOI = 0.1) for 12 h. (E) qPCR analysis of lnc-EPAV expression from J774A.1 macrophages stably expressing either scrambled shRNA or Rela-targeting shRNA after VSV infection (MOI = 0.1) for 12 h. KD, knockdown. Data shown represent means ± SEM. ***, P < 0.001 (Student′s t test). Data are representative of results from at least three independent experiments.
FIG 3
FIG 3
lnc-EPAV positively regulates cellular antiviral responses. (A) Microscopic images of VSV-GFP-infected J774A.1 macrophages stably expressing either scrambled shRNA or lnc-EPAV-targeting shRNA (objective, 5×). BF, bright-field. (B and C) Quantification of intracellular VSV loads by qPCR (B) or of infectious viral particles in the culture medium by plaque assay (C) from J774A.1 macrophages stably expressing either scrambled shRNA or lnc-EPAV-targeting shRNA after VSV infection (MOI = 0.1) for 12 h. (D) GSEA was performed with KEGG gene sets by comparing RNA-seq data between lnc-EPAV knockdown J774A.1 macrophages and control macrophages infected with VSV (MOI = 0.1) for 12 h. Shown are the top 10 significantly enriched KEGG pathways. (E) GSEA was performed with transcription factor target set (MSigDB C3-TFT) in lnc-EPAV knockdown cells versus control cells after VSV infection (MOI = 0.1) for 12 h. (F to H) qPCR quantification of Ifnb1 (F), Il6 (G), and Tnf (H) expression levels from J774A.1 macrophages stably expressing either scrambled shRNA or lnc-EPAV-targeting shRNA after VSV infection (MOI = 0.1) for 12 h. (I to K) Quantification by type I IFN bioassays or ELISA of secreted IFN-β (I), IL-6 (J), and TNF-α (K) levels from J774A.1 macrophages stably expressing either scrambled shRNA or lnc-EPAV-targeting shRNA after VSV infection (MOI = 0.1) for 12 h. (L and M) qPCR analysis of Rela mRNA expression (L) and immunoblot analysis of RELA protein expression (M) from J774A.1 macrophages stably expressing either scrambled shRNA or Sfpq-targeting shRNA after VSV infection (MOI = 0.1) for 12 h. (N) Forced expression of RELA could reverse the effects of silencing lnc-EPAV on viral replication. Data represent results of qPCR analysis of intracellular VSV loads from J774A.1 macrophages expressing the indicated shRNAs and expression plasmids after VSV infection (MOI = 0.1) for 12 h. Data shown represent means ± SEM. **, P < 0.01; ***, P < 0.001 (Student′s t test). Data are representative of results from at least three independent experiments.
FIG 4
FIG 4
Identification of SFPQ as a binding protein of lnc-EPAV. (A) qPCR of lnc-EPAV expression levels between nuclear and cytoplasmic compartments from BMDMs. Equivalent amounts of nuclear and cytoplasmic RNAs were used as the templates. (B) Schematic diagram of various truncation and deletion mutations of lnc-EPAV. (C) Quantification by qPCR of intracellular VSV loads from J774A.1 macrophages overexpressing lnc-EPAV or its truncation and deletion mutations after VSV infection (MOI = 0.1) for 12 h. (D) Silver staining of biotinylated lnc-EPAV-associated proteins. The lnc-EPAV-specific bands (highlighted bands) were excised and analyzed by mass spectrometry. (E) Immunoblots of proteins from RNA pulldown assay by biotinylated lnc-EPAV or antisense RNA. SIRT6 was used as a negative control. (F) SFPQ RIP followed by RT-PCR analysis of copurified RNAs from non-cross-linked BMDMs. (G) RNA FISH detecting endogenous lnc-EPAV (green) combined with immunofluorescence staining of SFPQ (red) in BMDMs. DAPI staining is shown in blue. Bar, 10 μM. (H) Microscopic images of VSV-GFP-infected SFPQ-knockdown J774A.1 macrophages (objective, 5×). (I) Quantification of infectious VSV particles in the culture medium by 50% tissue culture infective dose (TCID50) assay from J774A.1 macrophages stably expressing either scrambled shRNA or Sfpq-targeting shRNA, after VSV infection (MOI = 0.1) for 12 h. BF, bright-field. (J to M) qPCR analysis of Rela (J), Ifnb1 (K), Il6 (L), and Tnf (M) expression from J774A.1 macrophages stably expressing either scrambled shRNA or Sfpq-targeting shRNA after VSV infection (MOI = 0.1) for 12 h. Data shown represent means ± SEM. **, P < 0.01; ***, P < 0.001 (Student′s t test). Data are representative of results from at least three independent experiments.
FIG 5
FIG 5
lnc-EPAV cooperates with SFPQ to regulate Rela. (A) The distribution of putative SFPQ binding sites was enriched around the TSS gene (−3 kb to +3 kb around TSS). (B) Gene tracks software (Integrated Genome Browser) was used for ChIP-seq analysis of SFPQ enrichment at the promoter region of Rela in BMDMs with or without VSV infection. (C and D) ChIP-qPCR analysis (C) and ChIP-PCR analysis (D) of SFPQ in the Rela promoter in BMDMs infected with VSV (MOI = 0.1) for 12 h. (E) qPCR analysis of Rela mRNA expression level in BMDM after VSV infection (MOI = 0.1) for 6 h. (F) Immunoblot analysis of RELA protein expression level in BMDM after VSV infection (MOI = 0.1) for 12 h. (G) Dual-luciferase assays of Rela promoter activity in SFPQ-overexpressing cells (SFPQ-OE; left) or SFPQ-knockdown cells (SFPQ-KD; right) after VSV infection (MOI = 0.1) for 12 h. (H) Immunoblotting analysis of SFPQ protein in BMDMs infected with VSV (MOI = 0.1) for the indicated times. (I) ChIP-qPCR analysis of SFPQ in the Rela promoter in J774A.1 macrophages stably expressing either scrambled shRNA or lnc-EPAV-targeting shRNA after VSV infection (MOI = 0.1) for 12 h. (J) qPCR analysis of Rela expression level in J774A.1 macrophages expressing the indicated shRNA after VSV infection (MOI = 0.1) for 12 h. (K) qPCR analysis of Rela expression level in J774A.1 macrophages expressing the indicated shRNA or lnc-EPAV overexpression vectors after VSV infection (MOI = 0.1) for 12 h. Data shown represent means ± SEM. ns, not significant; ***, P < 0.001 (Student′s t test). Data are representative of results from at least three independent experiments.
FIG 6
FIG 6
lnc-EPAV protects mice against viral infection. (A) Schematic diagram of CRISPR/Cas9 knockout strategies at lnc-EPAV loci. A deletion of 5,982 bp was confirmed by Sanger sequencing. (B) Genotyping of lnc-EPAV knockout (KO) mice. Genomic DNA PCR products were derived from wild-type, monoallelic-deletion, or biallelic-deletion mice. NC, negative control. (C) Survival of 6-to-8-week-old lnc-EPAV+/+ or lnc-EPAV+/− mice (n = 10 mice per group) after intraperitoneal (i.p.) injection of VSV (5 × 107 plaque forming units [PFU] per mouse). **, P < 0.01 (log rank test). (D and E) qPCR analysis of VSV RNA (D) and TCID50 assay of VSV particles (E) in the liver, lung, and spleen of lnc-EPAV+/+ and lnc-EPAV+/− mice infected with VSV (5 × 107 PFU per mouse) via intraperitoneal injection for 48 h. *, P < 0.05; **, P < 0.01; ***, P < 0.001 (Student′s t test). (F) Hematoxylin-and-eosin staining of sections of lungs from mice processed as described for panel B. Bars, 50 μm. PBS, phosphate-buffered saline. (G) qPCR analysis of Ifnb1 expression in the liver (left panel), lung (center panel), and spleen (right panel) from mice as in B. *, P < 0.05; **, P < 0.01 (Student′s t test). (H) IFN-β protein levels in serum from mice processed as described for panel B. ***, P < 0.001 (Student′s t test).
FIG 7
FIG 7
Model of ERV-derived lncRNA in the regulation of antiviral immune responses via RELA. (Left panel) In the resting state, lnc-EPAV was expressed at a low level. SFPQ acted as a transcriptional repressor of key immune gene Rela. (Right panel) After virus infection, lnc-EPAV expression was rapidly upregulated and lnc-EPAV was caused to accumulate in the nucleus by the activation of NF-κB/RELA. lnc-EPAV promoted the transcription of Rela by competitively binding to and displacing SFPQ, which forms a positive-feedback loop to enhance the antiviral immune responses. After host cells eliminated the infected virus, some putative repressors negatively regulated the activation of RELA, consequently reducing the expression of lnc-EPAV.

Similar articles

Cited by

References

    1. Stocking C, Kozak CA. 2008. Murine endogenous retroviruses. Cell Mol Life Sci 65:3383–3398. doi:10.1007/s00018-008-8497-0. - DOI - PMC - PubMed
    1. Johnson WE. 2015. Endogenous retroviruses in the genomics era. Annu Rev Virol 2:135–159. doi:10.1146/annurev-virology-100114-054945. - DOI - PubMed
    1. Rebollo R, Romanish MT, Mager DL. 2012. Transposable elements: an abundant and natural source of regulatory sequences for host genes. Annu Rev Genet 46:21–42. doi:10.1146/annurev-genet-110711-155621. - DOI - PubMed
    1. Feschotte C, Gilbert C. 2012. Endogenous viruses: insights into viral evolution and impact on host biology. Nat Rev Genet 13:283–296. doi:10.1038/nrg3199. - DOI - PubMed
    1. Gemmell P, Hein J, Katzourakis A. 2016. Phylogenetic analysis reveals that ERVs “die young” but HERV-H is unusually conserved. PLoS Comput Biol 12:e1004964. doi:10.1371/journal.pcbi.1004964. - DOI - PMC - PubMed

Publication types

LinkOut - more resources