. 2019 Jul 30;10(4):e01002-19.
doi: 10.1128/mBio.01002-19.

Chromosome Dynamics in Bacteria: Triggering Replication at the Opposite Location and Segregation in the Opposite Direction

Affiliations

Chromosome Dynamics in Bacteria: Triggering Replication at the Opposite Location and Segregation in the Opposite Direction

Ady B Meléndez et al. mBio. .

Abstract

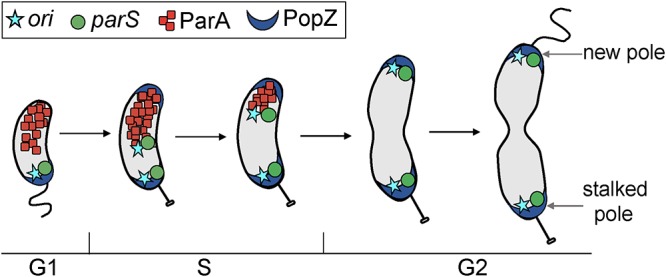
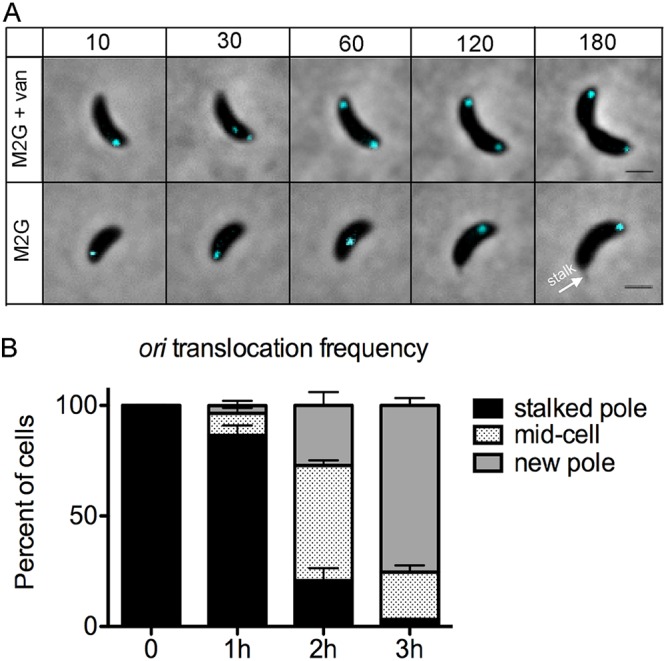
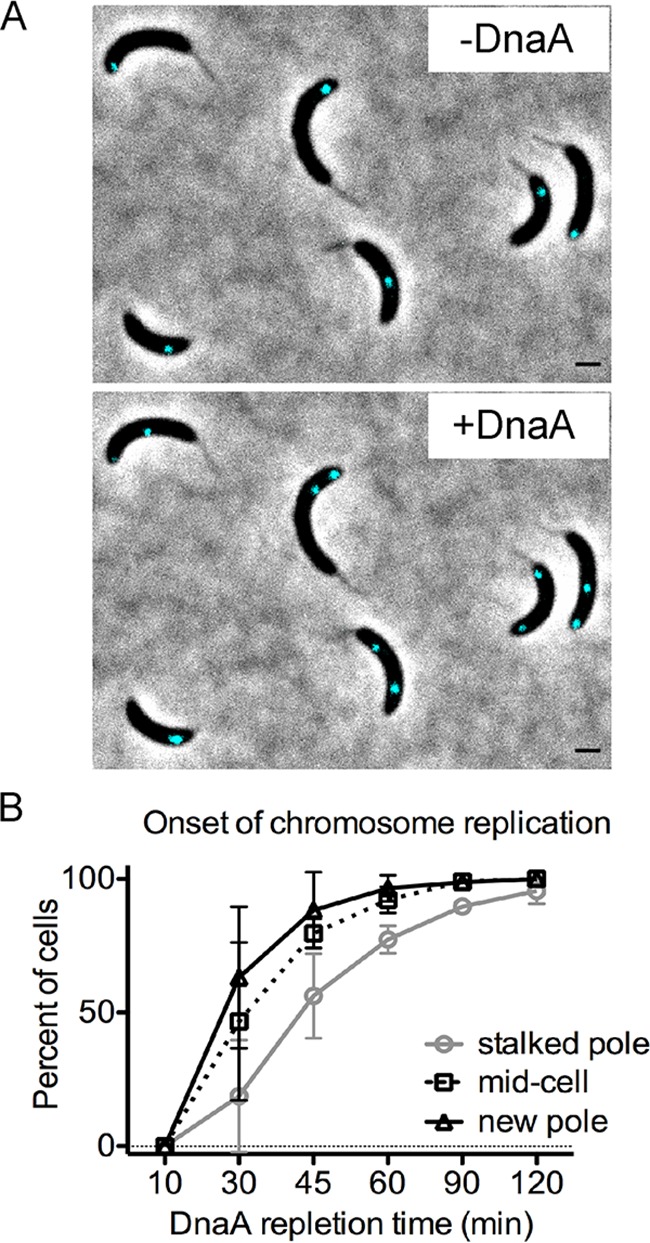
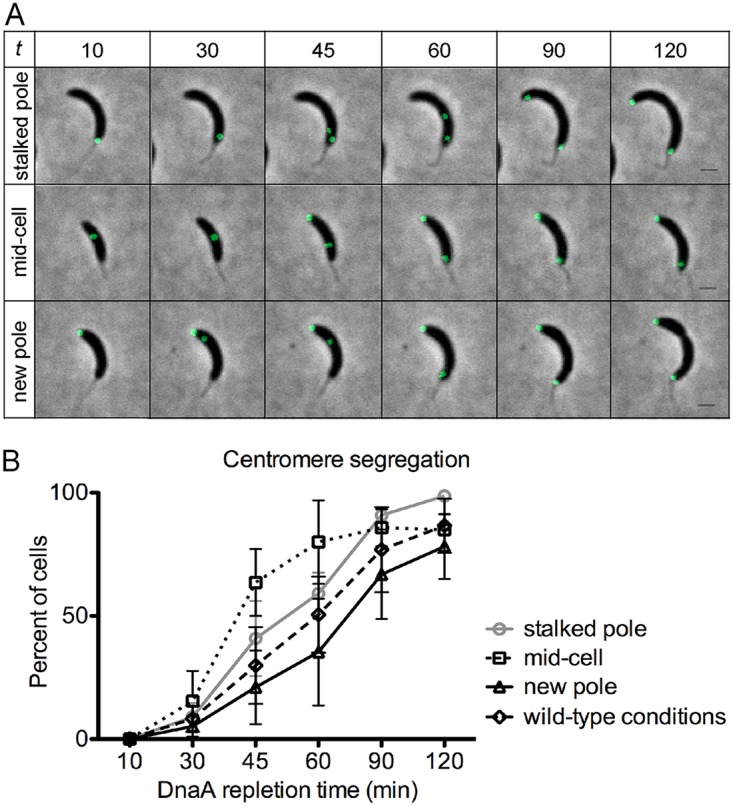
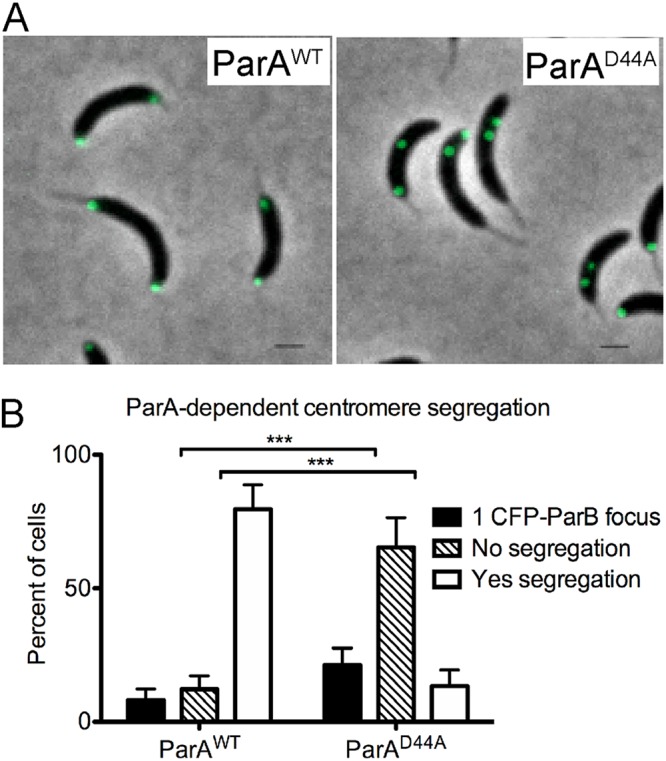
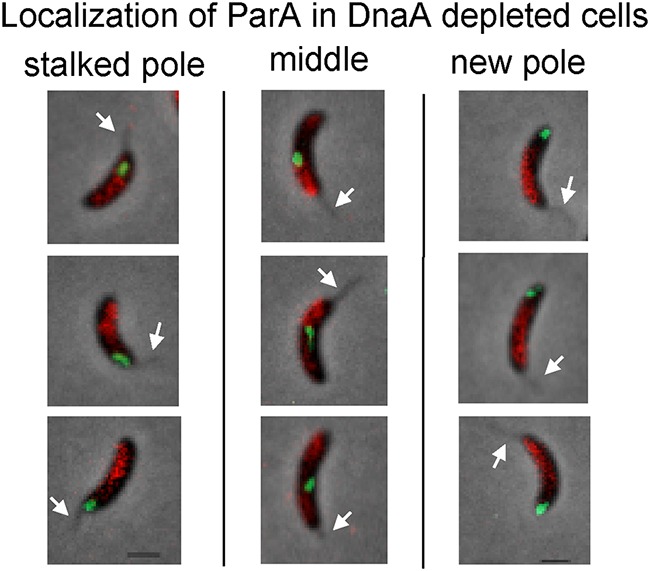
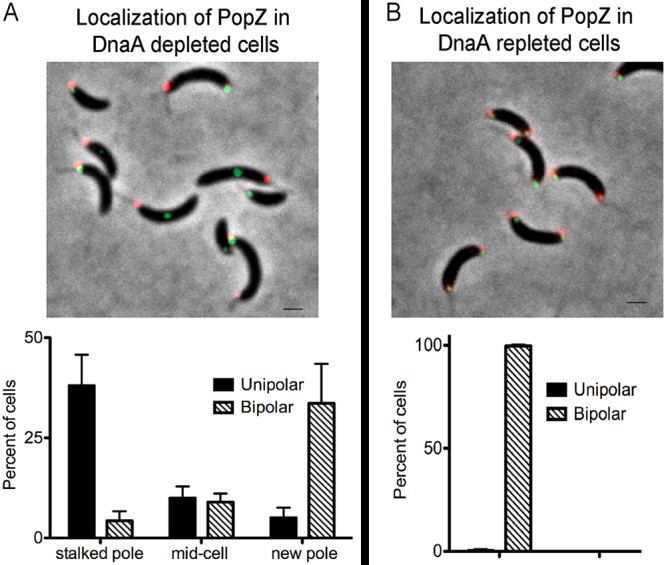
Maintaining the integrity of the genome is essential to cell survival. In the bacterium Caulobacter crescentus, the single circular chromosome exhibits a specific orientation in the cell, with the replication origin (ori) residing at the pole of the cell bearing a stalk. Upon initiation of replication, the duplicated centromere-like region parS and ori move rapidly to the opposite pole where parS is captured by a microdomain hosting a unique set of proteins that contribute to the identity of progeny cells. Many questions remain as to how this organization is maintained. In this study, we constructed strains of Caulobacter in which ori and the parS centromere can be induced to move to the opposite cell pole in the absence of chromosome replication, allowing us to ask whether once these chromosomal foci were positioned at the wrong pole, replication initiation and chromosome segregation can proceed in the opposite orientation. Our data reveal that DnaA can initiate replication and ParA can orchestrate segregation from either cell pole. The cell reconstructs the organization of its ParA gradient in the opposite orientation to segregate one replicated centromere from the new pole toward the stalked pole (i.e., opposite direction), while displaying no detectable viability defects. Thus, the unique polar microdomains exhibit remarkable flexibility in serving as a platform for directional chromosome segregation along the long axis of the cell.IMPORTANCE Bacteria can accomplish surprising levels of organization in the absence of membrane organelles by constructing subcellular asymmetric protein gradients. These gradients are composed of regulators that can either trigger or inhibit cell cycle events from distinct cell poles. In Caulobacter crescentus, the onset of chromosome replication and segregation from the stalked pole are regulated by asymmetric protein gradients. We show that the activators of chromosome replication and segregation are not restricted to the stalked pole and that their organization and directionality can be flipped in orientation. Our results also indicate that the subcellular location of key chromosomal loci play important roles in the establishment of the asymmetric organization of cell cycle regulators.

Keywords: Caulobacter crescentus; DnaA; ParA; centromere; chromosome replication; chromosome segregation.


Figures

FIG 1
FIG 1
Depiction of cell cycle-dependent dynamics of Caulobacter crescentus. Localization of two chromosomal foci (origin of replication [ori] and centromere [parS]) and two proteins involved in chromosome segregation (ParA and PopZ) over the course of a normal cell cycle. Nondividing cells have ori (cyan) and parS (green) localized near the stalked pole. PopZ anchors the centromere region parS and the parS-binding protein ParB complex at the stalked pole. Once replication initiates, two foci of ori and two foci of parS are observed. Upon the onset of chromosome replication and segregation, a second PopZ foci appears at the new pole. The new duplicated ori and parS are the first regions to move in a ParA-dependent manner to the new pole.
FIG 2
FIG 2
Translocation of ori in the absence of chromosome replication. (A) Time lapse of indicator strain [PM500; parS(pMT1) vanA::dnaA ΔdnaA xylX::cfp-parB(pMT1)] with fluorescent tag near ori (∼1 kb) with dnaA expression regulated by the vanillate promoter. Cells grown in M2G with vanillate were supplemented with xylose (0.3%) for 1 h and synchronized. Swarmer cells were spotted on 1% agarose M2G pads in the presence of vanillate (250 μM) (top row) or absence of vanillate (bottom row). Cells were imaged with phase-contrast and CFP-mediated fluorescence microscopy every 30 min. The time in minutes is shown above the images. The white arrow indicates the location of the stalk. Bars = 1 μm. (B) Percentage of cells with translocated ori to the middle or new pole over a 3-h span of DnaA depletion. Values are means plus standard deviation (SD) (error bars) percentages from three independent experiments. The average number of cells per replicate was 250.
FIG 3
FIG 3
The onset of chromosome replication is not limited to the stalked pole. (A) Cells with fluorescent tag near ori [PM500; parS(pMT1) near ori, vanA::dnaA, DdnaA, pxylX::cfp-parB(pMT1)] were grown in M2G with vanillate and supplemented with xylose (0.3%) for 1 h prior to synchronization. DnaA was depleted by growing the cells in liquid M2G medium without vanillate. (Top) At 3 h of DnaA depletion, cells displayed unreplicated ori foci translocated to the opposite pole, middle, or at the stalked pole. After the depletion period, DnaA expression was induced by supplementation of vanillate (250 μM). (Bottom) Within 30 min of DnaA repletion, cells were able to initiate chromosome replication, as evidenced by two ori (cyan) foci. Bars = 1 μm. (B) Onset of chromosome replication starting from the stalked pole, mid-cell, or new pole of PM500. The plot represents the mean ± SD percentage of cells with two ori foci from three independent fluorescence microscopy time-lapses. The average number of cells per replicate was 140. Analyses of two-way analysis of variance (ANOVA) between the frequencies of replication at the stalk pole versus new pole are statistically different at the 30-min and 45-min time points (P < 0.001; P < 0.05).
FIG 4
FIG 4
Translocated centromeres effectively segregate in the opposite direction. Cells imaged were synchronized prior to DnaA depletion in M2G medium (2 ml, OD600 of ∼0.1) for 3 h, and vanillate (250 μM) was added (time zero) to induce the expression of DnaA. Cells (2 μl) were spotted on 1% agarose pads supplemented with vanillate (250 μM). (A) Time-lapse microscopy of centromere segregation (green foci represent CFP-ParB/parS) starting from the stalked pole, mid-cell, or new pole of PM109 (parB::cfp-parB, dnaA::W, vanA::dnaA). t is DnaA repletion time (in minutes). Bars = 1 μm. (B) Centromere segregation. Segregation of centromeres of PM109 was quantified from three independent fluorescence microscopy time-lapse experiments. The average number of cells per replicate was 170. The plot also includes comparison of centromere segregation under wild-type conditions (dashed line). The mean ± SD percentages of cells with centromere segregation to the cell poles based on initial localization of CFP-ParB/parS are shown. Statistical analyses of two-way ANOVA between the frequencies of segregation at mid-cell and new pole are significantly different at the 45-min and 60-min time points (P < 0.01) and the frequencies of segregation at/near stalked pole and mid-cell at 45 min (P < 0.05).
FIG 5
FIG 5
Centromere segregation in the opposite direction requires active ParA. Cells with background parB::cfp-parB, dnaA::Ω, vanA::dnaA with either wild-type ParA (ParAWT) (PM109) or ParAD44A (PM121) were grown in the absence of vanillate to allow for centromere translocation. After 3 h of DnaA depletion, cultures were supplemented with vanillate (250 μM) to express DnaA and with xylose (0.3%) to induce the expression of ParAD44A variant protein. Cells were imaged by spotting 2 μl of cells on 1% agarose pads. (A) Phase-contrast fluorescence micrographs of PM109 expressing ParAWT (average cells per replicate = 250) and PM121 expressing ATP hydrolysis variant ParAD44A (average cells per replicate = 225). Bars = 1 μm. (b) Frequencies of centromere segregation were quantified based on localization of CFP-ParB (green foci). The data represent analyses of three independent experiments. Bar graph illustrates the mean ± SD values. Statistical analysis: two-way ANOVA, ***, P < 0.001.
FIG 6
FIG 6
Localization of ParA depends on the subcellular localization of parS-ParB. Translocation of centromere to the new pole in DnaA-depleted cells results in flipped ParA-mCherry gradient (red). Green foci represent parS-CFP-ParB (centromeres) localized at the stalked pole, mid-cell, or at the new pole. White arrows indicate locations of the stalks. PM503 cells (parB::cfp-parB, dnaA::Ω, vanA::dnaA xylX::parA-mCherry) were synchronized and depleted of DnaA for 3 h. The culture was also supplemented with xylose (0.1%) during the time of DnaA depletion. After DnaA depletion, 2 μl of cells was mounted on 1% agarose pad and imaged using phase-contrast fluorescence microscopy. Micrographs were spliced to show cells with a single parS-CFP-ParB focus grouped based on the subcellular location of that focus (stalked pole, mid-cell, new pole). Bars = 1 μm.
FIG 7
FIG 7
Localization of PopZ based on the subcellular organization of parS-ParB. (A and B) Localization of PopZ (red) in DnaA-depleted cells (A) and in 1 h DnaA replete cells (B). Green foci represent CFP-ParB (centromeres). Bars = 1 μm. The graphs display quantification of localization of PopZ in cells depleted of DnaA (A) and DnaA replete cells (B). PM247 (parB::cfp-parB, dnaA::Ω, vanA::dnaA xylX::mCherry-popZ) were grown in the absence of vanillate (DnaA depletion) for 3 h and then supplemented with vanillate (DnaA repletion) for 1 h. Cultures were supplemented with xylose (0.1%) to induce the expression of mCherry-PopZ for 1 h prior to isolation of swarmer cells. Phase-contrast fluorescent micrographs were obtained just before and after 1 h of the addition of vanillate. The data represent three independent experiments. The average number of cells per replicate was 200. The bar graphs show the mean plus SD values.
FIG 8
FIG 8
Depletion of DnaA for 3 h does not alter the viability of Caulobacter. (A and B) CFU assays of PM500 cells [parS(pMT1) vanA::dnaA ΔdnaA xylX::cfp-parB(pMT1)] (A) and PM109 cells (ΔvanA parB::cfp-parB dnaA::Ω vanA::dnaA) (B). The cultures (3 ml) grown to an OD600 of ∼0.3 were washed three times with 1× M2 salts as described in Materials and Methods, and the OD600 was set at ∼ 0.2 in M2G medium (2 ml). DnaA was depleted for 1, 2, and 3 h in separate cultures at 28°C, and the CFU assay was performed. Control sample (c) were not depleted of DnaA and were incubated with vanillate (250 μM) for 3 h. PYE plates supplemented with vanillate (250 μM) were incubated at 28°C for 2 days prior to obtaining the images. The data shown are representative of three independent replicates.

Similar articles

Cited by

References

    1. Hwang DS, Kornberg A. 1992. Opening of the replication origin of Escherichia coli by DnaA protein with protein HU or IHF. J Biol Chem 267:23083–23086. - PubMed
    1. Boye E, Lobner-Olesen A, Skarstad K. 2000. Limiting DNA replication to once and only once. EMBO Rep 1:479–483. doi:10.1093/embo-reports/kvd116. - DOI - PMC - PubMed
    1. Sekimizu K, Bramhill D, Kornberg A. 1988. Sequential early stages in the in vitro initiation of replication at the origin of the Escherichia coli chromosome. J Biol Chem 263:7124–7130. - PubMed
    1. Katayama T, Ozaki S, Keyamura K, Fujimitsu K. 2010. Regulation of the replication cycle: conserved and diverse regulatory systems for DnaA and oriC. Nat Rev Microbiol 8:163–170. doi:10.1038/nrmicro2314. - DOI - PubMed
    1. Erzberger JP, Mott ML, Berger JM. 2006. Structural basis for ATP-dependent DnaA assembly and replication-origin remodeling. Nat Struct Mol Biol 13:676–683. doi:10.1038/nsmb1115. - DOI - PubMed

Publication types

MeSH terms

Substances

LinkOut - more resources