. 2019 Jul 30;10(4):e01581-19.
doi: 10.1128/mBio.01581-19.

Cellular Dynamics and Genomic Identity of Centromeres in Cereal Blast Fungus

Affiliations

Cellular Dynamics and Genomic Identity of Centromeres in Cereal Blast Fungus

Vikas Yadav et al. mBio. .

Abstract

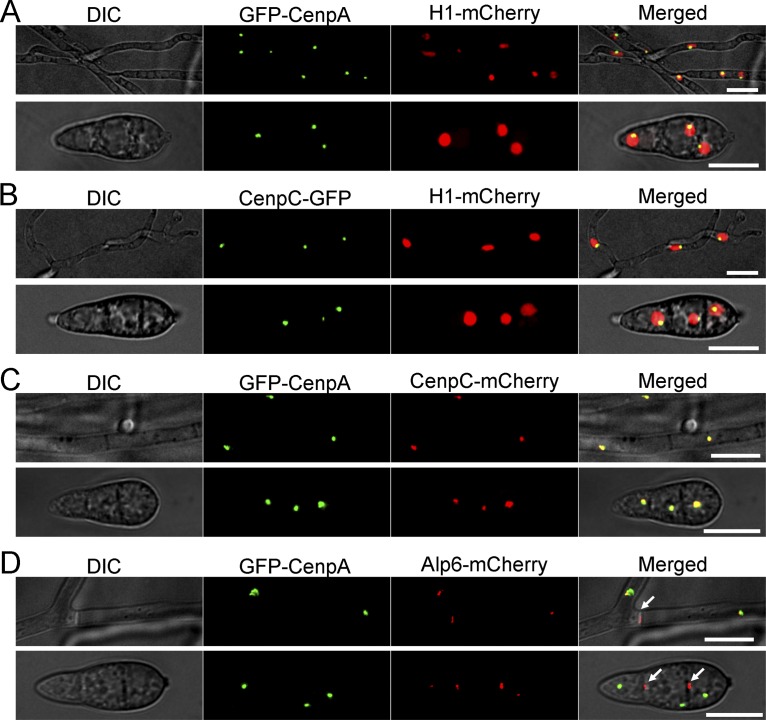
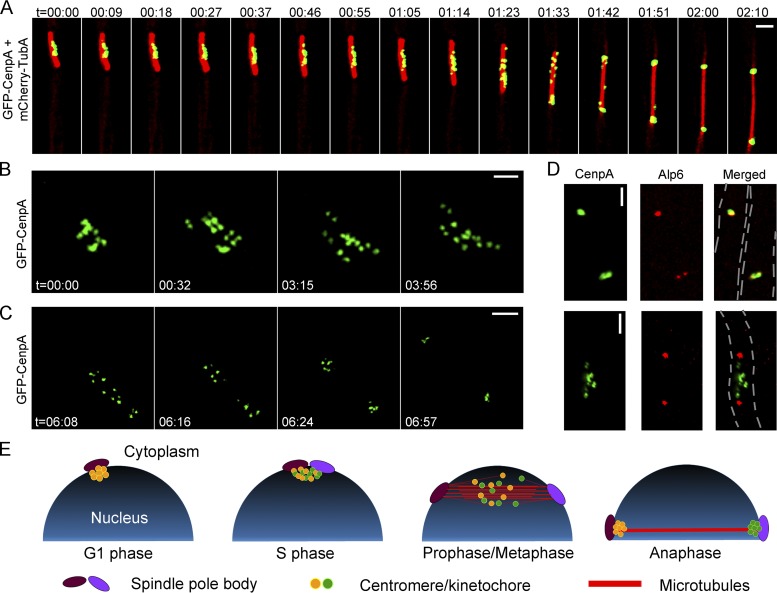
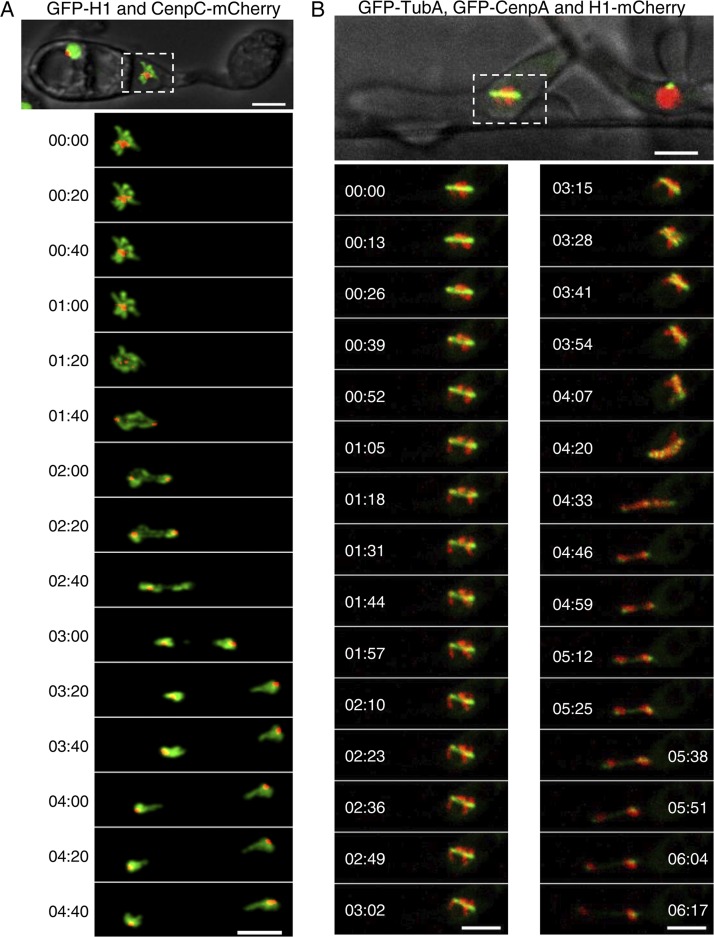
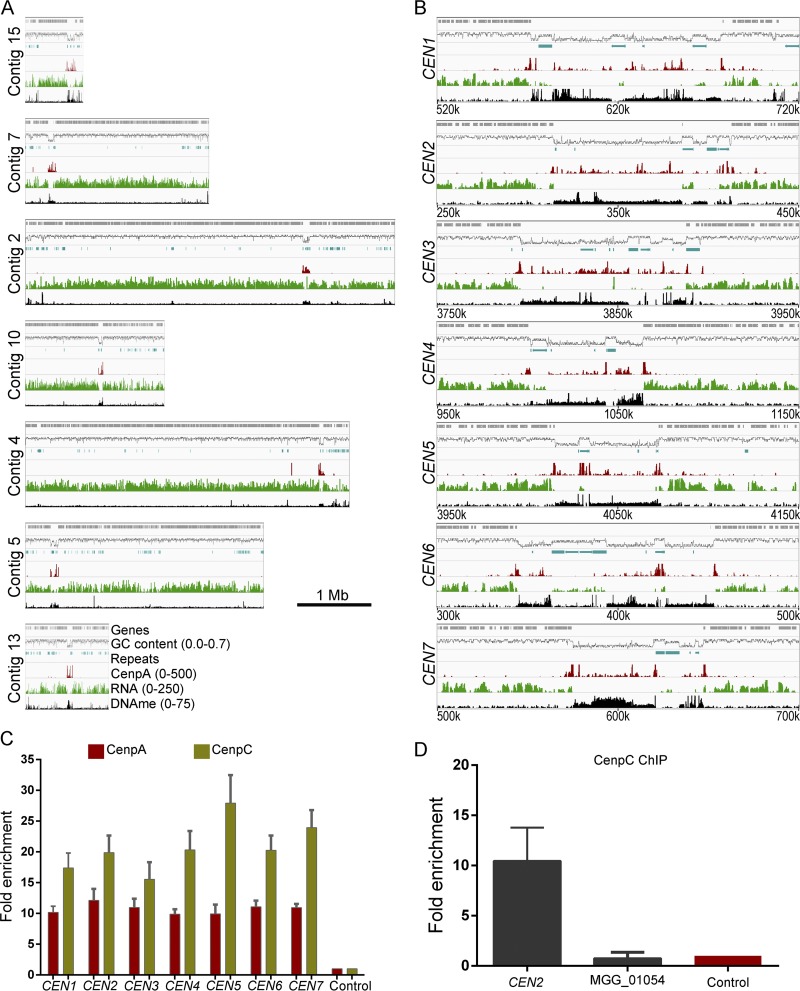
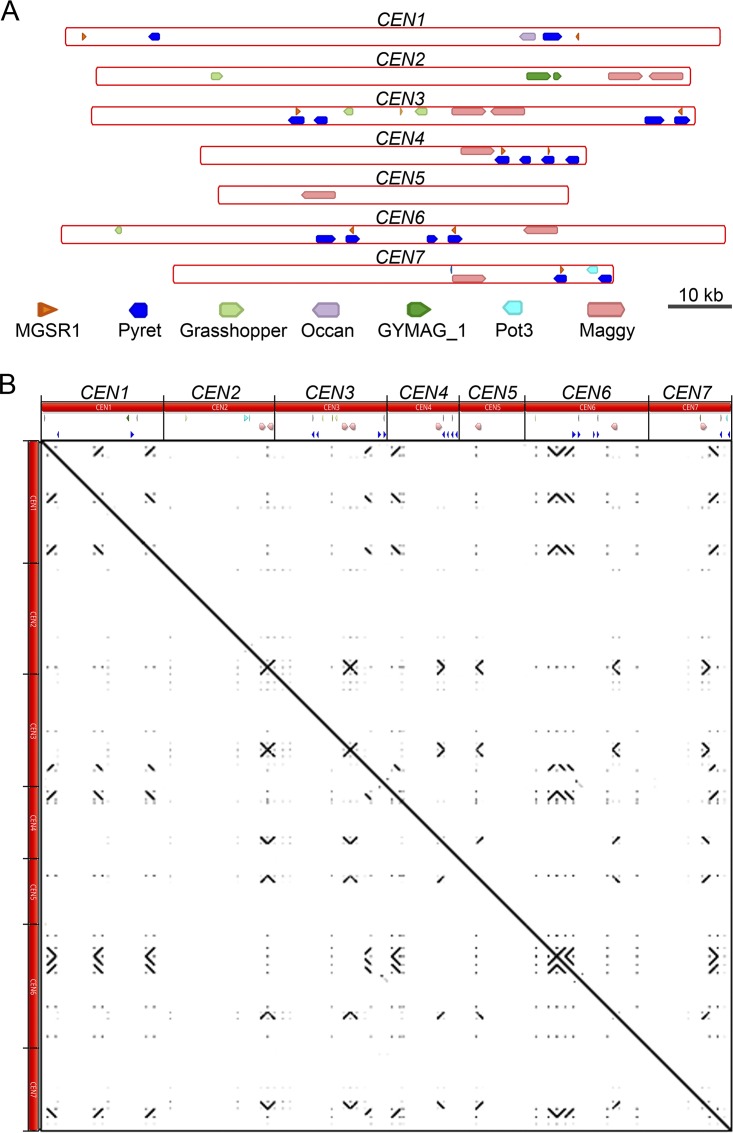
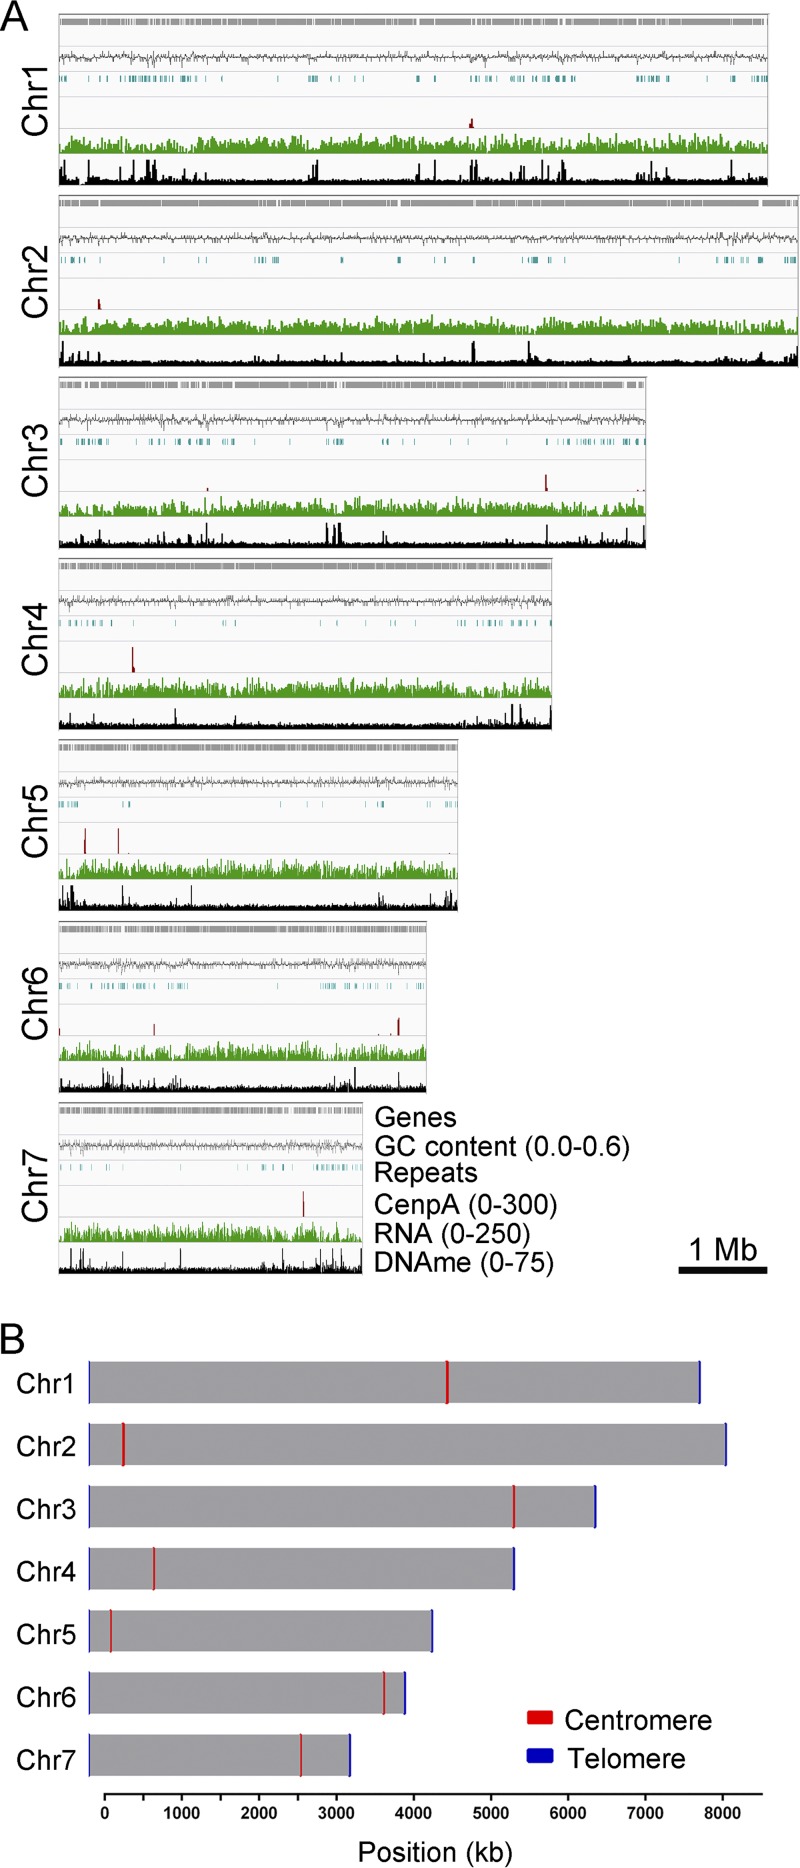
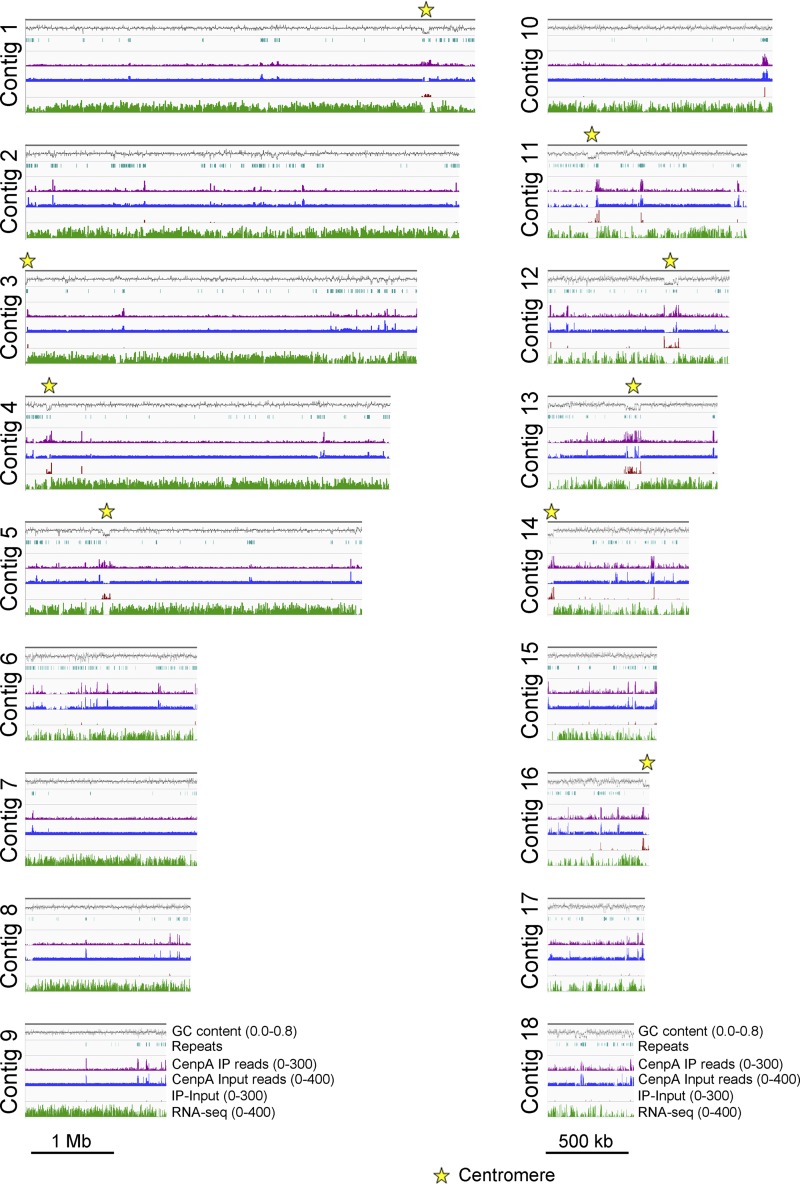
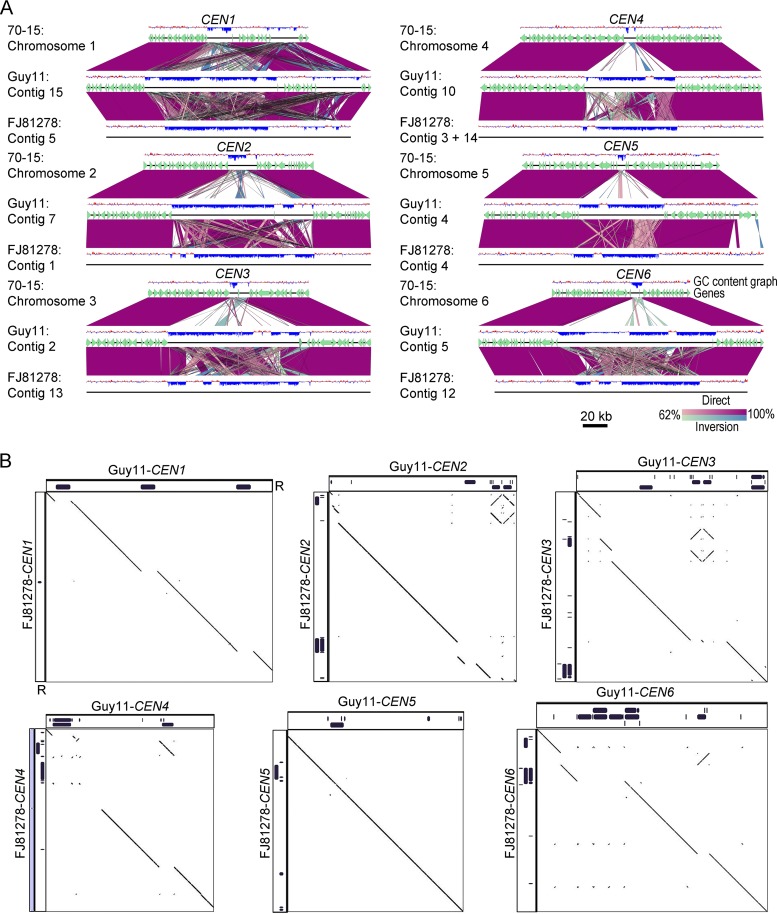
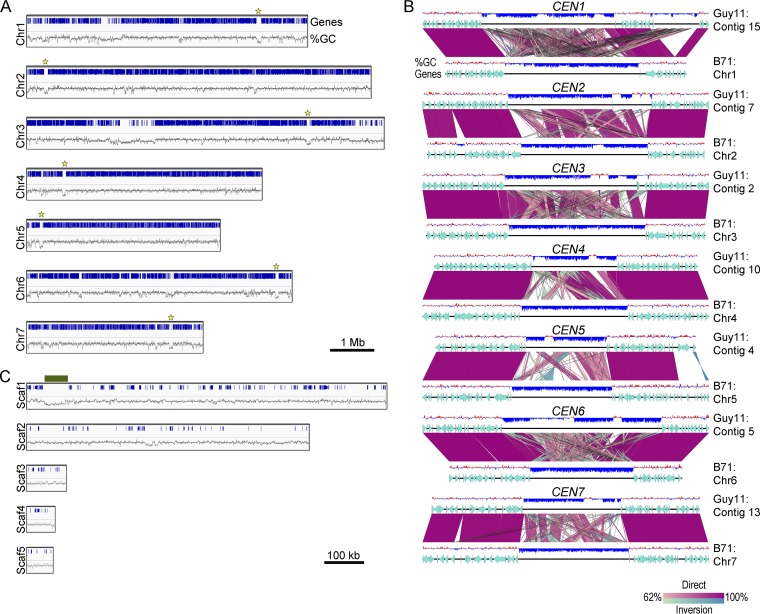
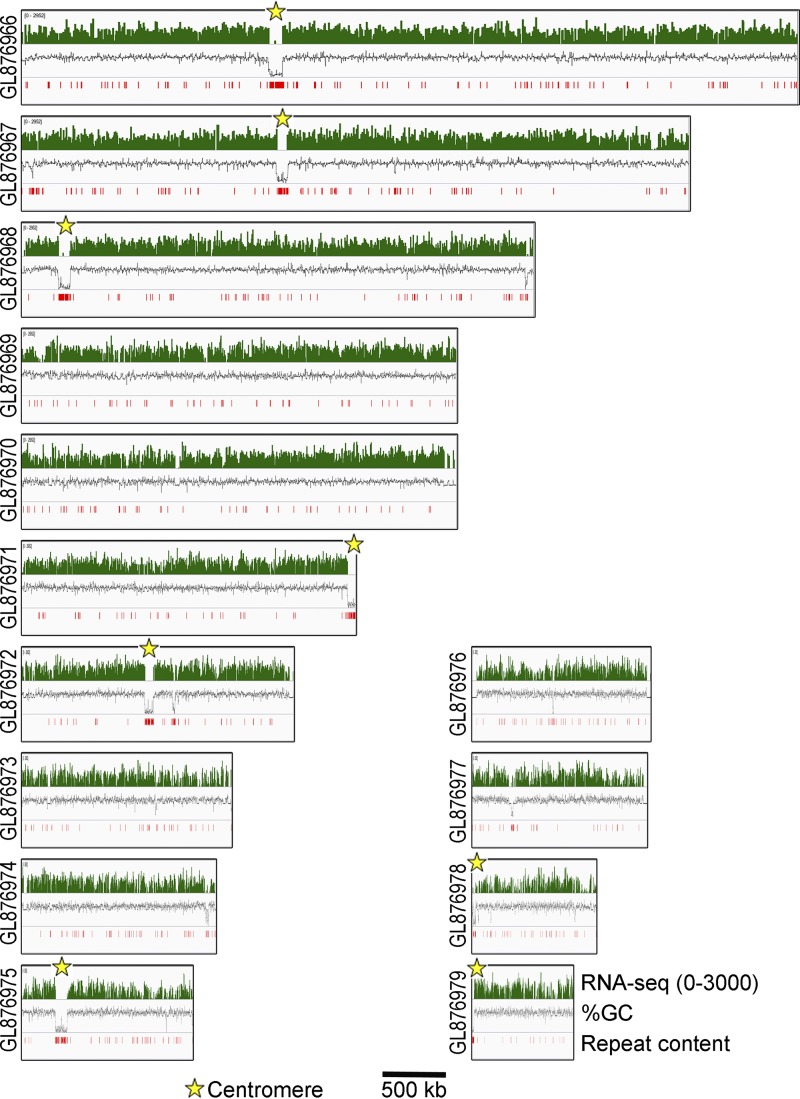
Precise kinetochore-microtubule interactions ensure faithful chromosome segregation in eukaryotes. Centromeres, identified as scaffolding sites for kinetochore assembly, are among the most rapidly evolving chromosomal loci in terms of the DNA sequence and length and organization of intrinsic elements. Neither the centromere structure nor the kinetochore dynamics is well studied in plant-pathogenic fungi. Here, we sought to understand the process of chromosome segregation in the rice blast fungus Magnaporthe oryzae High-resolution imaging of green fluorescent protein (GFP)-tagged inner kinetochore proteins CenpA and CenpC revealed unusual albeit transient declustering of centromeres just before anaphase separation of chromosomes in M. oryzae Strikingly, the declustered centromeres positioned randomly at the spindle midzone without an apparent metaphase plate per se Using CenpA chromatin immunoprecipitation followed by deep sequencing, all seven centromeres in M. oryzae were found to be regional, spanning 57-kb to 109-kb transcriptionally poor regions. Highly AT-rich and heavily methylated DNA sequences were the only common defining features of all the centromeres in rice blast. Lack of centromere-specific DNA sequence motifs or repetitive elements suggests an epigenetic specification of centromere function in M. oryzae PacBio genome assemblies and synteny analyses facilitated comparison of the centromeric/pericentromeric regions in distinct isolates of rice blast and wheat blast and in Magnaporthiopsis poae Overall, this study revealed unusual centromere dynamics and precisely identified the centromere loci in the top model fungal pathogens that belong to Magnaporthales and cause severe losses in the global production of food crops and turf grasses.IMPORTANCEMagnaporthe oryzae is an important fungal pathogen that causes a loss of 10% to 30% of the annual rice crop due to the devastating blast disease. In most organisms, kinetochores are clustered together or arranged at the metaphase plate to facilitate synchronized anaphase separation of sister chromatids in mitosis. In this study, we showed that the initially clustered kinetochores separate and position randomly prior to anaphase in M. oryzae Centromeres in M. oryzae occupy large genomic regions and form on AT-rich DNA without any common sequence motifs. Overall, this study identified atypical kinetochore dynamics and mapped functional centromeres in M. oryzae to define the roles of centromeric and pericentric boundaries in kinetochore assembly on epigenetically specified centromere loci. This study should pave the way for further understanding of the contribution of heterochromatin in genome stability and virulence of the blast fungus and its related species of high economic importance.

Keywords: CenpA; centromeres; chromosome structure; kinetochore dynamics; rice blast; wheat blast.


Figures

FIG 1
FIG 1
Localization patterns of CenpA and CenpC reveal that kinetochores are closely associated with each other in M. oryzae. (A) M. oryzae strain MGYF03 exhibited a single dot-like GFP-CenpA signal localized at the periphery of each nucleus marked by mCherry-histone H1 in both mycelia (upper panel) and conidia (lower panel). (B) Similarly, another inner kinetochore protein, CenpC-GFP in strain MGYF04, was found to be localized at the periphery of the mCherry-histone H1-marked nucleus in both mycelia (upper panel) and conidia (lower panel). (C) Colocalization of GFP-CenpA and CenpC-mCherry revealed complete overlapping signals in both mycelia and conidia in the MGYF05 strain. (D) In strain MGYF08, the clusters of GFP-CenpA were found to be closely associated with the spindle pole body (SPB) component Alp6-mCherry. In addition to SPBs, the Alp6 signals were also observed at the septa (white arrows). The fluorescence images shown here are maximum projections from Z stacks consisting of 0.5-μm-spaced planes. Bar, 10 μm. DIC, differential interference contrast.
FIG 2
FIG 2
Kinetochores decluster momentarily but arrange randomly on the spindle axis before sister kinetochore separation during anaphase in M. oryzae. (A) Time-lapse imaging of strain MGYF07 cells exhibited that the GFP-CenpA signals separated from each other and moved along the mitotic spindle (mCherry-TubA) (see also Movie S1 at https://figshare.com/articles/MoCEN_movies/8282066). The images shown are maximum projections of 0.3-μm-spaced Z stacks. t = minutes:seconds. Bar, 2 μm. (B) High-resolution time-lapse images showing the declustering of kinetochores (GFP-CenpA) during the process of mitosis in strain MGYF01 (see also Movie S2 at https://figshare.com/articles/MoCEN_movies/8282066). The images were acquired with Z projections of 0.17-μm step size. t = minutes:seconds. Bar, 1 μm. (C) High-resolution time-lapse images of MGYF01 cells showing the segregation dynamics of sister kinetochores in daughter cells during the metaphase to anaphase transition and the final reclustering of kinetochores in postanaphase cells (see also Movie S3 at https://figshare.com/articles/MoCEN_movies/8282066). t = minutes:seconds. Bar, 2 μm. (D) Spatial organization of kinetochores (GFP-CenpA) and SPBs (Alp6-mCherry) in strain MGYF08 during the premitotic stage (upper panel) and early mitosis (lower panel). Bar, 2 μm. (E) A schematic depiction of centromere dynamics at specific stages of the cell cycle in M. oryzae. For simplification, chromosomes and astral microtubules are omitted in the schematic.
FIG 3
FIG 3
Subcellular localization and dynamics of CenpA and CenpC during pathogenic development in M. oryzae. (A) Time-lapse images showing a mitosis event during appressorium formation in CenpC-mCherry and GFP-histone H1-tagged strain B157 of M. oryzae. Conidia were incubated on the hydrophobic coverslip to allow appressorium development, and the mitotic division was recorded after 4 h postinfection (hpi), with images captured at 20-s intervals (see also Movie S5 at https://figshare.com/articles/MoCEN_movies/8282066). (B) Time-lapse images showing the localization of centromeres (GFP-CenpA), microtubules (GFP-TubA), and the nucleus (histone H1-mCherry) during mitosis in the invasive hyphae in M. oryzae. M. oryzae conidia were incubated on rice sheath, and the images were acquired at 44 hpi at 13-s intervals (see also Movie S6 at https://figshare.com/articles/MoCEN_movies/8282066). The epifluorescent confocal images shown here are maximum projections from Z-stacks consisting of 0.5-μm-spaced planes. Bars, 5 μm.
FIG 4
FIG 4
Identification of centromeres in M. oryzae. (A) Reads obtained from the GFP-CenpA ChIP-seq analysis in the cross-linked mycelia of strain MGYF01 identified one distinct enriched region on each of the seven contigs after alignment with the Guy11 genome assembly. CenpA-bound regions overlap AT-rich, poorly transcribed regions on each contig and harbor 5mC DNA methylation (see the text for details). The numbers in parentheses that appear after the indicated parameters represent the minimum and maximum values along the y axis. (B) Zoomed view of centromere regions in Guy11 depicting the presence of repeat elements, CenpA enrichment, poly(A) transcription, and DNA methylation (5mC) status in these regions. A 200-kb region spanning the centromere is shown for each chromosome. The only common defining sequence feature of centromeres is AT richness. (C) CenpA and CenpC ChIP-qPCR analysis of cross-linked mycelia of strains MGYF01 and MGYF02, respectively, confirmed the centromere identity of each of the seven chromosomes of Guy11. Each bar represents the extent of enrichment obtained by one primer pair amplifying a unique sequence of each CenpA-bound region identified from the ChIP-seq analysis, and fold enrichment values were normalized using a noncentromere region (ORF MGG_01917) as a control. Error bars represent standard deviations of results from three independent experiments. (D) ChIP-qPCR results showed that gene MGG_01045 is not enriched with CenpC as observed in CenpA ChIP-seq analysis.
FIG 5
FIG 5
Centromere structure in M. oryzae (Guy11). (A) The well-characterized Magnaporthe-specific repeats were mapped to the centromere regions of the Guy11 genome to define the repeat content and organization of these regions. (B) Self-dot-plot analysis was performed for all the seven centromere regions, and the results are plotted. Each centromere sequence was compared with all centromeres, and the boundary of each centromere is marked to scale. Both the x axis and the y axis represent the lengths of all centromeres combined.
FIG 6
FIG 6
Identification of centromeres in M. oryzae strain 70-15 (MG8 assembly; Broad Institute). (A) Mapping of GFP-CenpA ChIP-seq reads to the reference MG8 genome assembly revealed the location of centromeres in reference strain 70-15 of M. oryzae. Repeats, RNA-seq reads, and bisulfite sequencing reads were also mapped and are represented here for the comparative analyses. (B) Map showing seven chromosomes of M. oryzae with centromere locations marked on each chromosome. The chromosome length along with centromere length obtained from the ChIP-seq analysis is plotted to the scale on the available chromosome-wide strain 70-15 genome assembly. However, telomeres are shown as 10-kb regions on either side for each chromosome for visualization purpose.
FIG 7
FIG 7
CenpA ChIP-seq read mapping identified centromere locations in M. oryzae isolate FJ81278. Graphs show the enrichment of CenpA in FJ81278 genome assembly. The enriched regions overlapped AT-rich regions. The locations of CenpA enriched centromeres are marked. The graphs are plotted with two different scales for the purpose of visualization.
FIG 8
FIG 8
Centromere DNA sequences in M. oryzae isolates are similar but differ in repeat content. (A) Synteny analysis across centromeres and their flanking regions revealed the conservation of centromere flanking regions, indicating that the centromere location is maintained in different isolates of M. oryzae. The gene annotations for the FJ81278 assembly are not available and hence are not represented in the maps. This analysis also revealed that centromere sequences are largely excluded from the current MG8 genome assembly compared to that of Guy11 or FJ81278. A 200-kb region (corresponding to the Guy11 genome assembly) for each centromere is represented in the maps. A few centromere flanking genes were also found missing from Chr7 in the MG8 assembly. BLAST analysis revealed the presence of these genes in the unassembled supercontig 8.8 of the genome assembly. (B) Dot-plot analysis of respective centromeres revealed that centromere sequences share considerable similarities in Guy11 and FJ81278. As shown in the graphs, the breaks observed in the dot-plot analysis overlapped the presence/absence of repeat elements. The complete sequence of CEN4 in FJ81278 was generated by fusing the two fragments, i.e., one each from contig 3 and 14. The individual fragments are shown using gray bars and are separated by a small thin black bar (equal to 100 bp). “R” denotes the repeat panels for both Guy11 and FJ81278.
FIG 9
FIG 9
Predicted centromeres in the wheat blast B71 genome. (A) Chromosome maps showing the location of centromeres in the genome of the B71 isolate of wheat blast. The AT-rich, gene-free centromere regions are marked by a yellow star in each chromosome. (B) Synteny analysis of centromeres and their flanking regions between the Guy11 and B71 genomes showed conservation of centromere locations therein. A 200-kb region is shown with respect to the Guy11 genome assembly. (C) Scaffolds (Scaf1 to Scaf5) representing the minichromosome in B71 were analyzed and are depicted with the corresponding genes and AT richness graphs. A long AT-rich region (marked with a dark green bar) in scaffold 1 (position 40795 to position 109519) was identified and represents the putative centromere in the minichromosome in wheat blast.
FIG 10
FIG 10
In silico centromere identification in Magnaporthiopsis poae. On the basis of the RNA-seq read, AT richness, and repeat content data, centromeres were identified (as marked) in the M. poae genome, and the graphs showing the same are plotted for the M. poae genome assembly. Only contigs longer than 500 kb are represented here.

Similar articles

Cited by

References

    1. Musacchio A, Desai A. 24 January 2017, posting date. A molecular view of kinetochore assembly and function. Biology (Basel) doi:10.3390/biology6010005. - DOI - PMC - PubMed
    1. Cheeseman IM. 2014. The kinetochore. Cold Spring Harb Perspect Biol 6:a015826. doi:10.1101/cshperspect.a015826. - DOI - PMC - PubMed
    1. Henikoff S, Ahmad K, Malik HS. 2001. The centromere paradox: stable inheritance with rapidly evolving DNA. Science 293:1098–1102. doi:10.1126/science.1062939. - DOI - PubMed
    1. Yadav V, Sreekumar L, Guin K, Sanyal K. 2018. Five pillars of centromeric chromatin in fungal pathogens. PLoS Pathog 14:e1007150. doi:10.1371/journal.ppat.1007150. - DOI - PMC - PubMed
    1. Roy B, Sanyal K. 2011. Diversity in requirement of genetic and epigenetic factors for centromere function in fungi. Eukaryot Cell 10:1384–1395. doi:10.1128/EC.05165-11. - DOI - PMC - PubMed

Publication types

MeSH terms