. 2019 Oct 2;39(40):7976-7991.
doi: 10.1523/JNEUROSCI.0674-19.2019. Epub 2019 Jul 30.

p110δ PI3-Kinase Inhibition Perturbs APP and TNFα Trafficking, Reduces Plaque Burden, Dampens Neuroinflammation, and Prevents Cognitive Decline in an Alzheimer's Disease Mouse Model

Affiliations

p110δ PI3-Kinase Inhibition Perturbs APP and TNFα Trafficking, Reduces Plaque Burden, Dampens Neuroinflammation, and Prevents Cognitive Decline in an Alzheimer's Disease Mouse Model

Ramón Martínez-Mármol et al. J Neurosci. .

Abstract

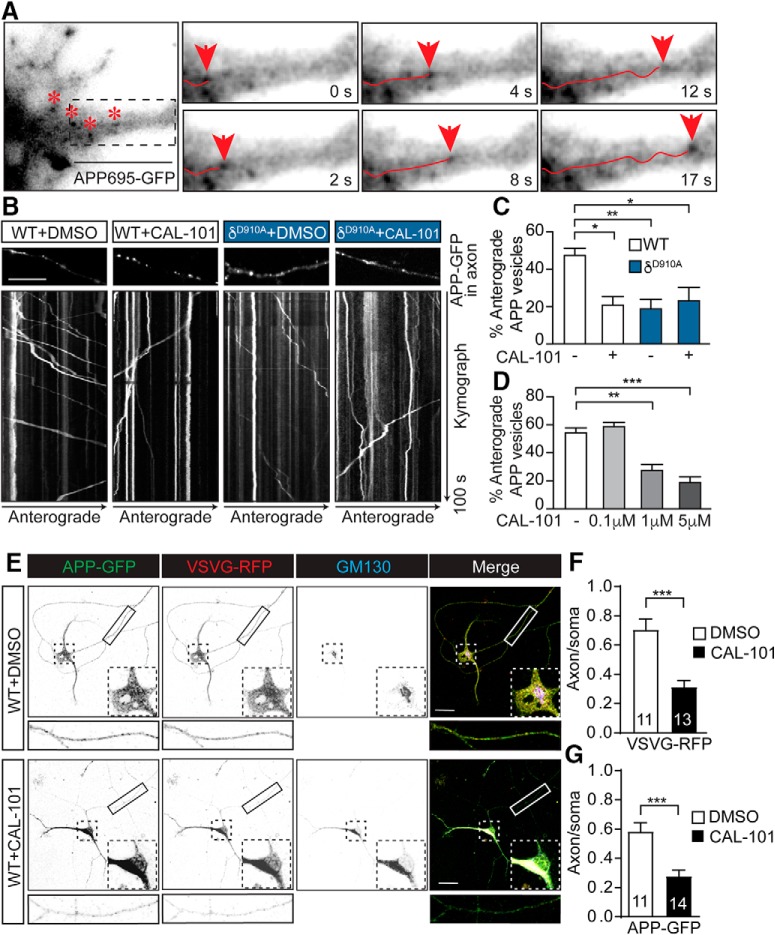
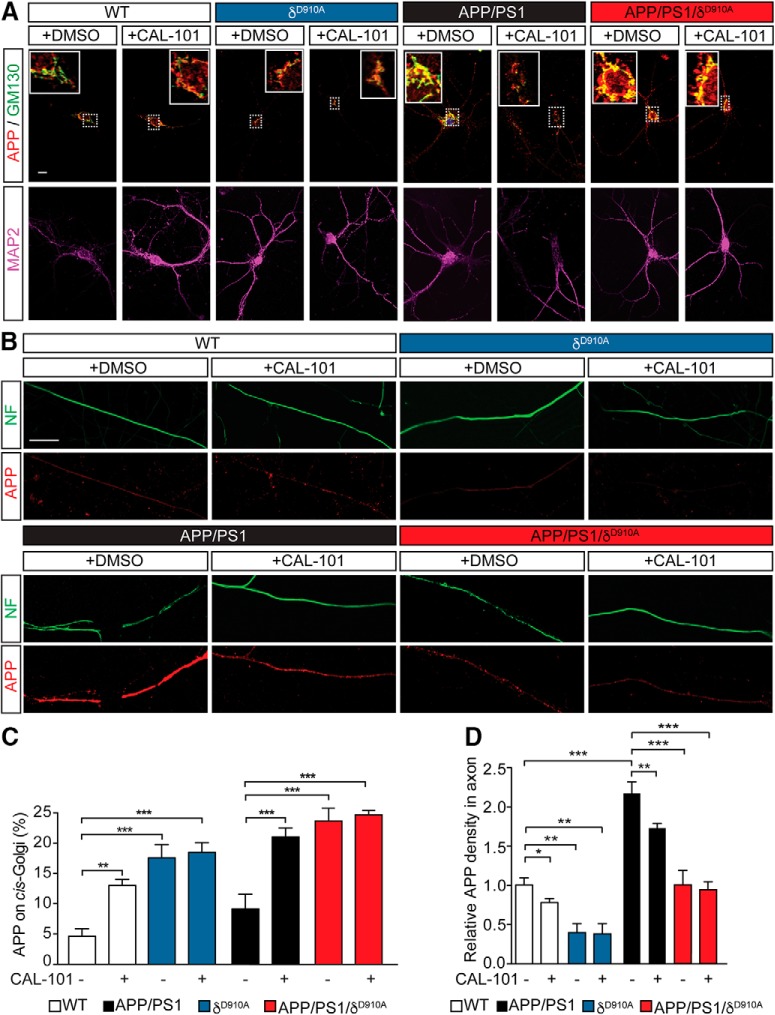
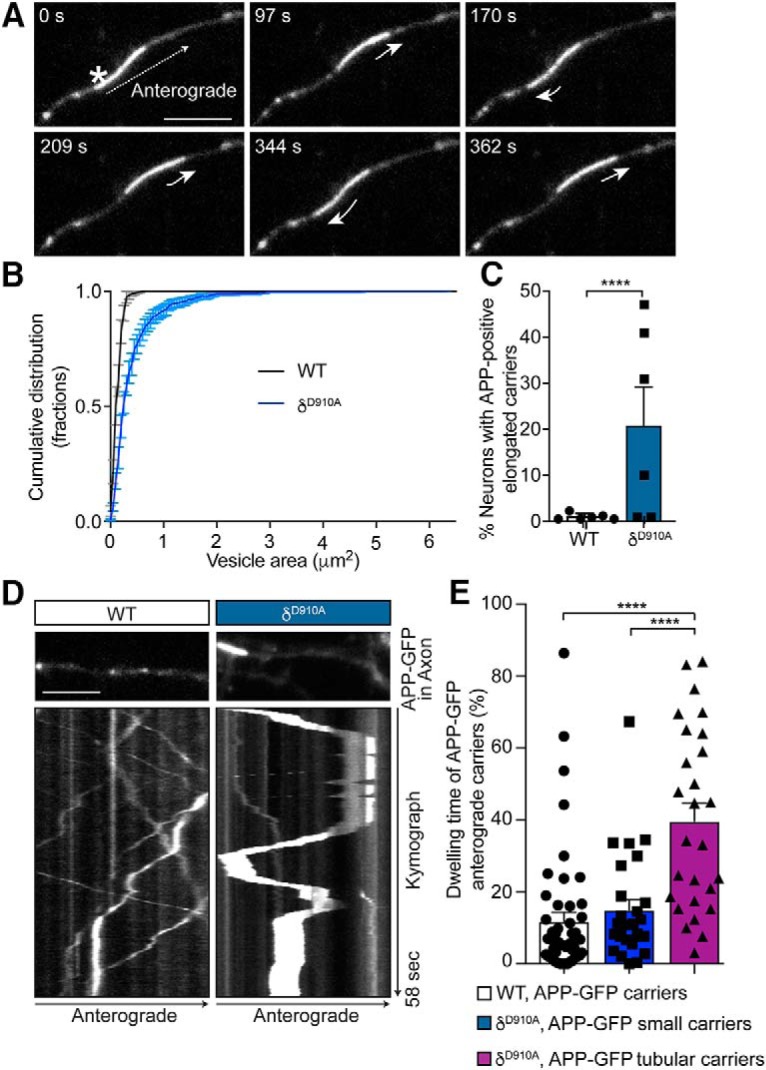
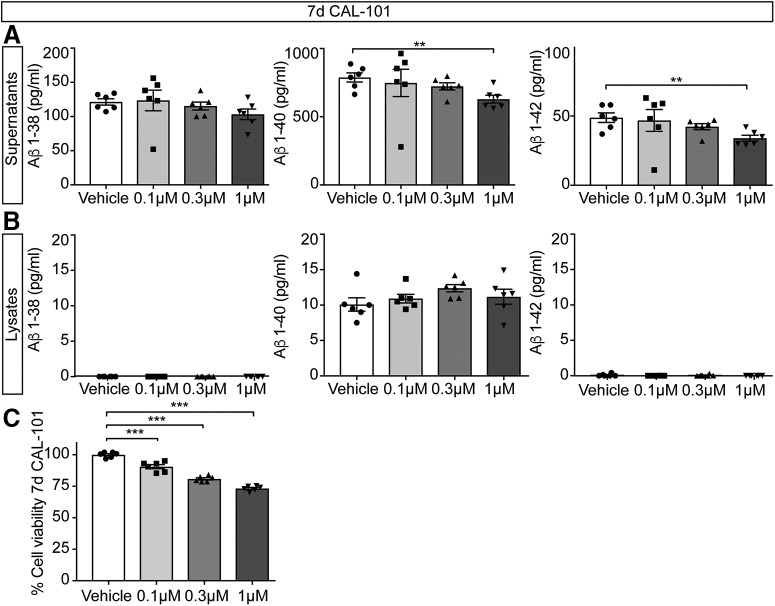
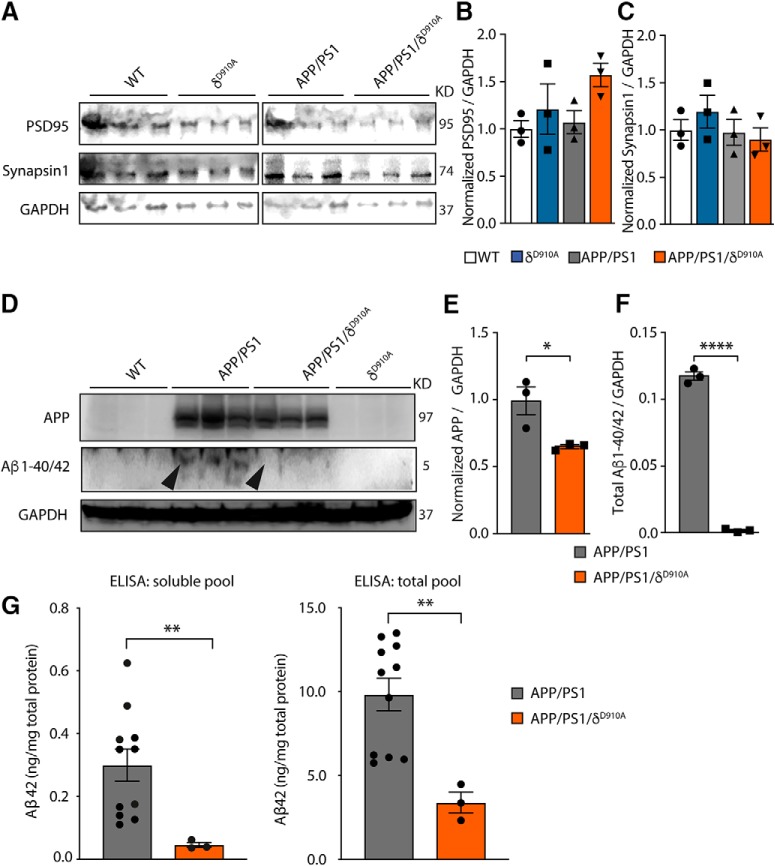
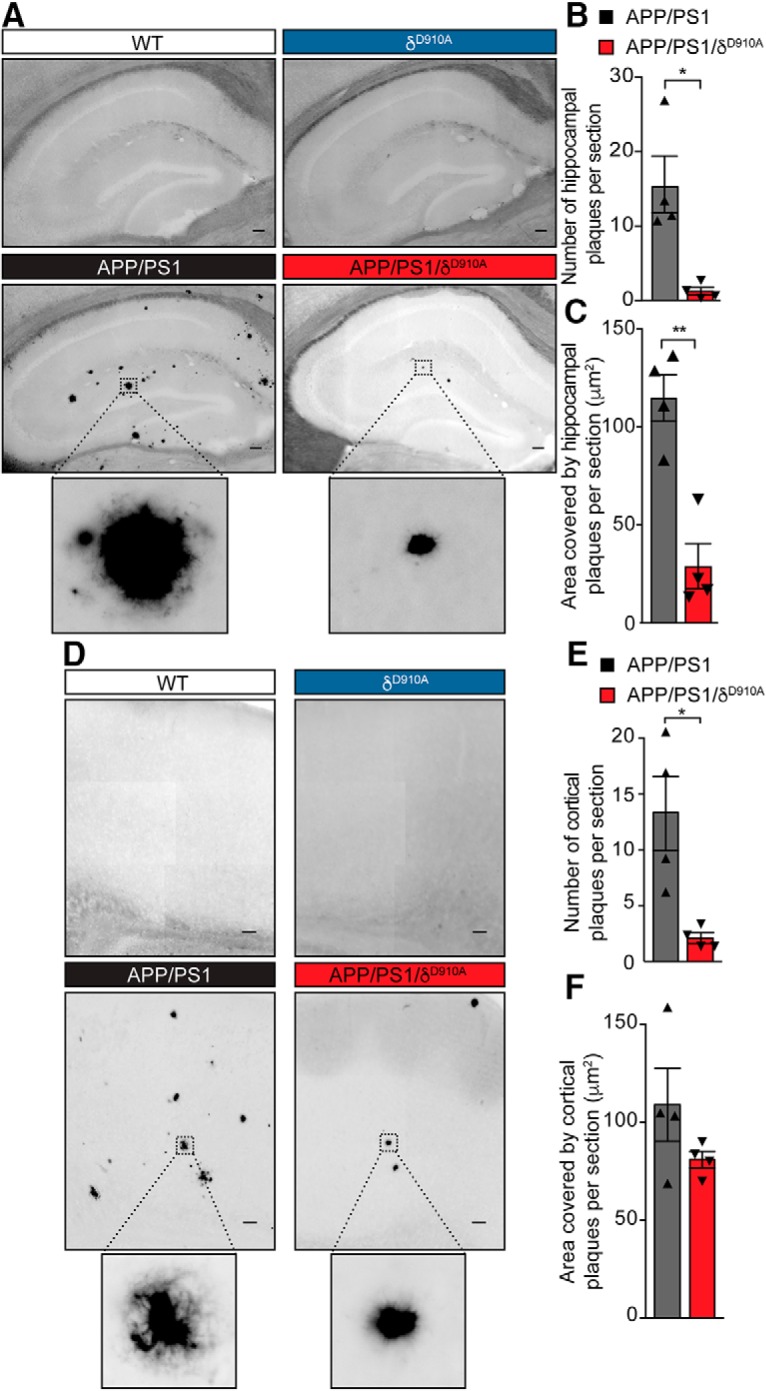
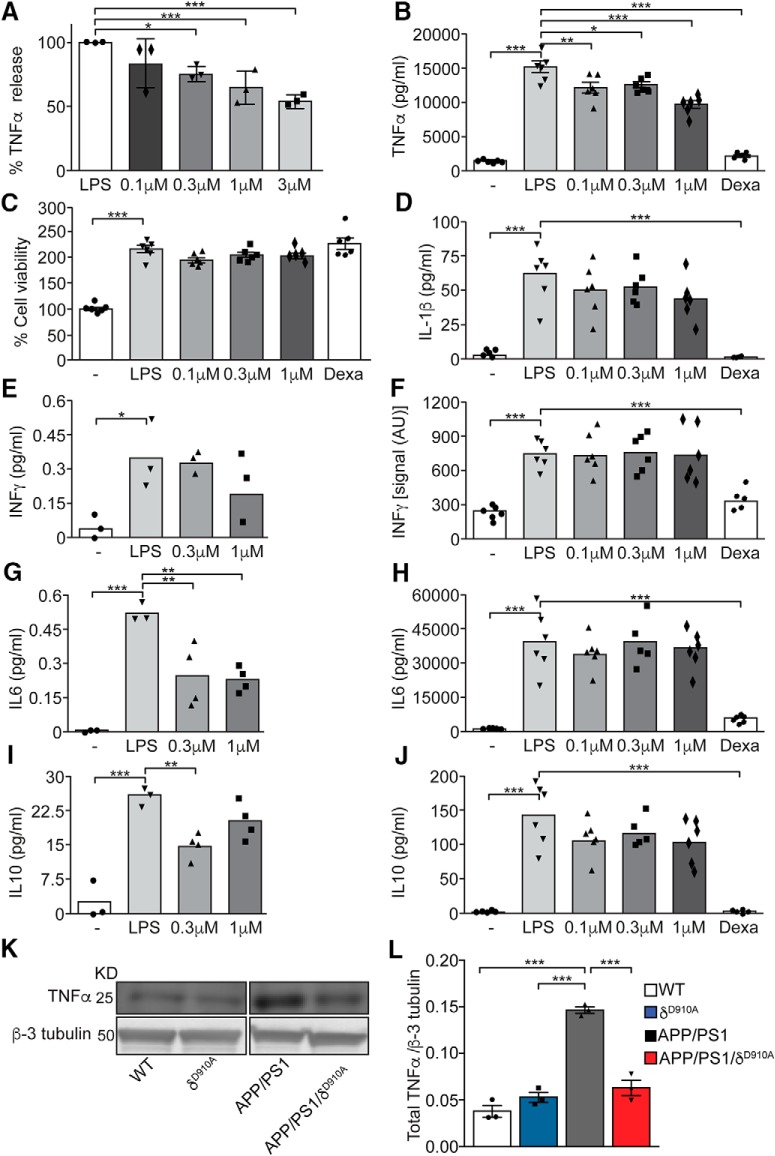
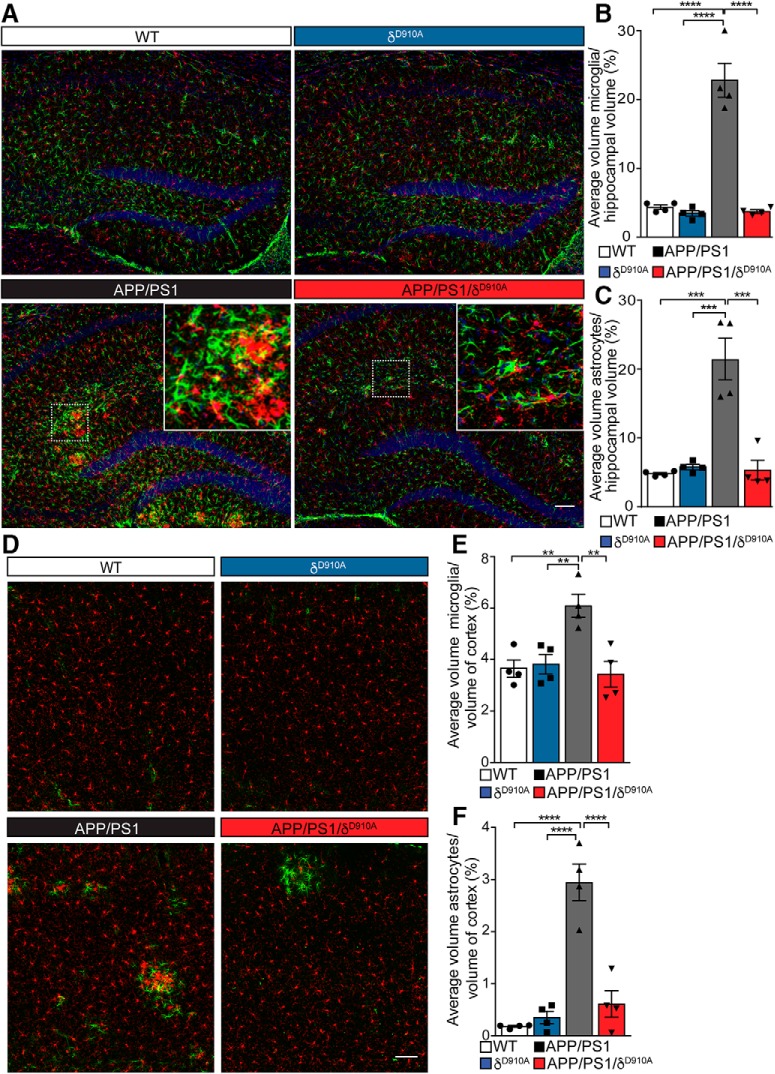
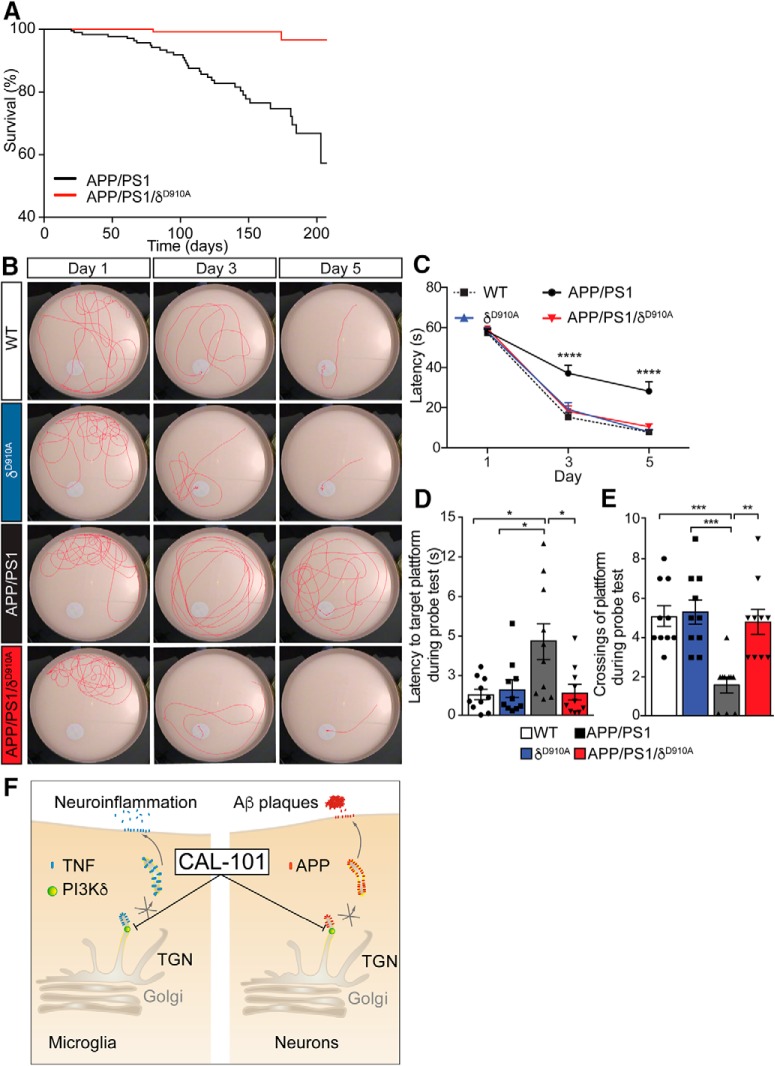
Alzheimer's disease (AD) is associated with the cleavage of the amyloid precursor protein (APP) to produce the toxic amyloid-β (Aβ) peptide. Accumulation of Aβ, together with the concomitant inflammatory response, ultimately leads to neuronal death and cognitive decline. Despite AD progression being underpinned by both neuronal and immunological components, therapeutic strategies based on dual targeting of these systems remains unexplored. Here, we report that inactivation of the p110δ isoform of phosphoinositide 3-kinase (PI3K) reduces anterograde axonal trafficking of APP in hippocampal neurons and dampens secretion of the inflammatory cytokine tumor necrosis factor-alpha by microglial cells in the familial AD APPswe/PS1ΔE9 (APP/PS1) mouse model. Moreover, APP/PS1 mice with kinase-inactive PI3Kδ (δD910A) had reduced Aβ peptides levels and plaques in the brain and an abrogated inflammatory response compared with APP/PS1 littermates. Mechanistic investigations reveal that PI3Kδ inhibition decreases the axonal transport of APP by eliciting the formation of highly elongated tubular-shaped APP-containing carriers, reducing the levels of secreted Aβ peptide. Importantly, APP/PS1/δD910A mice exhibited no spatial learning or memory deficits. Our data highlight inhibition of PI3Kδ as a new approach to protect against AD pathology due to its dual action of dampening microglial-dependent neuroinflammation and reducing plaque burden by inhibition of neuronal APP trafficking and processing.SIGNIFICANCE STATEMENT During Alzheimer's disease (AD), the accumulation of the toxic amyloid-β (Aβ) peptide in plaques is associated with a chronic excessive inflammatory response. Uncovering new drug targets that simultaneously reduce both Aβ plaque load and neuroinflammation holds therapeutic promise. Using a combination of genetic and pharmacological approaches, we found that the p110δ isoform of phosphoinositide 3-kinase (PI3K) is involved in anterograde trafficking of the amyloid precursor protein in neurons and in the secretion of tumor necrosis factor-alpha from microglial cells. Genetic inactivation of PI3Kδ reduces Aβ plaque deposition and abrogates the inflammatory response, resulting in a complete rescue of the life span and spatial memory performance. We conclude that inhibiting PI3Kδ represents a novel therapeutic approach to ameliorate AD pathology by dampening plaque accumulation and microglial-dependent neuroinflammation.

Keywords: Alzheimer's disease; TNF-alpha; amyloid precursor protein; axon trafficking; neuroinflammation; p110delta.


Figures

Figure 1.
Figure 1.
Axonal anterograde trafficking of APP in hippocampal neurons is reduced by pharmacological or genetic inhibition of PI3Kδ. A, Detail of a hippocampal neuron transfected with APP-GFP. Asterisks represent different APP-containing vesicles. The boxed area is magnified in the right panels. The panels represent images of a time series showing a vesicle containing APP-GFP (arrowhead) moving anterogradely along the axon. B, Representative kymographs of APP-GFP-containing vesicles moving along the axons of hippocampal neurons from mice of different genotypes and treated with control vehicle (DMSO) or CAL-101 (1 μm) for 2 h. Each analyzed region is shown just above the respective kymograph. C, Quantification of the percentage of anterograde axonally transported APP-positive vesicles in DMSO or CAL-101 (1 μm) treated neurons from WT or δD910A mice. D, Quantification of the percentage of anterograde axonally moving APP-positive vesicles in WT neurons treated with different concentrations of CAL-101. E, Representative images of triple fluorescence immunocytochemistry for APP-GFP (green), VSVG-RFP (red), and GM130 (blue) of WT hippocampal cultures of DIV10 neurons treated with control DMSO (top) or CAL-101 (1 μm) (bottom) for 2 h. F, Quantification of the alteration of neuronal trafficking of VSVG-RFP in neurons treated with DMSO or CAL-101 (1 μm). G, Quantification of the alteration of neuronal trafficking of APP-GFP in neurons treated with DMSO or CAL-101 (1 μm). The subcellular trafficking was evaluated as the ratio of each protein (APP or VSVG) in axonal compartments to that colocalizing with cis-Golgi GM130-positive structures in the soma. Scale bars, 10 μm in A and B and 20 μm in E,. Data are displayed as mean ± SEM. n = 25–38 neurons from 3 independent neuronal cultures in C and D and n = 11–14 neurons in F and G; one-way ANOVA followed by Bonferroni's post hoc test comparing each genetic group with its vehicle control (DMSO) and with the WT or APP/PS1 control group (DMSO) in C and D; Student's t test in F and G, *p < 0.05, **p < 0.01, ***p < 0.001.
Figure 2.
Figure 2.
Levels of axonal APP in neurons upon pharmacological or genetic inhibition of PI3Kδ. A, Representative images of double fluorescence immunocytochemistry for APP (red), GM130 (green), and MAP2 (blue) of cultures of hippocampal neurons from different genotypes treated with DMSO or CAL-101 (1 μm) for 2 h. B, Representative images of double fluorescence immunocytochemistry for neurofilament (NF, green) and APP (red) of cultures of hippocampal neurons from different genotypes and treated with DMSO or CAL-101 (1 μm) for 2 h. C, Quantification of the retention of APP in the cis-Golgi, as a percentage of the APP signal in GM130-positive structures, in neurons from different genotypes and treated with DMSO or CAL-101 (1 μm). D, Quantification of the levels of axonal APP, as the relative APP signal in NF-positive structures, in neurons from different genotypes treated with DMSO or CAL-101 (1 μm). Scale bar represents 10 μm. Data are displayed as mean ± SEM, n = 30–46 neurons from 3 independent neuronal cultures, one-way ANOVA followed by Bonferroni's post hoc test comparing each genetic group with its vehicle control (DMSO) and with the WT or APP/PS1 control group (DMSO), *p < 0.05, **p < 0.01, ***p < 0.001.
Figure 3.
Figure 3.
PI3Kδ inhibition leads to the formation of tubular APP-positive carriers with altered mobility parameters. A, Representative time series of hippocampal neurons from δD910A mice transfected with APP-GFP showing an elongated tubular-like carrier containing APP-GFP (asterisk) moving anterogradely along the axon. The short arrows represent changes in movement direction. B, Cumulative frequency distribution of the areas of APP-positive carriers from WT or δD910A neurons. C, Quantification of percentage of neurons containing tubular APP-GFP cargoes in neurons from WT or δD910A mice. D, Representative kymographs of APP-GFP-containing carriers moving along axons of hippocampal neurons from WT or δD910A mice. Each analyzed region is shown just above the respective kymograph. E, Quantification of the percentage of dwelling time relative to the total trafficking time in anterograde carriers from WT neurons and small anterograde carriers from δD910A neurons, and in large tubular anterograde carriers from δD910A neurons. The dwelling time is defined as the time the carriers spent with an instant speed between 0 and 0.7 μm/s. Scale bar represents 5 μm. Data are displayed as mean ± SEM; in B, n = 600–800 carriers from 12–16 neurons from 3 independent neuronal cultures; in C, n = 6 independent neuronal cultures with 10–27 neurons analyzed in each experiment; n = 27–50 carriers from 10 neurons. Student's t test in C and one-way ANOVA in E, followed by Bonferroni's post hoc test comparing all groups, ****p < 0.0001.
Figure 4.
Figure 4.
Impact of pharmacological PI3Kδ inactivation on Aβ levels in primary neuronal cell cultures. A, B, Primary mouse cortical neurons were treated with CAL-101 (1 μm) for 7 d. At DIV8, secreted and intracellular Aβ1–38, Aβ1–40, and Aβ1–42 were measured in supernatants (A) and lysates (B), respectively. Results are expressed as picograms per milliliter. C, Primary mouse cortical neurons were treated with vehicle (DMSO) or CAL-101 (0.1, 0.3 and 1 μm) for 7 d. On DIV8, neurons were subjected to the MTT assay of cell viability. Data are displayed as mean ± SEM, n = 5–6 in A and B, n = 6 in C. One-way ANOVA followed by Bonferroni's post hoc test comparing all groups with the vehicle control group in AC, **p < 0.01, ***p < 0.001.
Figure 5.
Figure 5.
Impact of genetic PI3Kδ inactivation on Aβ and APP levels in brains of APP/PS1 mice. A, Representative Western blot of PSD-95 and Synapsin-1 from brain extracts prepared from a different cohort of 12-month-old mice of indicated genotypes (3 animals per group). B, Densitometric measurements of PSD-95 normalized to GADP levels and to the average level obtained in WT mice. C, Densitometric measurements of Synapsin-1 normalized to GADP levels and to the average level obtained in WT mice. D, Representative Western blot of APP and Aβ1–40/42 from brain extracts prepared from the same 12-month-old cohort of mice. E, Densitometric measurements of APP normalized to GADP levels and to the average level obtained in APP/PS1 mice. F, Densitometric measurements of Aβ1–40/42 normalized to GADP levels. G, Quantification of the amount of total and soluble Aβ42 in cortical lysates of APP/PS1 and APP/PS1/δD910A mice by ELISA. The data of both genders of APP/PS1 were combined. No significant differences were found between males and females (p = 0.7922, data not shown). Data are displayed as mean ± SEM, n = 3 in BD and F, n = 11 and 3 mice in G. One-way ANOVA followed by Bonferroni's post hoc test comparing all groups with the WT group in B and C. Student's t test in EG, *p < 0.05, **p < 0.01, ****p < 0.0001.
Figure 6.
Figure 6.
Amyloid plaque load is reduced in brain sections by genetic inactivation of PI3Kδ. A, Representative photomicrographs of hippocampal sections from mice of different genotypes stained for Aβ plaques using Thioflavin S. B, C, Quantification of plaque number (B) and size (C) in the hippocampus of APP/PS1 and APP/PS1/δD910A mice. D, Representative photomicrograph of cortical sections stained with Thioflavin S. E, F, Quantification of plaque numbers (E) and area covered by plaques (F) in the cortex of experimental mice. Scale bar represents 100 μm. Data are displayed as mean ± SEM, n = 4 animals aged 6.5-months-old per genotype and 3 replicates per animal (each replicate is a different section from the same brain region i. e. hippocampus or cortex), Student's t test, *p < 0.05, **p < 0.01. The statistical power of the results is specified in the Figure 6-1.
Figure 7.
Figure 7.
Genetic and pharmacological inactivation of PI3Kδ activity ameliorate LPS-dependent release of TNFα in microglia and control TNFα levels in APP/PS1 mice. A, Relative TNFα release from Bv-2 murine-derived microglial cells, stimulated with LPS (10 ng/ml) for 8 h and treated with control vehicle (DMSO) or increasing concentrations of CAL-101 (0.1 μm, 0.3 μm, 1 or 3 μm). The data are expressed as percentage relative to LPS stimulation and DMSO treatment. B, TNFα release by mouse primary microglia stimulated for 24 h with control vehicle or LPS (100 ng/ml) and treated with DMSO or with increasing concentrations of “compound 12” (0.1 μm, 0.3 or 1 μm). C, MTT viability assay of mouse microglia after 24 h of control vehicle or LPS (100 ng/ml) stimulation and treatment with DMSO or increasing concentrations of “compound 12” (0.1 μm, 0.3 or 1 μm). D, F, H, J, Measurement of IL-1β, IFNγ, IL-6, and IL-10 release, respectively, by mouse primary microglia stimulated for 12 h with control vehicle or LPS (100 ng/ml) and treated with DMSO or with increasing concentrations of “compound 12” (0.1 μm, 0.3 or 1 μm). The data are expressed as pg/ml or as intensity signal arbitrary units (AU) of the cytokine present in the collected supernatants. E, G, I, Measurement of IFNγ, IL-6, and IL-10 release, respectively, from of Bv-2 murine-derived microglial cells, stimulated for 6 h with control vehicle or LPS (10 ng/ml) and treated with control (DMSO) or increasing concentrations of CAL-101 (0.3 or 1 μm). The data are expressed as pg/ml of the cytokine present in the collected supernatants. K, Representative Western blot of TNFα from brains of 6.5-month-old mice of different phenotypes. L, Densitometric measurements of TNFα normalized to β-tubulin levels. Data are displayed as mean ± SEM, n = 3 independent experiments with n = 4 replicates in each experiment in A, n = 5–6 in BJ, n = 3 animals per genotype in J. One-way ANOVA followed by Bonferroni's post hoc test comparing all groups with the LPS group, *p < 0.05, **p < 0.01 and ***p < 0.001 in AJ; one-way ANOVA followed by Bonferroni's post hoc test comparing all groups with the APP/PS1 group, ***p < 0.001 in L.
Figure 8.
Figure 8.
Brain gliosis in APP/PS1 mice is controlled by PI3Kδ activity. A, D, Representative images of double fluorescence immunohistochemistry for microglia (Iba1, red), astrocytes (GFAP, green) and nuclei (DAPI, blue) in coronal hippocampal sections (A) and coronal cortical sections (D). B, C, E, F, Tissue volume occupied by immunopositive structures calculated as a proportion of the total hippocampal volume imaged. Percentage volume of microglia (B, E) and astrocytes (C, F) in the hippocampus (B, C) and the cortex (E, F) of animals of different genotypes. Insets represent magnifications from each boxed area, showing regions of microglia and astrocyte accumulation. Scale bars, 100 μm in A and D. Data are displayed as mean ± SEM of n = 4 mice aged 6.5 months old per genotype and 3 replicates per animal (each replicate is a different section from the same brain structure -hippocampus or cortex-), one-way ANOVA followed by Bonferroni's post hoc test comparing all groups to the APP/PS1 group, **p < 0.01, ***p < 0.001, ****p < 0.0001 in B, C, E, F. The statistical power of the results is specified in the Figure 8-1.
Figure 9.
Figure 9.
Genetic inactivation of PI3Kδ increases survival and rescues spatial learning and memory of APP/PS1 mice. A, APP/PS1 transgenic mice (n = 131) present with a pronounced premature mortality that is ameliorated by inactivating PI3Kδ (p < 0.0001). Whereas the lethality was 42.7% in the APP/PS1 mice at the 210 d time point, in APP/PS1/δD910A animals (n = 100) it was reduced to 3%. B, Representative images of swimming tracks for mice of different genotypes on days 1, 3, and 5 of the learning phase of the Morris water maze. C, Learning acquisition plot measured as the time taken for mice to reach the submerged platform (latency) during the learning phase (daya 1, 3, and day 5). D, Latency to target the platform area during the probe test. E, Number of platform crossings during the probe test. F, Schematic diagram summarizing a model for the regulation of APP and TNFα trafficking by PI3Kδ in neurons and microglia. PI3Kδ is involved in the trafficking of APP and TNFα by controlling the formation of TGN-derived cargoes in neurons and microglia, respectively. By pharmacological modulation of PI3Kδ activity using CAL-101, the release of neuronal Aβ and microglial TNFα can be attenuated, reducing the extent of Aβ plaque formation and neuroinflammation. Data are displayed as mean ± SEM of n = 10 animals aged 6.5 months old per genotype, one-way ANOVA, *p < 0.05, **p < 0.01, ***p < 0.001, ****p < 0.001.

Similar articles

Cited by

References

    1. Ali K, Soond DR, Pineiro R, Hagemann T, Pearce W, Lim EL, Bouabe H, Scudamore CL, Hancox T, Maecker H, Friedman L, Turner M, Okkenhaug K, Vanhaesebroeck B (2014) Inactivation of PI(3)K p110delta breaks regulatory T-cell-mediated immune tolerance to cancer. Nature 510:407–411. 10.1038/nature13444 - DOI - PMC - PubMed
    1. Andersen OM, Reiche J, Schmidt V, Gotthardt M, Spoelgen R, Behlke J, von Arnim CA, Breiderhoff T, Jansen P, Wu X, Bales KR, Cappai R, Masters CL, Gliemann J, Mufson EJ, Hyman BT, Paul SM, Nykjaer A, Willnow TE (2005) Neuronal sorting protein-related receptor sorLA/LR11 regulates processing of the amyloid precursor protein. Proc Natl Acad Sci U S A 102:13461–13466. 10.1073/pnas.0503689102 - DOI - PMC - PubMed
    1. Audrain M, Haure-Mirande JV, Wang M, Kim SH, Fanutza T, Chakrabarty P, Fraser P, St George-Hyslop PH, Golde TE, Blitzer RD, Schadt EE, Zhang B, Ehrlich ME, Gandy S (2018) Integrative approach to sporadic Alzheimer's disease: deficiency of TYROBP in a tauopathy mouse model reduces C1q and normalizes clinical phenotype while increasing spread and state of phosphorylation of tau. Mol Psychiatry. In press. - PMC - PubMed
    1. Bates KA, Verdile G, Li QX, Ames D, Hudson P, Masters CL, Martins RN (2009) Clearance mechanisms of Alzheimer's amyloid-beta peptide: implications for therapeutic design and diagnostic tests. Mol Psychiatry 14:469–486. 10.1038/mp.2008.96 - DOI - PubMed
    1. Bero AW, Yan P, Roh JH, Cirrito JR, Stewart FR, Raichle ME, Lee JM, Holtzman DM (2011) Neuronal activity regulates the regional vulnerability to amyloid-beta deposition. Nat Neurosci 14:750–756. 10.1038/nn.2801 - DOI - PMC - PubMed

Publication types

MeSH terms

Substances