

Slow growth determines nonheritable antibiotic resistance in Salmonella enterica
- PMID: 31363068
- PMCID: PMC7206539
- DOI: 10.1126/scisignal.aax3938
Slow growth determines nonheritable antibiotic resistance in Salmonella enterica
Abstract
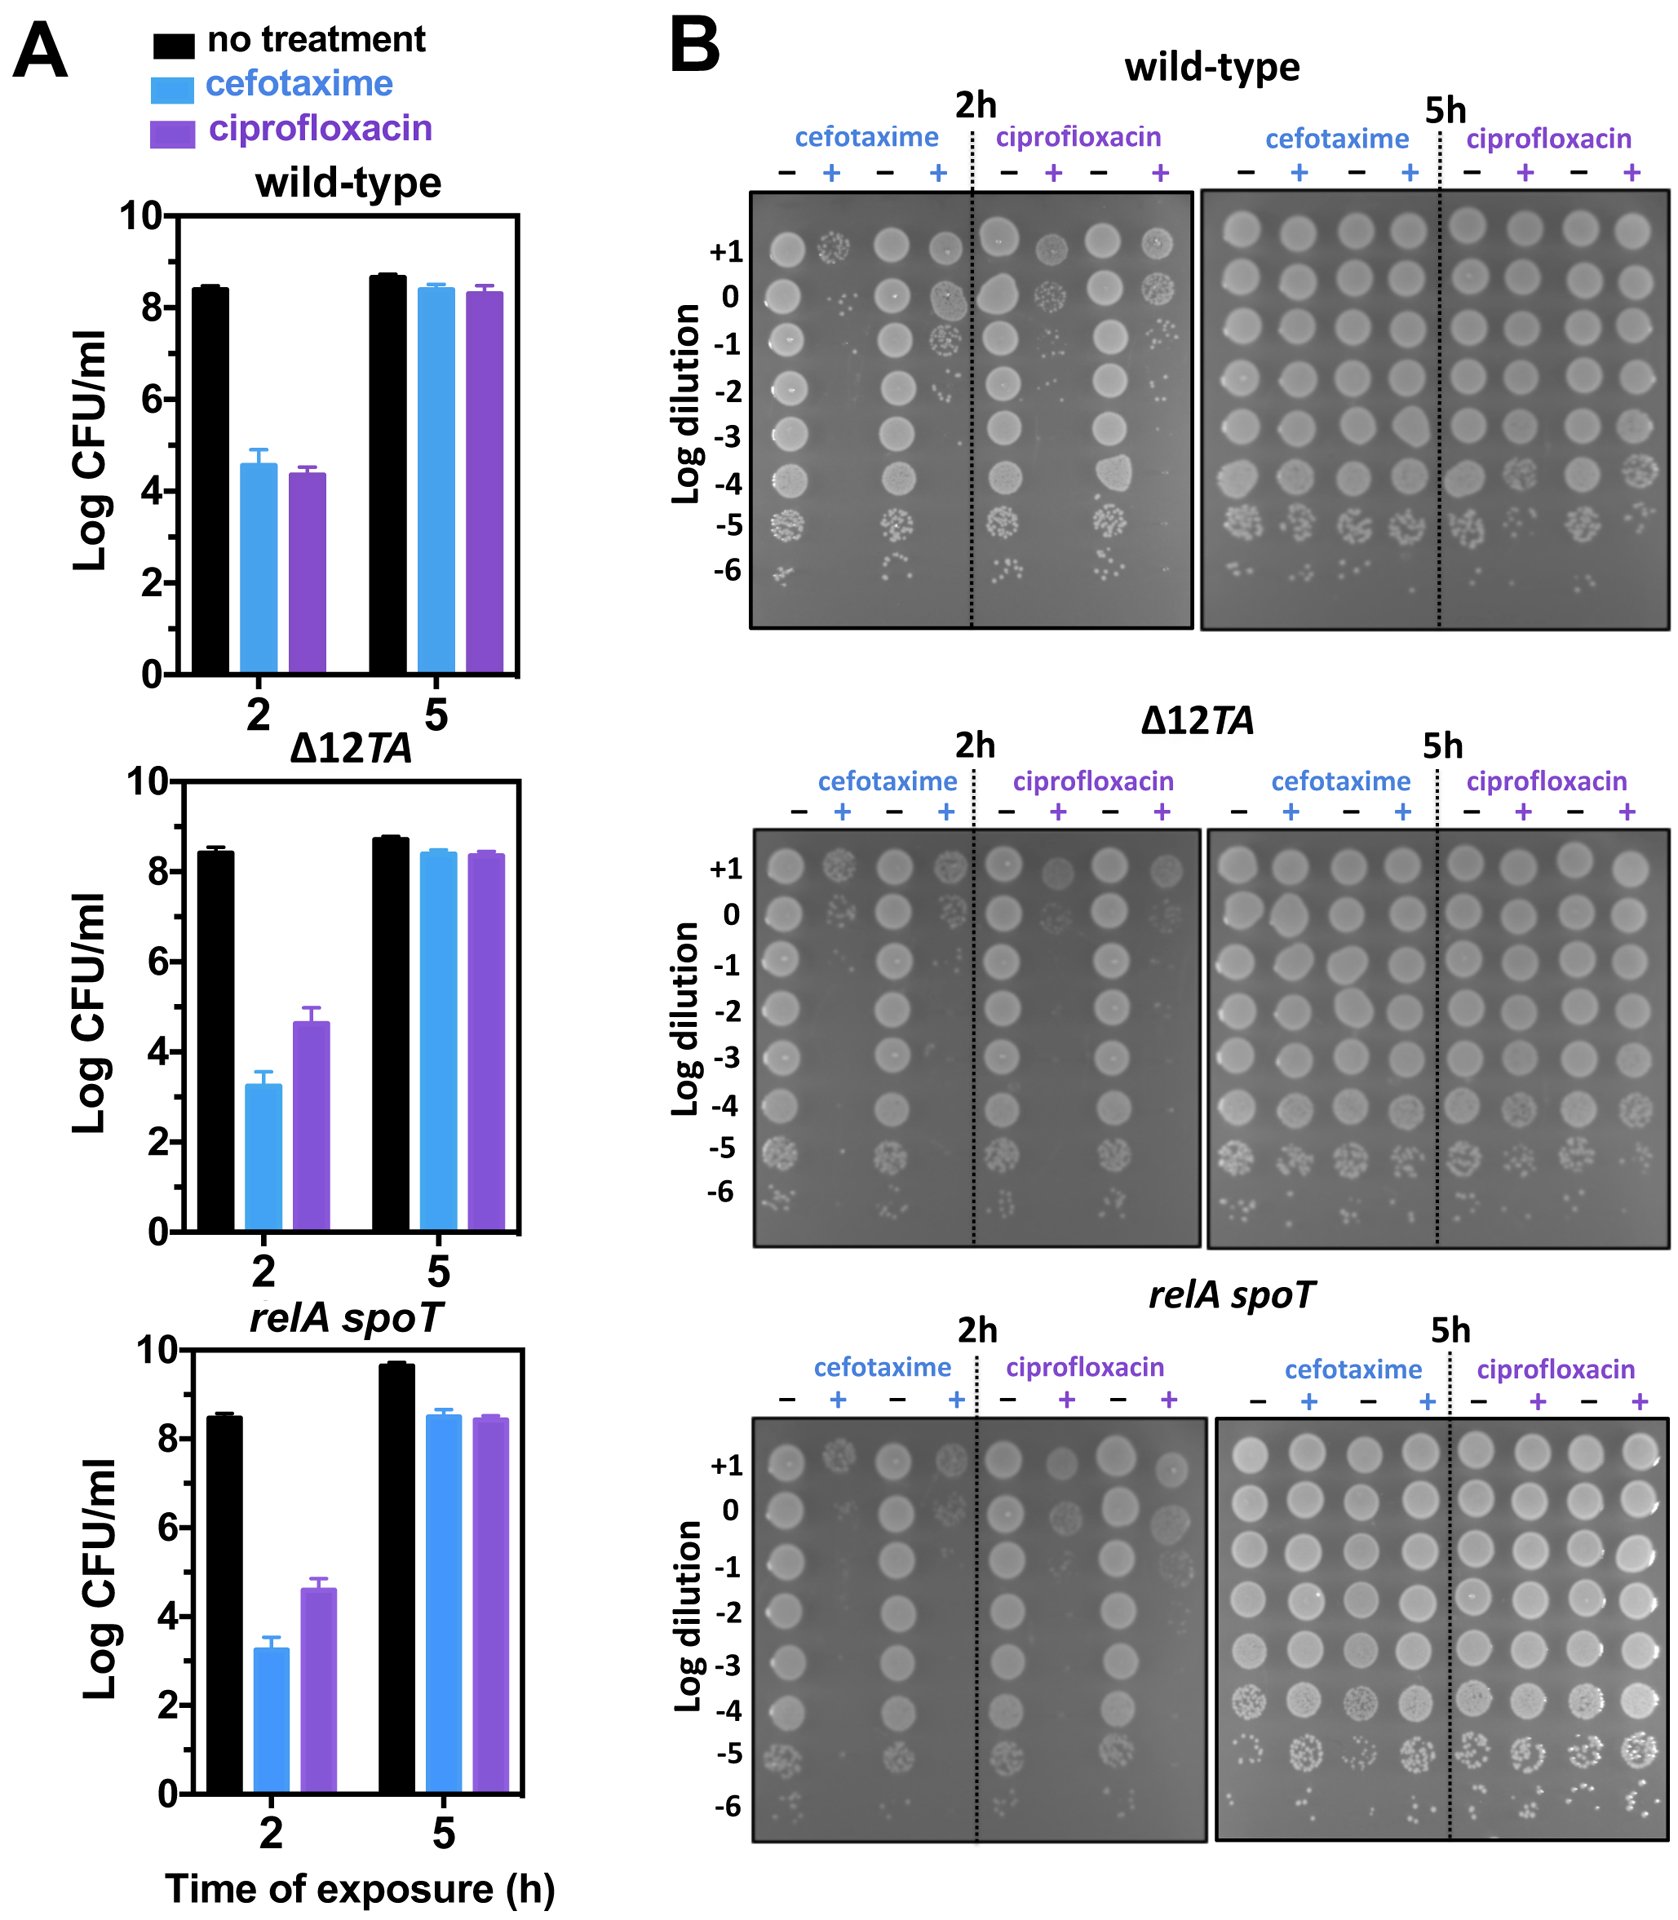
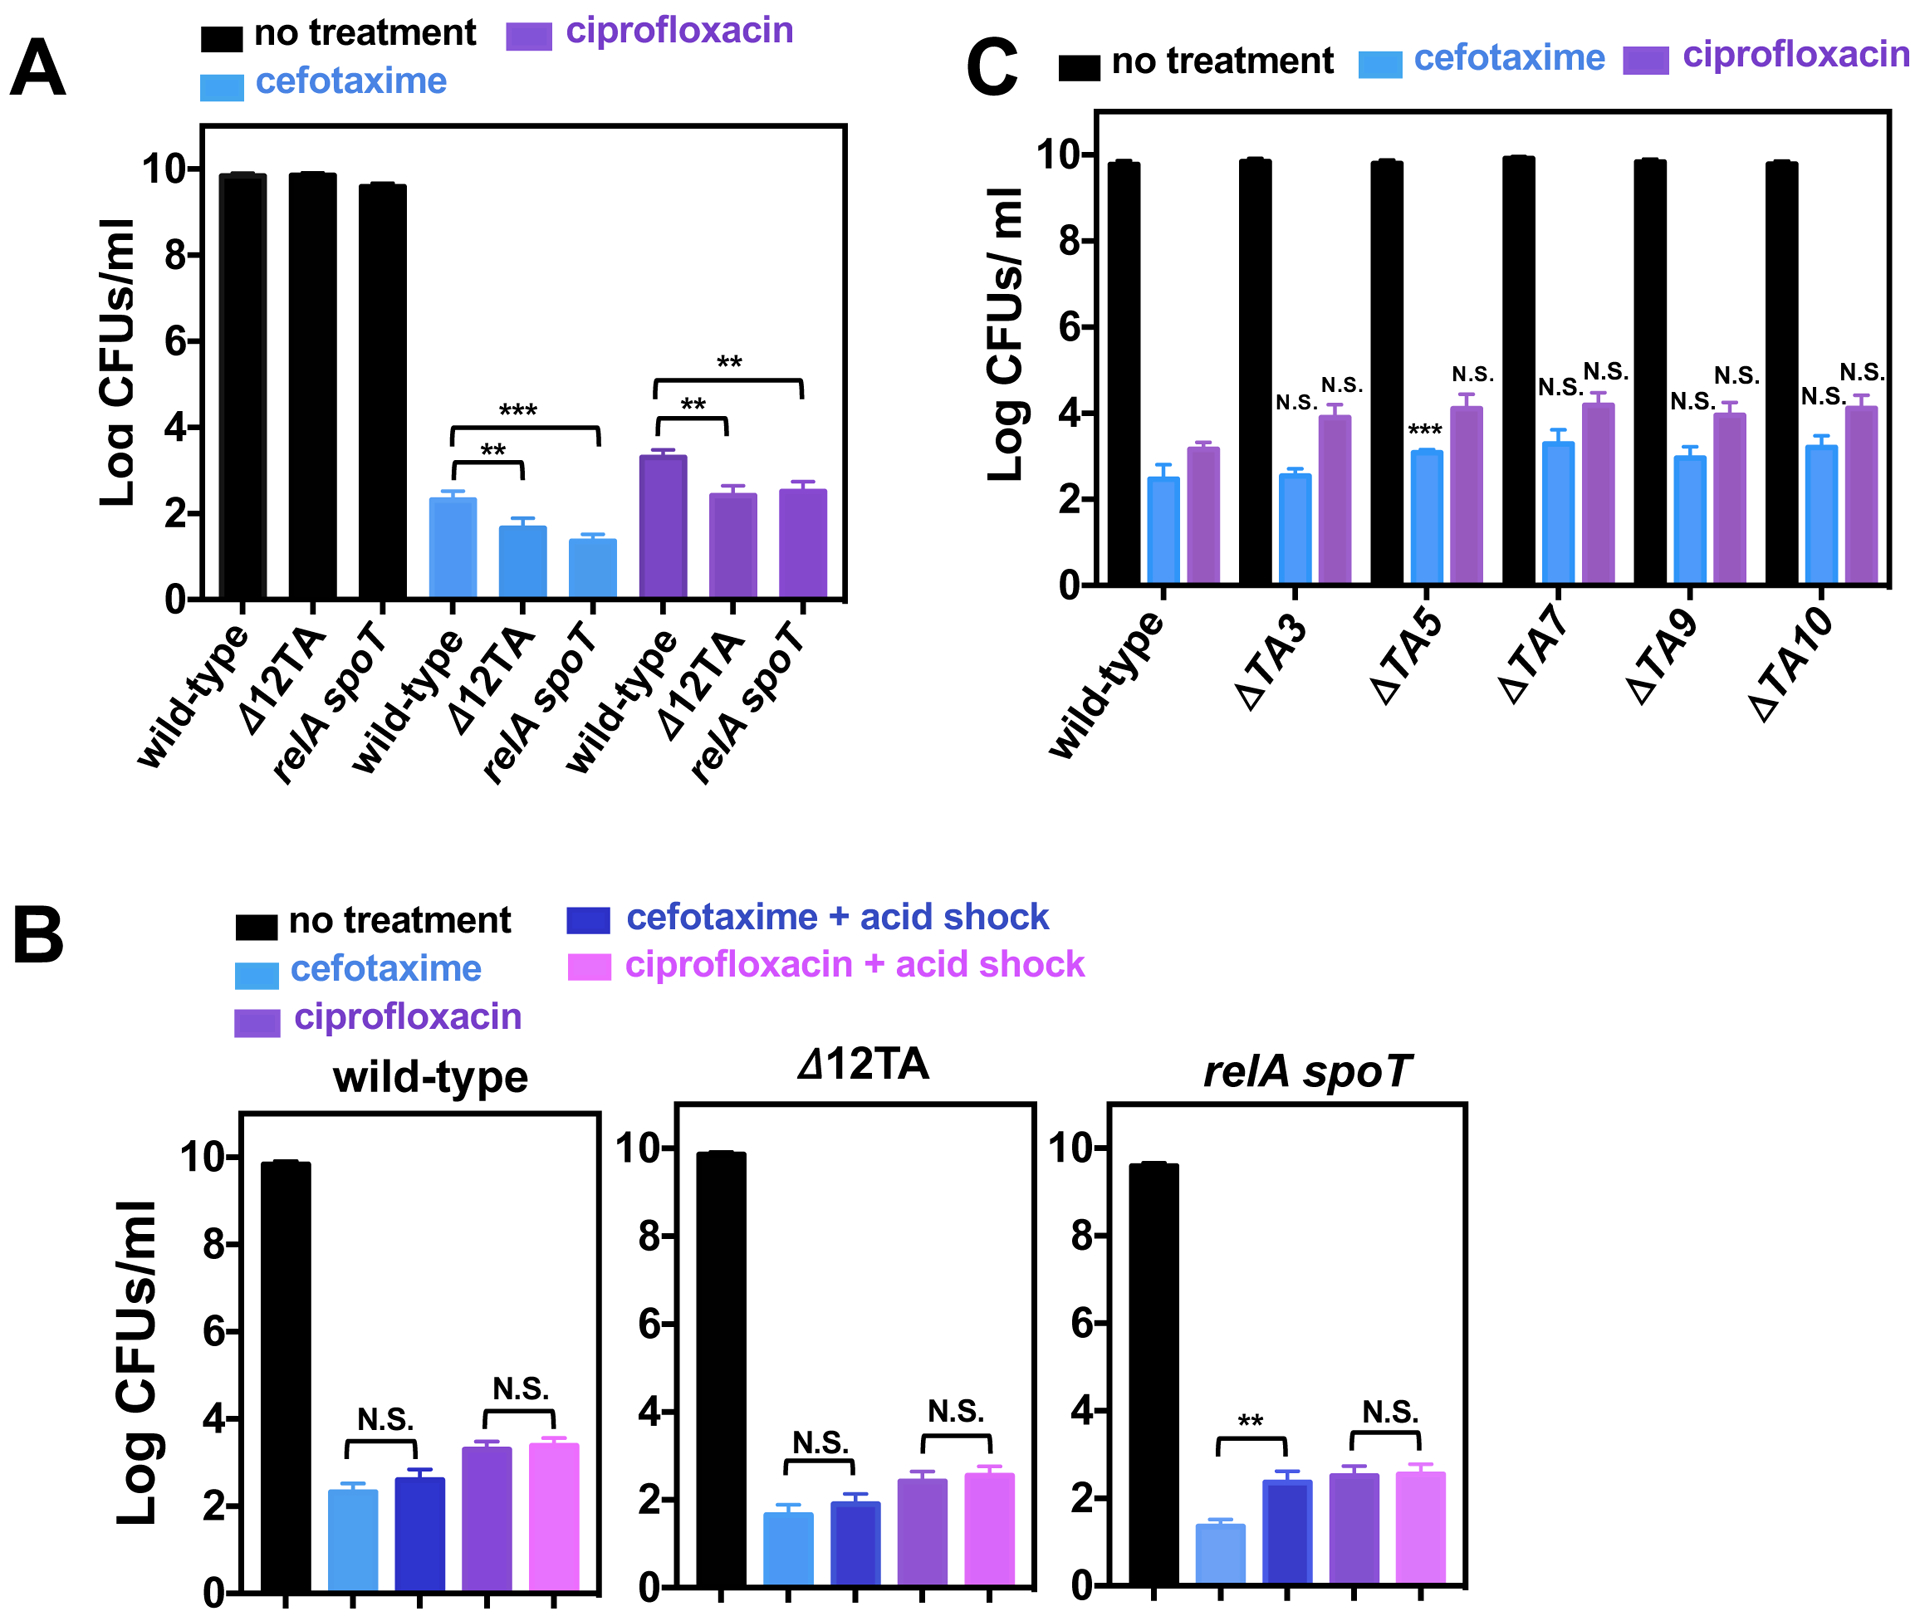
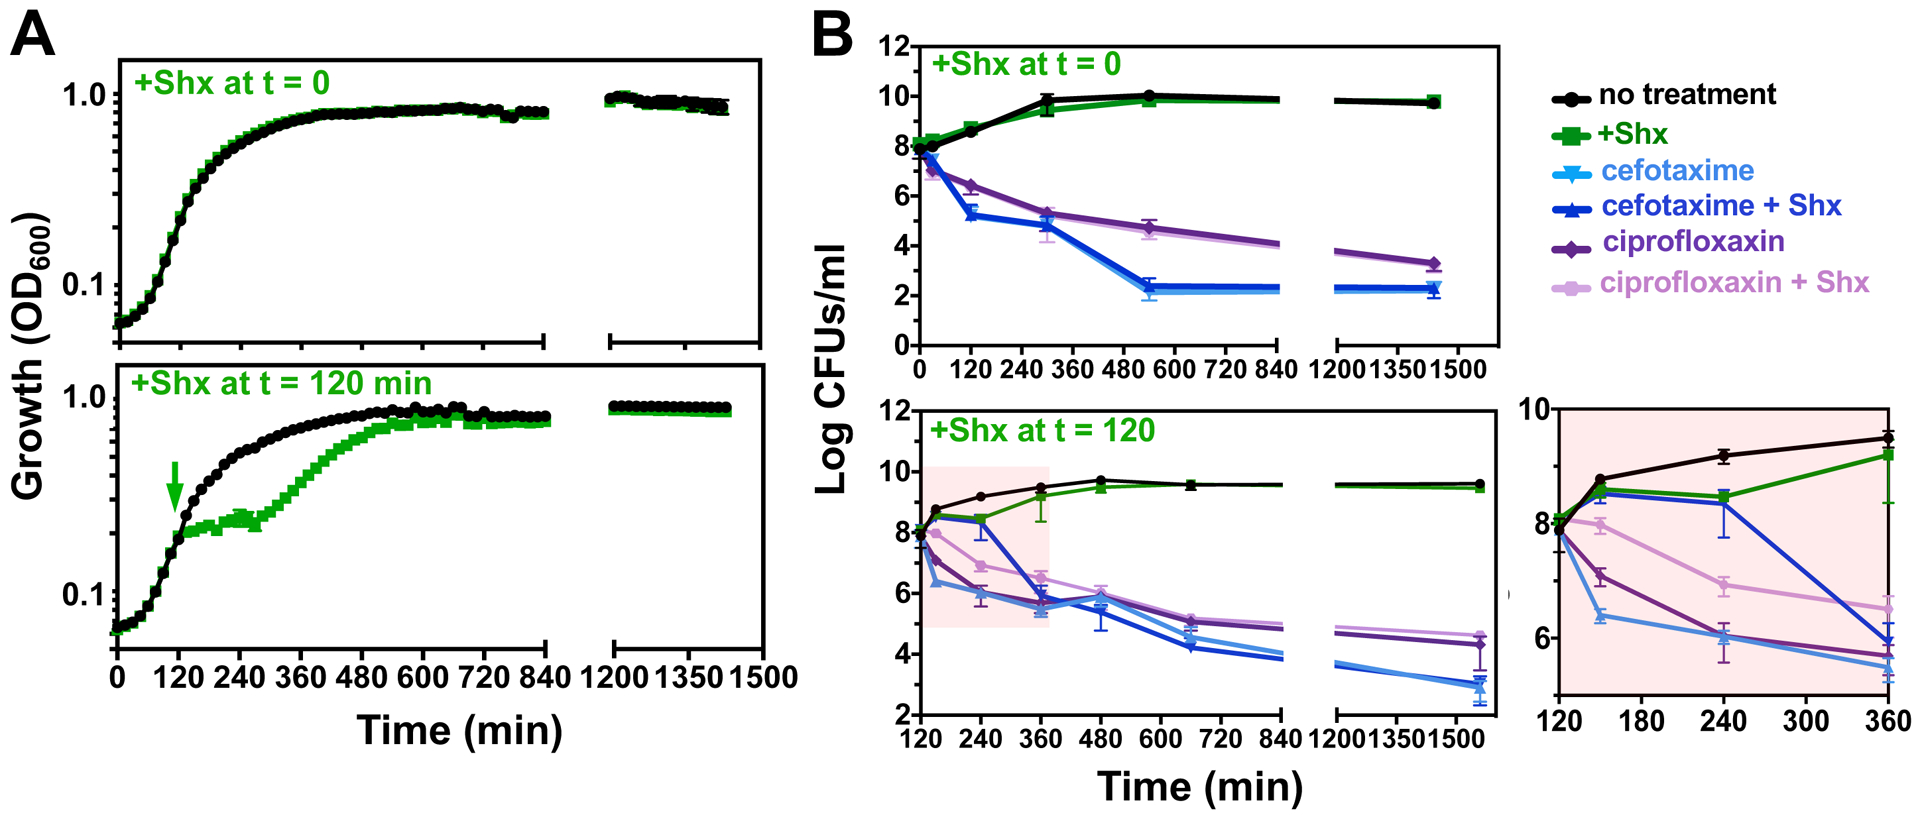
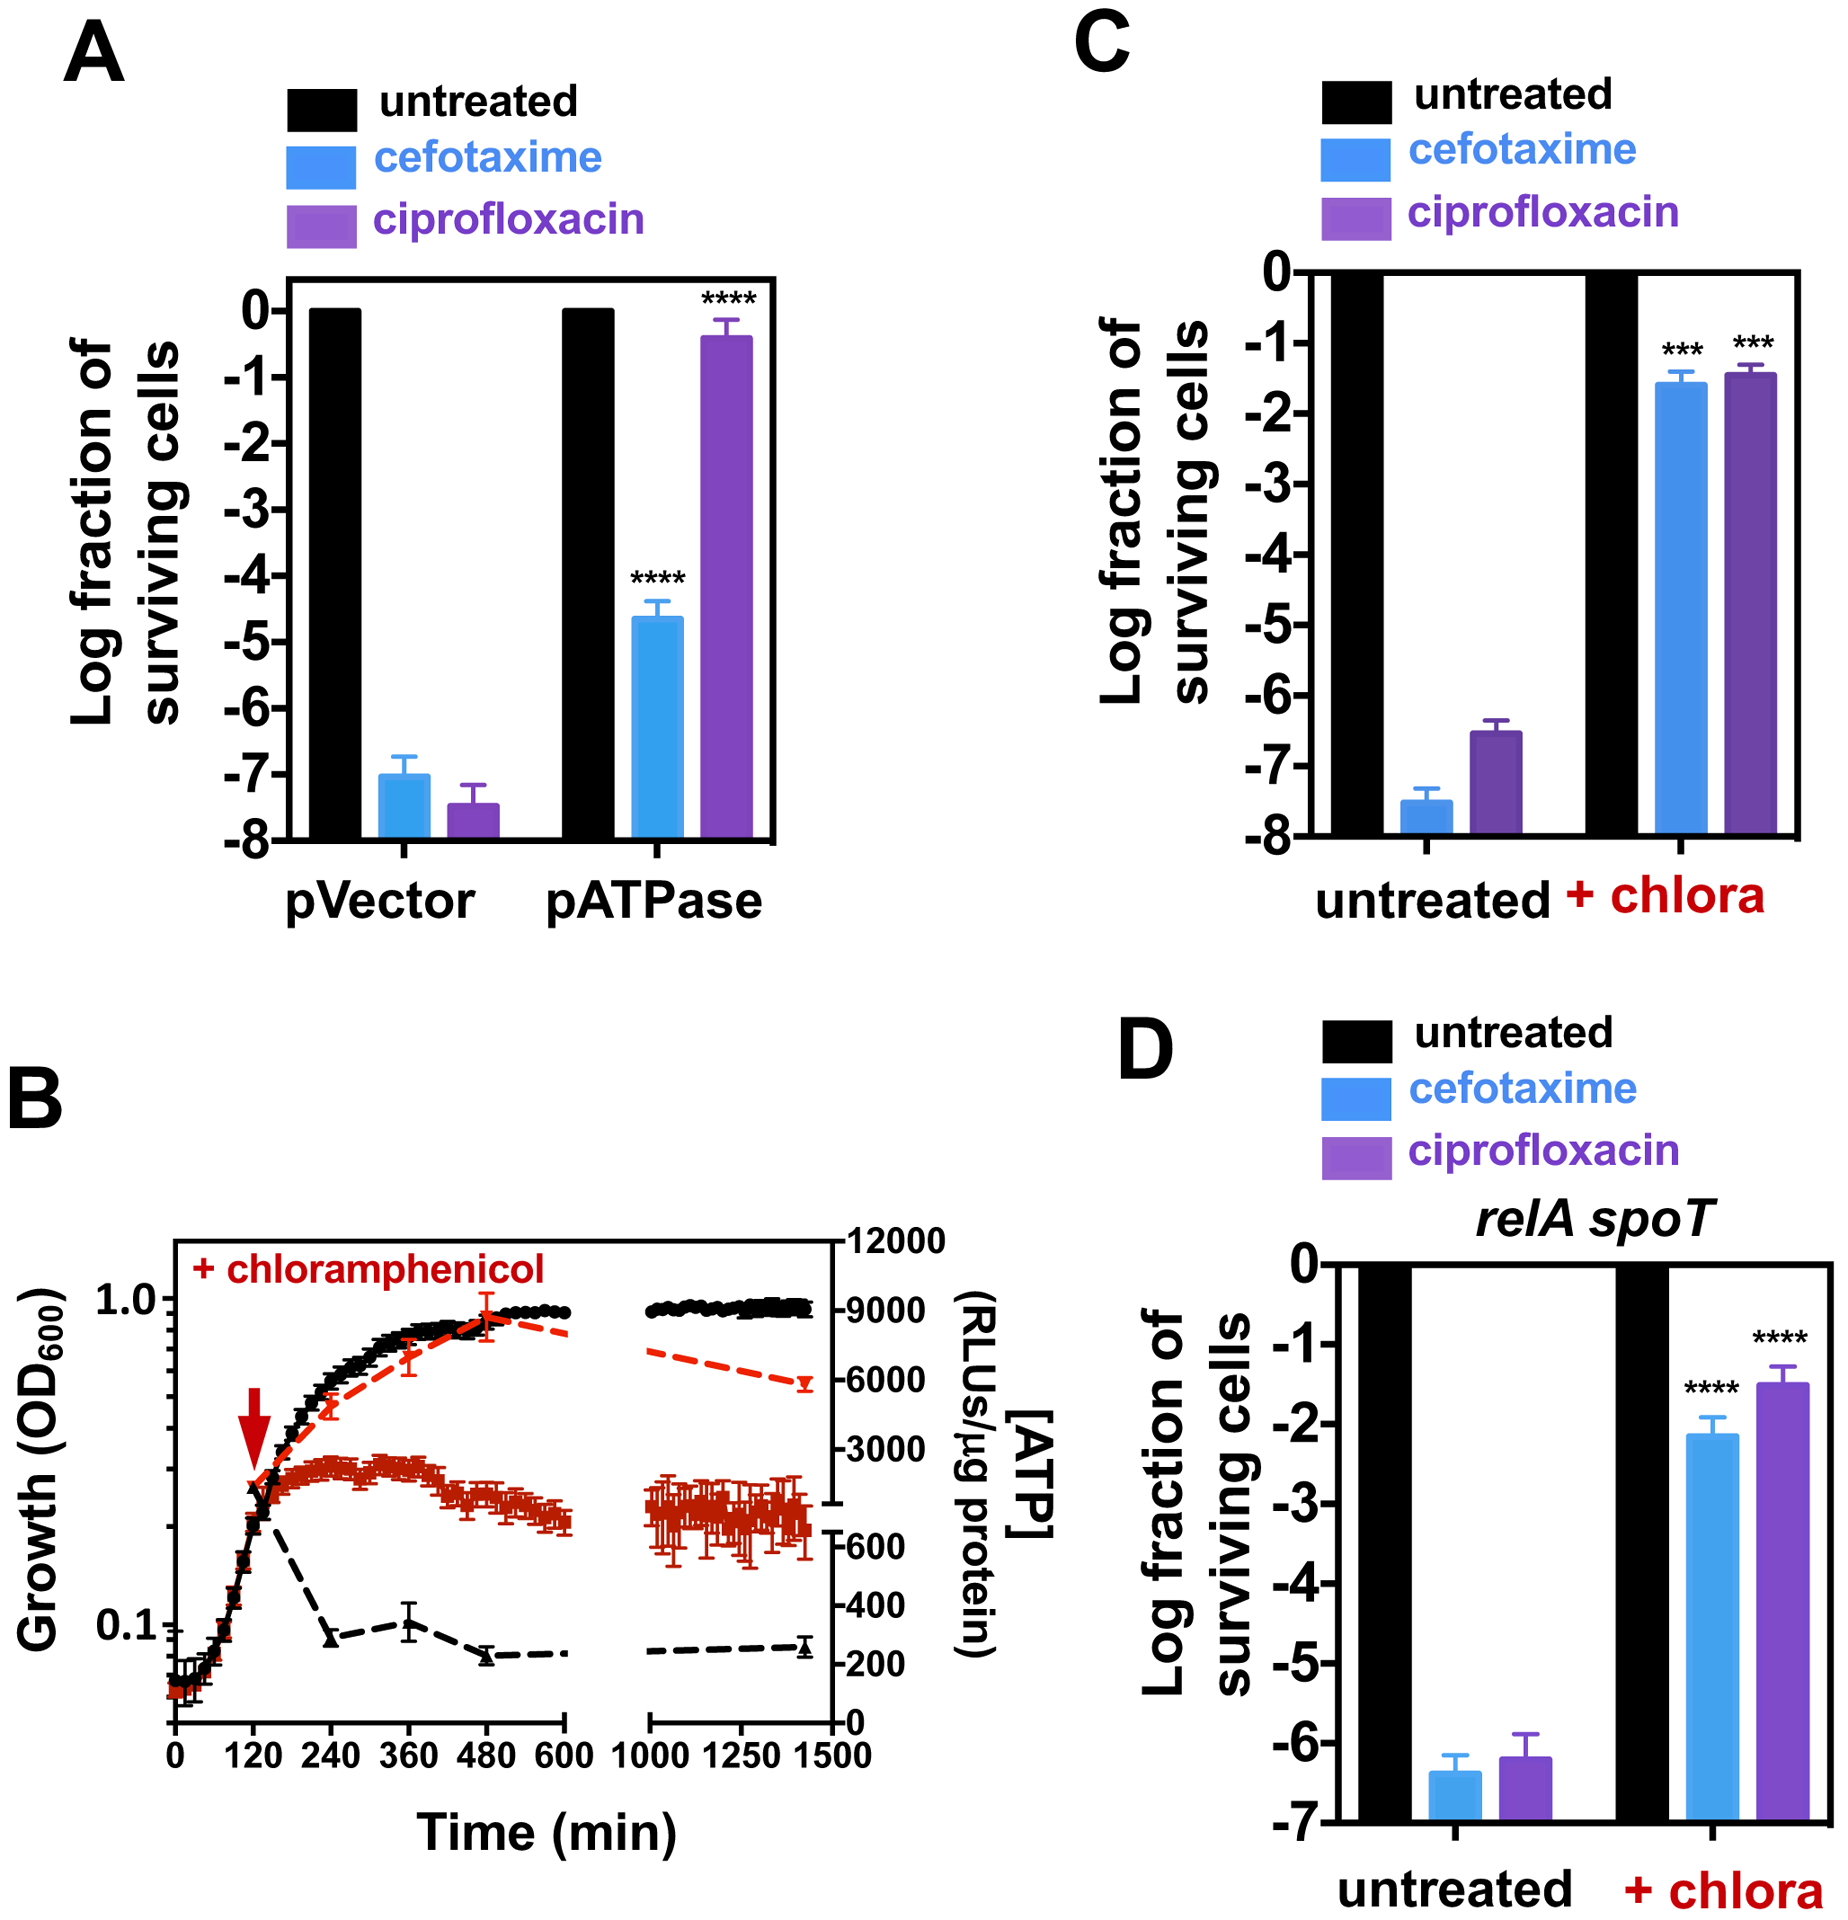
Bacteria can withstand killing by bactericidal antibiotics through phenotypic changes mediated by their preexisting genetic repertoire. These changes can be exhibited transiently by a large fraction of the bacterial population, giving rise to tolerance, or displayed by a small subpopulation, giving rise to persistence. Apart from undermining the use of antibiotics, tolerant and persistent bacteria foster the emergence of antibiotic-resistant mutants. Persister formation has been attributed to alterations in the abundance of particular proteins, metabolites, and signaling molecules, including toxin-antitoxin modules, adenosine triphosphate, and guanosine (penta) tetraphosphate, respectively. Here, we report that persistent bacteria form as a result of slow growth alone, despite opposite changes in the abundance of such proteins, metabolites, and signaling molecules. Our findings argue that transitory disturbances to core activities, which are often linked to cell growth, promote a persister state regardless of the underlying physiological process responsible for the change in growth.
Copyright © 2019 The Authors, some rights reserved; exclusive licensee American Association for the Advancement of Science. No claim to original U.S. Government Works.
Conflict of interest statement
Figures
Comment in
-
Slow growth causes bacterial persistence.Sci Signal. 2019 Jul 30;12(592):eaay1167. doi: 10.1126/scisignal.aay1167. Sci Signal. 2019. PMID: 31363066
Similar articles
-
A Physiological Basis for Nonheritable Antibiotic Resistance.mBio. 2020 Jun 16;11(3):e00817-20. doi: 10.1128/mBio.00817-20. mBio. 2020. PMID: 32546621 Free PMC article. Review.
-
Adenosine Awakens Metabolism to Enhance Growth-Independent Killing of Tolerant and Persister Bacteria across Multiple Classes of Antibiotics.mBio. 2022 Jun 28;13(3):e0048022. doi: 10.1128/mbio.00480-22. Epub 2022 May 16. mBio. 2022. PMID: 35575513 Free PMC article.
-
The RNA-Binding Protein ProQ Promotes Antibiotic Persistence in Salmonella.mBio. 2022 Dec 20;13(6):e0289122. doi: 10.1128/mbio.02891-22. Epub 2022 Nov 21. mBio. 2022. PMID: 36409088 Free PMC article.
-
Prophages and Growth Dynamics Confound Experimental Results with Antibiotic-Tolerant Persister Cells.mBio. 2017 Dec 12;8(6):e01964-17. doi: 10.1128/mBio.01964-17. mBio. 2017. PMID: 29233898 Free PMC article.
-
Multidrug tolerance of biofilms and persister cells.Curr Top Microbiol Immunol. 2008;322:107-31. doi: 10.1007/978-3-540-75418-3_6. Curr Top Microbiol Immunol. 2008. PMID: 18453274 Review.
Cited by
-
Rifampicin tolerance and growth fitness among isoniazid-resistant clinical Mycobacterium tuberculosis isolates from a longitudinal study.Elife. 2024 Sep 9;13:RP93243. doi: 10.7554/eLife.93243. Elife. 2024. PMID: 39250422 Free PMC article.
-
The Effect of the Gallbladder Environment during Chronic Infection on Salmonella Persister Cell Formation.Microorganisms. 2022 Nov 16;10(11):2276. doi: 10.3390/microorganisms10112276. Microorganisms. 2022. PMID: 36422346 Free PMC article.
-
Adapting to the Airways: Metabolic Requirements of Pseudomonas aeruginosa during the Infection of Cystic Fibrosis Patients.Metabolites. 2019 Oct 16;9(10):234. doi: 10.3390/metabo9100234. Metabolites. 2019. PMID: 31623245 Free PMC article. Review.
-
Salmonella Central Carbon Metabolism Enhances Bactericidal Killing by Fluoroquinolone Antibiotics.Antimicrob Agents Chemother. 2022 Jul 19;66(7):e0234421. doi: 10.1128/aac.02344-21. Epub 2022 Jun 6. Antimicrob Agents Chemother. 2022. PMID: 35658490 Free PMC article.
-
Persister Cells Resuscitate Using Membrane Sensors that Activate Chemotaxis, Lower cAMP Levels, and Revive Ribosomes.iScience. 2020 Jan 24;23(1):100792. doi: 10.1016/j.isci.2019.100792. Epub 2019 Dec 21. iScience. 2020. PMID: 31926430 Free PMC article.
References
-
- Brauner A, Fridman O, Gefen O, Balaban NQ, Distinguishing between resistance, tolerance and persistence to antibiotic treatment. Nat. Rev. Microbiol 14, 320–330 (2016). - PubMed
-
- Lewis K, Persister cells. Annu. Rev. Microbiol 64, 357–372 (2010). - PubMed
-
- Roth JR, Anderson DI, Amplification-mutagenesis—how growth under selection contributes to the origin of genetic diversity and explains the phenomenon of adaptive mutation. Res. Microbiol 155, 342–351 (2004). - PubMed
-
- Hersh MN, Ponder RG, Hastings PJ, Rosenberg SM, Adaptive mutation and amplification in Escherichia coli: two pathways of genome adaptation under stress. Res. Microbiol 155, 352–359 (2004). - PubMed
-
- Miller C, Thomsen LE, Gaggero C, Mosseri R, Ingmer H, Cohen SN, SOS response induction by beta-lactams and bacterial defense against antibiotic lethality. Science 305, 1629–1631 (2004). - PubMed
Publication types
MeSH terms
Grants and funding
LinkOut - more resources
Full Text Sources
Medical
