. 2019 Jul 30;10(1):3397.
doi: 10.1038/s41467-019-11414-3.

Genetically diverse Pseudomonas aeruginosa populations display similar transcriptomic profiles in a cystic fibrosis explanted lung

Affiliations

Genetically diverse Pseudomonas aeruginosa populations display similar transcriptomic profiles in a cystic fibrosis explanted lung

Adrian Kordes et al. Nat Commun. .

Abstract

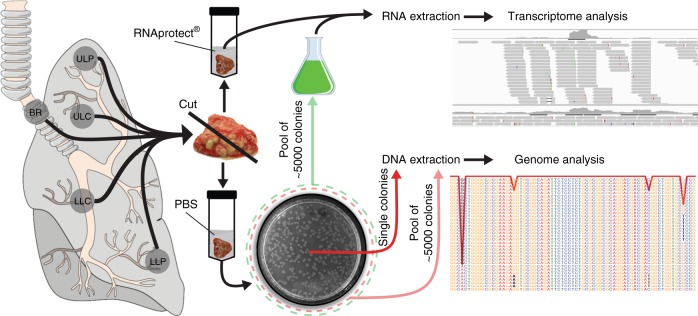
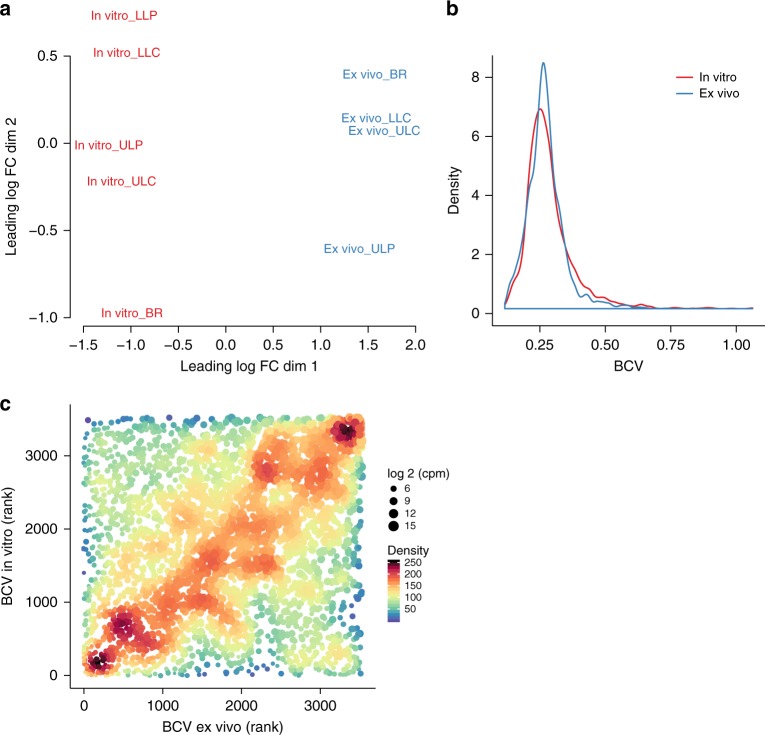
Previous studies have demonstrated substantial genetic diversification of Pseudomonas aeruginosa across sub-compartments in cystic fibrosis (CF) lungs. Here, we isolate P. aeruginosa from five different sampling areas in the upper and lower airways of an explanted CF lung, analyze ex vivo transcriptional profiles by RNA-seq, and use colony re-sequencing and deep population sequencing to determine the genetic diversity within and across the various sub-compartments. We find that, despite genetic variation, the ex vivo transcriptional profiles of P. aeruginosa populations inhabiting different regions of the CF lung are similar. Although we cannot estimate the extent to which the transcriptional response recorded here actually reflects the in vivo transcriptomes, our results indicate that there may be a common in vivo transcriptional profile in the CF lung environment.


Conflict of interest statement

The authors declare no competing interests.

Figures

Fig. 1
Fig. 1
Collection of regional P. aeruginosa populations from an explanted cystic fibrosis (CF) lung. Tissue from five different compartments of an explanted CF lung was sampled (main bronchus = BR; upper lobe central = ULC and peripheral = ULP; lower lobe central = LLC and peripheral = LLP). One part of the tissue was homogenized in the presence of RNAprotect for ex vivo RNA-sequencing (RNASeq) and the other part was streaked on selective agar plates to recover single P. aeruginosa isolates (after homogenization in phosphate-buffered saline (PBS)). Pools of ~5000 single colonies (green dashed circle) from the five sub-compartments were cultivated in rich medium conditions to record in vitro transcriptome profiles by RNASeq. DNA was extracted from overnight cultures of single isolates and from cell pellets of pools of agar grown colonies (red dashed circle)
Fig. 2
Fig. 2
Histological analysis of the cystic fibrosis (CF) lung. The hematoxylin–eosin-stained tissue sections (ac) show lung parenchyma with a dilated conducting airway (bronchiectasis) filled with mucopurulent secretions (b detail of a). The airways retain their typical lining with ciliated columnar epithelium (asterisk). Reserve cell and goblet cell hyperplasia as well as scarring and chronic inflammation (arrowhead) of the bronchial wall can be observed. c Bacterial colonies (arrowhead) are found in the airway lumen mucopurulent secretions. d Residing bacteria are identified as P. aeruginosa by application of a species-specific fluorescence in situ hybridization. Scale bars of 1000 µm (a), 100 µm (b, c), and 10 µm (d) are included
Fig. 3
Fig. 3
Genome sequencing of single isolates and pools. a The single-nucleotide polymorphism (SNP) frequency in 10 single isolates per compartment was correlated to the SNP frequencies in the pools (mean of two replicates) of the respective compartment. The overall linear association between the detection of SNPs in single genome vs. pooled genome sequencing was high (Pearson’s correlation coefficient r = 0.924, adjusted p value ≤0.001). Slight jitter was added to increase visibility (up to 2% change). b Genomes from single isolates were de novo assembled and the phylogenetic tree was created based on a multi-FASTA alignment of all of the core genes using PRANK. The phylogenetic tree was visualized with the iTOL online tool. Color code of the lung isolates indicates from which sub-compartment they were recovered: main bronchus = blue, upper lobe central = red, upper lobe peripheral = orange, lower lobe central = green and lower lobe peripheral = purple. c Venn diagram of the distribution of the 770 identified SNPs in the isolates across the five lung compartments. The bar plots indicate the number of the compartment-specific SNPs that are shared by a number of individual isolates among the overall 10 sequenced isolates from each of the compartment. Source data are provided as a Source Data file
Fig. 4
Fig. 4
Directional selection of genetic variations. Genes with multiple mutations and the corresponding clinical isolates harboring these mutations are shown. The top three genes harboring more than two mutations were mexB, ftsI, and folM. Furthermore, genes are listed with two mutations and those occurred in at least 15 isolates. The gray squares indicate the presence of the mutation in the respective clinical isolate. Color code of the lung isolates indicates from which sub-compartment they were recovered: main bronchus = blue, upper lobe central = red, upper lobe peripheral = orange, lower lobe central = green, and lower lobe peripheral = purple
Fig. 5
Fig. 5
Variances of gene expression in vitro and ex vivo. To reduce the influence of sequencing depth on variance, sample reads were subsampled to the same level and filtered (counts per million (cpm) in all samples ≥5). Distribution of normalized reads was comparable in all samples after data processing (Supplementary Fig. 3a). In addition, subsampling did not affect distribution of normalized reads and also the number of remaining genes after filtering was similar (Supplementary Fig. 3a). The ex vivo LLP transcriptional profile has been removed prior analysis because <500,000 reads were obtained. a Multidimensional scaling plot of ex vivo and in vitro samples. b Density plot of the biological coefficient of variation (BCV) for the ex vivo and in vitro transcriptional profiles. The median values were the same for both conditions (ex vivo: 0.265 (95% confidence interval (CI) = 0.2633–0.2668); in vitro: 0.267 (CI = 0.2643–0.2693); CI’s were calculated using the basic bootstrap method (5000 iterations). Different data processing did not have a major effect on the outcome (Supplementary Fig. 3c, d). c A rank correlation was performed to test if same genes have comparable BCV’s ex vivo and in vitro (Spearman’s rank correlation coefficient = 0.233, p value = 8.2 × 10–45). The point colors and sizes indicate the density of the plots and the sequencing depth of the genes (log 2 cpm), respectively. Source data are provided as a Source Data file
Fig. 6
Fig. 6
Cystic fibrosis (CF) habitat-specific transcriptional profile. Genes that were differentially expressed (log 2 fold change (FC) ≥1.5) in the ex vivo transcriptional profile compared to the in vitro condition were assigned to GO terms and PseudoCAP categories (green text). The enrichment factor is depicted in a and provides information on the proportion of regulated genes belonging to a functional category relative to the proportion of all genes (that were considered for differential expression analysis) belonging to that category. Categories with significantly enriched genes are depicted (hypergeometric test, adjusted p value ≤0.05), while fold-change enrichment is indicated at the x axis. Source data are provided as a Source Data file. b Differentially expressed genes (ex vivo vs. in vitro) identified in this study (log 2 FC ≥1.3, adjusted p value <0.05) were compared with those identified in two previous studies, which analyzed the P. aeruginosa transcriptional profile in CF sputum samples (Rossi et al. and Cornforth et al. (log 2FC ≥1.3, adjusted p value <0.05)). Lists of the overlapping genes are found in Supplementary Data 2

Similar articles

Cited by

References

    1. Frimmersdorf E, Horatzek S, Pelnikevich A, Wiehlmann L, Schomburg D. How Pseudomonas aeruginosa adapts to various environments: a metabolomic approach. Environ. Microbiol. 2010;12:1734–1747. - PubMed
    1. Klockgether J, Tummler B. Recent advances in understanding Pseudomonas aeruginosa as a pathogen. F1000Res. 2017;6:1261. - PMC - PubMed
    1. de Bentzmann S, Plesiat P. The Pseudomonas aeruginosa opportunistic pathogen and human infections. Environ. Microbiol. 2011;13:1655–1665. - PubMed
    1. Gellatly SL, Hancock RE. Pseudomonas aeruginosa: new insights into pathogenesis and host defenses. Pathog. Dis. 2013;67:159–173. - PubMed
    1. Valentini M, Gonzalez D, Mavridou DA, Filloux A. Lifestyle transitions and adaptive pathogenesis of Pseudomonas aeruginosa. Curr. Opin. Microbiol. 2018;41:15–20. - PubMed

Publication types

MeSH terms

Substances