

Healthy ageing trajectories and lifestyle behaviour: the Mexican Health and Aging Study
- PMID: 31363117
- PMCID: PMC6667468
- DOI: 10.1038/s41598-019-47238-w
Healthy ageing trajectories and lifestyle behaviour: the Mexican Health and Aging Study
Abstract
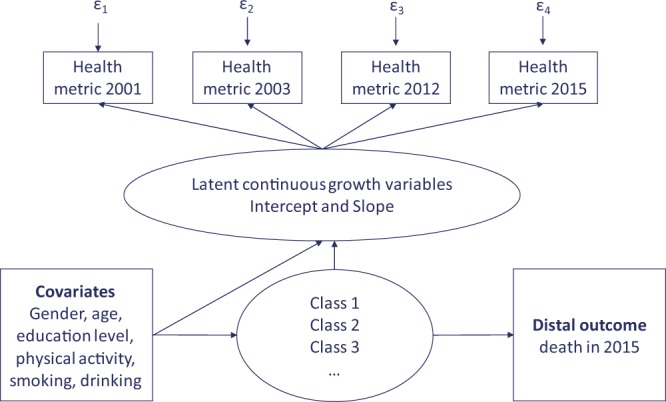
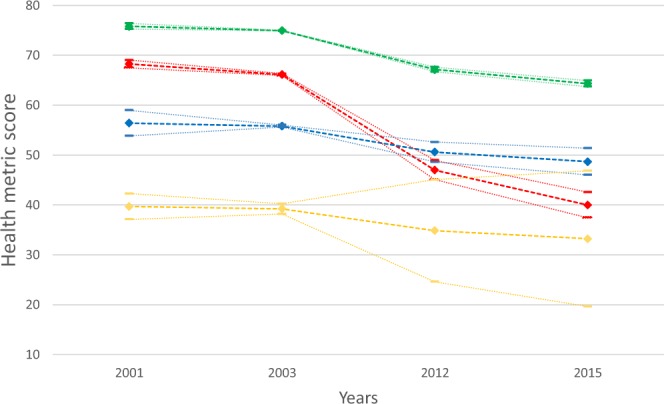
Projections show that the number of people above 60 years old will triple by 2050 in Mexico. Nevertheless, ageing is characterised by great variability in the health status. In this study, we aimed to identify trajectories of health and their associations with lifestyle factors in a national representative cohort study of older Mexicans. We used secondary data of 14,143 adults from the Mexican Health and Aging Study (MHAS). A metric of health, based on the conceptual framework of functional ability, was mapped onto four waves (2001, 2003, 2012, 2015) and created by applying Bayesian multilevel Item Response Theory (IRT). Conditional Growth Mixture Modelling (GMM) was used to identify latent classes of individuals with similar trajectories and examine the impact of physical activity, smoking and alcohol on those. Conditional on sociodemographic and lifestyle behaviour four latent classes were suggested: high-stable, moderate-stable, low-stable and decliners. Participants who did not engage in physical activity, were current or previous smokers and did not consume alcohol at baseline were more likely to be in the trajectory with the highest deterioration (i.e. decliners). This study confirms ageing heterogeneity and the positive influence of a healthy lifestyle. These results provide the ground for new policies.
Conflict of interest statement
The authors declare no competing interests.
Figures

References
-
- World Population Prospects: The 2015 Revision, Key Findings and Advance Tables. Report No. Working Paper No. ESA/P/WP.241., (United Nations, Department of Economic and Social Affairs, Population Division, 2015).
-
- World Health Organization. 10 Facts on ageing and the life course, http://www.who.int/features/factfiles/ageing/ageing_facts/en/index2.html
Publication types
MeSH terms
Grants and funding
LinkOut - more resources
Full Text Sources
Medical
