. 2019 Jul 30;9(1):11036.
doi: 10.1038/s41598-019-46265-x.

Genetic basis of functional variability in adhesion G protein-coupled receptors

Affiliations

Genetic basis of functional variability in adhesion G protein-coupled receptors

Alexander Bernd Knierim et al. Sci Rep. .

Abstract

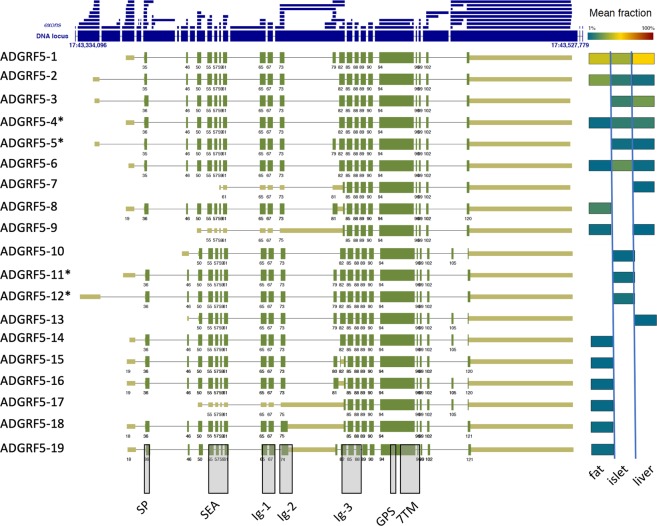
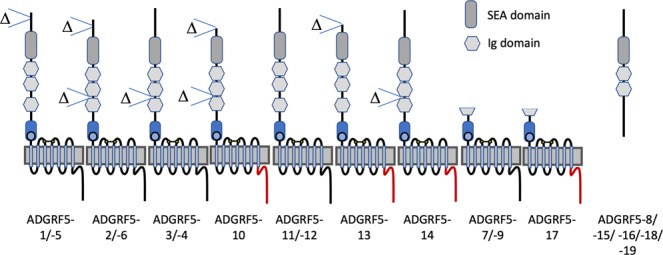
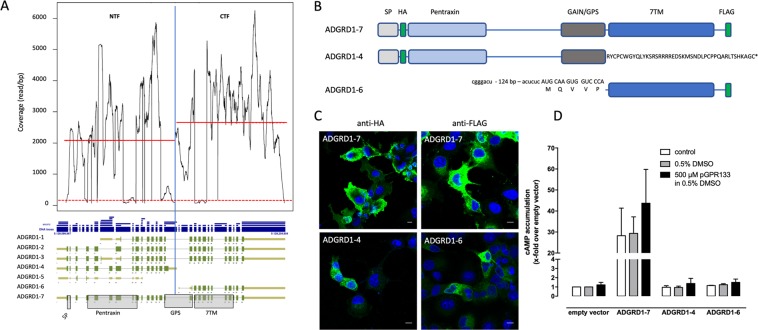
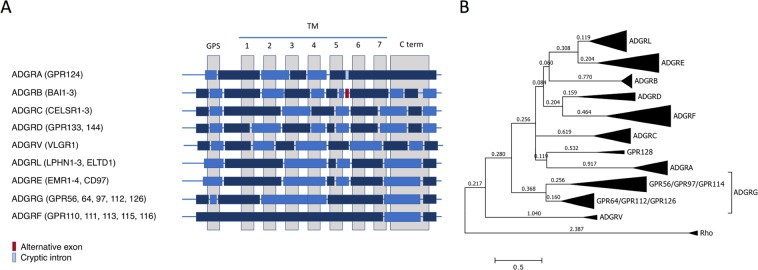
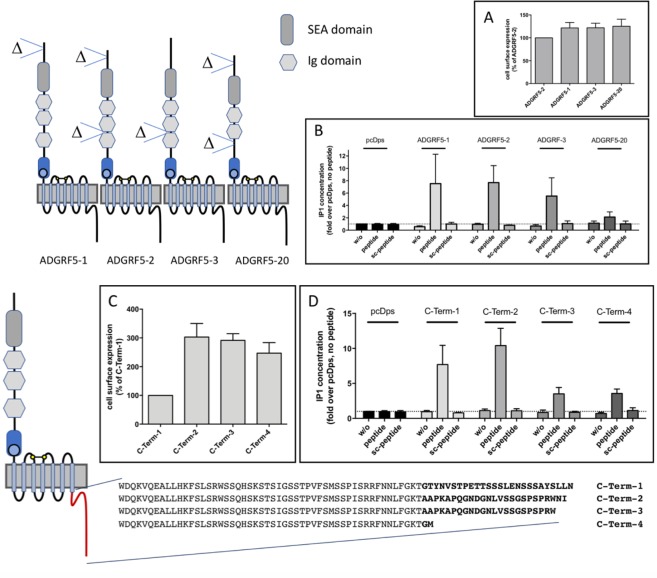
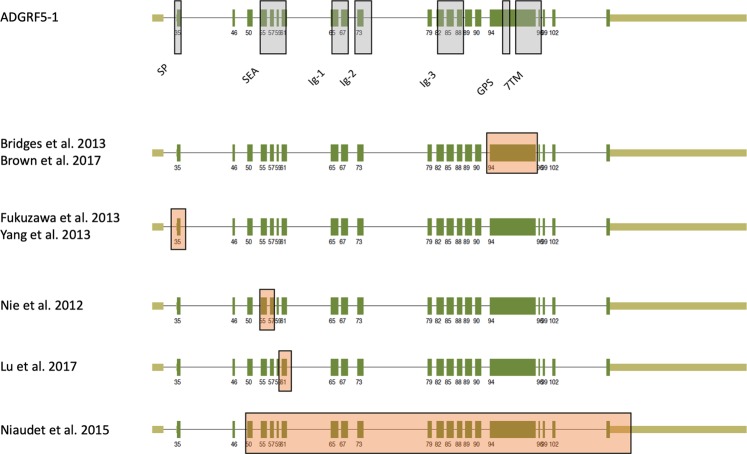
The enormous sizes of adhesion G protein-coupled receptors (aGPCRs) go along with complex genomic exon-intron architectures giving rise to multiple mRNA variants. There is a need for a comprehensive catalog of aGPCR variants for proper evaluation of the complex functions of aGPCRs found in structural, in vitro and animal model studies. We used an established bioinformatics pipeline to extract, quantify and visualize mRNA variants of aGPCRs from deeply sequenced transcriptomes. Data analysis showed that aGPCRs have multiple transcription start sites even within introns and that tissue-specific splicing is frequent. On average, 19 significantly expressed transcript variants are derived from a given aGPCR gene. The domain architecture of the N terminus encoded by transcript variants often differs and N termini without or with an incomplete seven-helix transmembrane anchor as well as separate seven-helix transmembrane domains are frequently derived from aGPCR genes. Experimental analyses of selected aGPCR transcript variants revealed marked functional differences. Our analysis has an impact on a rational design of aGPCR constructs for structural analyses and gene-deficient mouse lines and provides new support for independent functions of both, the large N terminus and the transmembrane domain of aGPCRs.


Conflict of interest statement

The authors declare no competing interests.

Figures

Figure 1
Figure 1
Output and visualization of ADGRF5/GPR116 transcript variants. The genomic locus of Adgrf5/Gpr116 is shown with its longest exons (large blue boxes) and size-condensed introns (faint blue lines). All exons found in the analysis are separately plotted above the locus (small blue boxes). The individual exon arrangements of transcripts are shown and numbered (e.g. ADGRF5-1). Transcripts were defined as a numeric sequence of exons (e.g. ADGRF5-1: exons 35, 46, 50 …). The longest bona fide open reading frames (ORF) are depicted in thick green boxes while the non-protein coding 5′ and 3′ UTRs are displayed thinner and in light green. 5′ start exons with minor differences in the transcription start site (TSS) but identical 3′ splice donor sites are considered as one 5′ start exon. Significantly different TSS (e.g. variant ADGRF5-3 vs variant ADGRF5-4) may indicate different promoters. Similarly, 3′ end exons with minor differences in length but identical 5′ splice acceptor sites are considered as one 3′ end exon. Different composition of the 5′ start exon, 3′ end exon and/or exons are considered as individual variants. The abundance of each transcript is color-coded according to the legend above. For example, variants ADGRF5-1 and ADGRF5-2 are abundant in fat tissue whereas the variant ADGRF5-5 is below 1% of all Adgrf5/Gpr116 transcripts in fat tissue or does not exist. The exact positions of the exons forming the variants are given in suppl. Table S3 and can also be visualized with genome browsers (e.g. https://software.broadinstitute.org/software/igv/download) using the provided file (Knierim et al. Suppl browser.bed). Exons, already annotated in NCBI are given in suppl. Table S3). *The variants ADGRF5-4 (XM_006524127.3, XM_006524129.2), ADGRF5-5 (XM_006524128.3), ADGRF5-11 (XM_006524124.3), and ADGRF5-12 (XM_006524125.3) show identical exon combinations as previously annotated. The grey columns indicate regions where protein domains (signal peptide (SP), Sperm protein, Enterokinase and Agrin domain (SEA), Immunoglobulin-like domain (Ig), G protein-receptor Proteolytic Site (GPS), seven-Transmembrane Domain (7TM)) are encoded.
Figure 2
Figure 2
Putative (receptor) proteins resulting from Adgrf5/Gpr116 transcripts. The domain structure of proteins derived from abundant Adgrf5/Gpr116 mRNA variants (see Fig. 1) is schematically depicted. The C terminus of the receptor can also differ (red line). The exact positions of the exons forming the variants are given in suppl. Table S3.
Figure 3
Figure 3
Unequal distribution of read coverage at the GPR133 locus. (A) Analysis of Adgrd1/Gpr133 revealed seven main transcript variants in VAT. Interestingly, two transcripts driven from different promoters encode only for the NTF (ADGRD1-4) or for the CTF (ADGRD1-6). Read coverage analysis of the NTF- and CTF-encoding genomic locus (separated by a blue vertical line) included only positions where the coverage was >1% percentile (dotted red line) to exclude bias by rare exons. The coverage per bp of the CTF-encoding exons was significantly higher (1.3 fold, p < 0.0001) as of the NTF indicating a partially dissociated transcription of both segments. The red lines mark the mean coverage in the NTF- and CTF-encoding regions. (B) The variants ADGRD1-4, -6, -7 were generated and N- and/or C-terminally epitope-tagged with HA and FLAG tags, respectively, as indicated. In ADGRD1-4, exon 40 (A) is used leading to a frameshift with a premature stop. The resulting amino acid sequence which is different to ADGRD1-7 is given. In ADGRD1-6, an internal promoter drives transcription starting with the GAIN coding sequence. The first AUG of the mRNA determines an ORF starting within the Stachel sequence 7 amino acid positions downstream the GPS. (C) Constructs were transiently transfected into COS-7 cells and protein expression was visualized using a monoclonal anti-HA FITC-labeled antibody (N-terminal HA tag) or a monoclonal anti-FLAG antibody/polyclonal anti-mouse FITC-labeled antibody combination (C-terminal FLAG tag). Nuclei were stained with Hoechst 33342. Pictures were taken with a confocal microscope (Zeiss, LSM 700). Bars represent 10 µm. (D) Constructs were transiently transfected into COS-7 cells and cAMP levels were determined in the absence/presence of an ADGRD1/GPR133-activating peptide (pGPR133) dissolved in 0.5% DMSO. Basal cAMP of vector control (pcDps) was 4.3 ± 1.3 nM. Data are given as means ± S.E.M. of three independent assays performed in triplicate. SP, signal peptide; NTF, N-terminal fragment; GAIN domain, GPCR autoproteolysis-inducing domain; GPS, G-protein coupled receptor proteolytic site; 7TM, seven-transmembrane domain; CTF, C-terminal fragment; TM transmembrane helix.
Figure 4
Figure 4
Exon-intron architecture of the 7TM-encoding genomic region of aGPCR and its implication in aGPCR phylogeny. (A) Based on our mRNA variant analysis and publicly available genomic data the exon-intron structure of aGPCR groups is schematically presented. Alternating dark and light blue boxes represent GPS- and 7TM-encoding exons which are interrupted by introns. (B) The evolutionary history of vertebrate aGPCRs (human, mouse, chicken, zebrafish orthologs) was inferred by using the Maximum Likelihood method based on the JTT matrix-based model. Thus, the 7TM domain of human, mouse, chicken, and zebrafish aGPCR orthologs were aligned and the tree with the highest log likelihood (-21466.21) is shown. Rhodopsin was used as outgroup. Initial tree(s) for the heuristic search were obtained automatically by applying Neighbor-Join and BioNJ algorithms to a matrix of pairwise distances estimated using a JTT model, and then selecting the topology with superior log likelihood value. The tree is drawn to scale, with branch lengths measured in the number of substitutions per site (next to the branches). The analysis involved 133 amino acid sequences. All positions containing gaps and missing data were eliminated. There were a total of 170 positions in the final dataset. Evolutionary analyses were conducted in MEGA7.
Figure 5
Figure 5
Functional impact of N- and C terminus length variations in mouse ADGRF5/GPR116. Splice variant analysis of Adgrf5/Gpr116 revealed several variations of the N- and C terminus lengths. Selected variants were tested in respect to their cell surface expression and signal transduction properties. The common N-terminal variants ADGRF5-1-3, a rare variant that lacks the third Ig domain (ADGRF5-20, suppl. Table S3 Adgrf5/Gpr116 variant fat 2_6) and the empty vector (pcDps) were tested in (A) cell surface expression ELISA and (B) inositol phosphate (IP1) assays. In IP1 assays the variants were analyzed without (w/o) and with the Stachel peptide of GPR116 (1 mM) or a scrambled peptide as control (1 mM). Similarly, four selected mouse GPR116 variants differing in their C-terminus lengths were tested. C-Term-1 and C-Term-2 correspond to ADGRF5-1-9, -15, -18, -19 and ADGRF5-10, -13, -14, -16, -17 of Fig. 2, respectively. C-Term-3 and C-Term-4 were rare splice variants (<1% of all GPR116 transcripts) in the data sets we analyzed. (C) Cell surface expression (ELISA) and (D) agonist-induced inositol phosphate (IP1) accumulation assays were performed. Data are given as means ± S.E.M. ELISA OD pcDps: 0.006 ± 0.003 (N-Term) and 0.008 ± 0.004 (C-Term), AGDRF5-2: 0.120 ± 0.021, C-Term-1: 0.105 ± 0.023; as positive control (not shown) the HA-tagged ADP receptor P2RY12 showed an OD value of 0.322 ± 0.041. IP1: pcDps w/o: 215 ± 37 nM, n ≥ 4 (C-Term) and n ≥ 5 (N-Term).
Figure 6
Figure 6
Adgrf5/Gpr116 locus targeted in mouse lines. There are several mouse lines in which the GPR116/ADGRF5 locus was targeted disrupting individual exons,–. The exon and domain annotation of ADGRF5-1 is taken from Fig. 1. Orange boxed exons mark the deletion in the different mouse lines.

References

    1. Liebscher I, Schoneberg T, Promel S. Progress in demystification of adhesion G protein-coupled receptors. Biol Chem. 2013;394:937–950. doi: 10.1515/hsz-2013-0109. - DOI - PubMed
    1. Hamann J, et al. International Union of Basic and Clinical Pharmacology. XCIV. Adhesion G protein-coupled receptors. Pharmacol Rev. 2015;67:338–367. doi: 10.1124/pr.114.009647. - DOI - PMC - PubMed
    1. Liebscher I, Monk KR, Schoneberg T. How to wake a giant. Oncotarget. 2015;6:23038–23039. doi: 10.18632/oncotarget.5112. - DOI - PMC - PubMed
    1. Bohnekamp J, Schoneberg T. Cell adhesion receptor GPR133 couples to Gs protein. J Biol Chem. 2011;286:41912–41916. doi: 10.1074/jbc.C111.265934. - DOI - PMC - PubMed
    1. Liebscher I, et al. A tethered agonist within the ectodomain activates the adhesion G protein-coupled receptors GPR126 and GPR133. Cell Rep. 2014;9:2018–2026. doi: 10.1016/j.celrep.2014.11.036. - DOI - PMC - PubMed

Publication types

LinkOut - more resources