. 2019 Aug;121(5):384-394.
doi: 10.1038/s41416-019-0538-y. Epub 2019 Jul 31.

EZH2 cooperates with E2F1 to stimulate expression of genes involved in adrenocortical carcinoma aggressiveness

Affiliations

EZH2 cooperates with E2F1 to stimulate expression of genes involved in adrenocortical carcinoma aggressiveness

Houda Tabbal et al. Br J Cancer. 2019 Aug.

Abstract

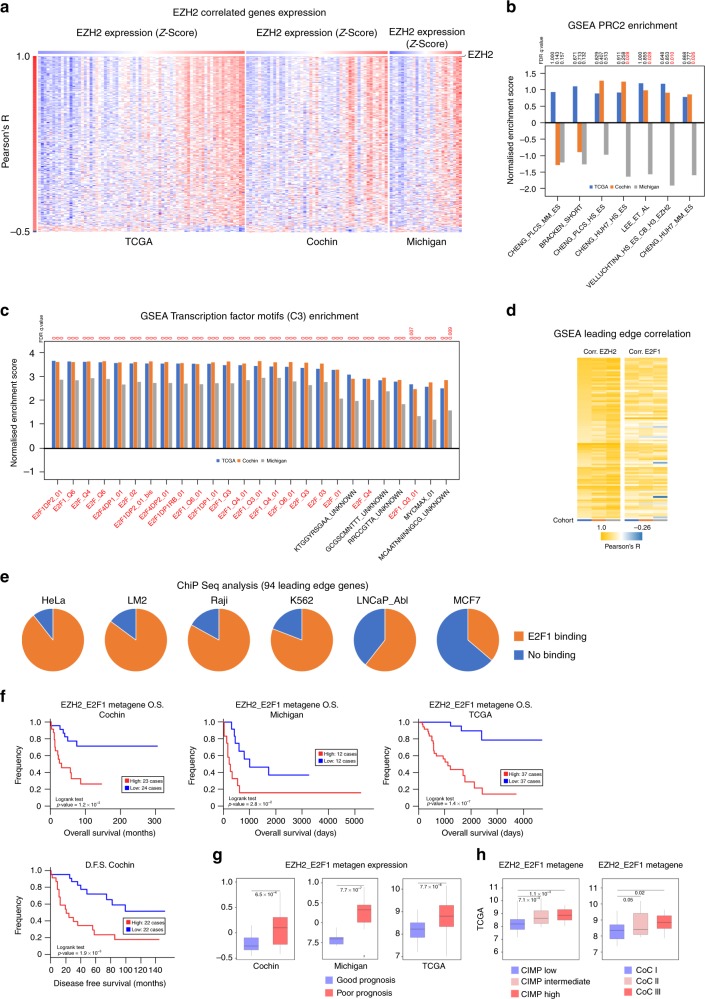
Background: EZH2 is overexpressed and associated with poor prognosis in adrenocortical carcinoma (ACC) and its inhibition reduces growth and aggressiveness of ACC cells in culture. Although EZH2 was identified as the methyltransferase that deposits the repressive H3K27me3 histone mark, it can cooperate with transcription factors to stimulate gene transcription.

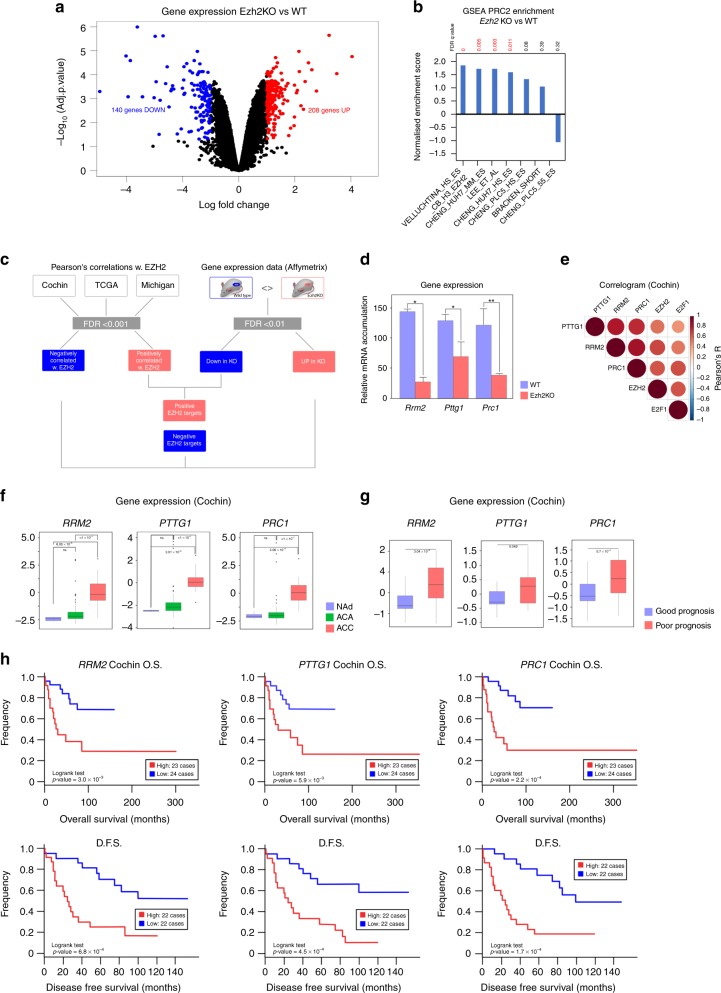
Methods: We used bioinformatics approaches on gene expression data from three cohorts of patients and a mouse model of EZH2 ablation, to identify targets and mode of action of EZH2 in ACC. This was followed by ChIP and functional assays to evaluate contribution of identified targets to ACC pathogenesis.

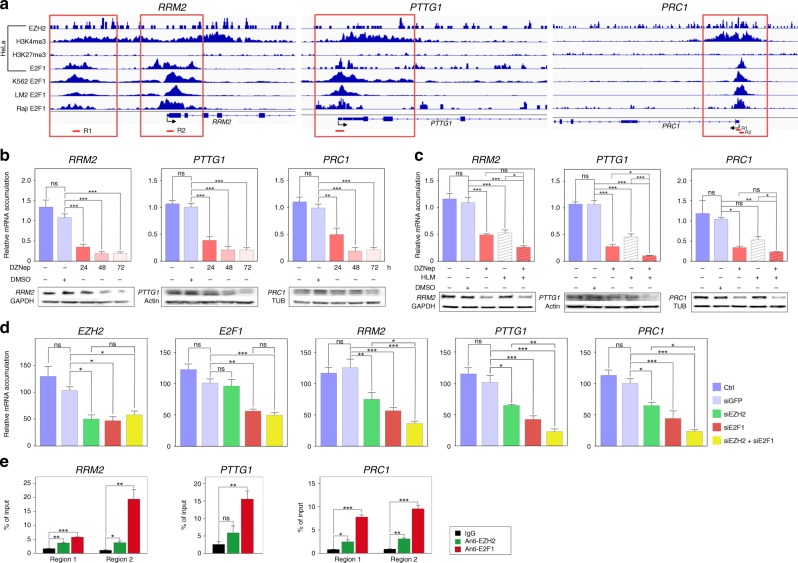
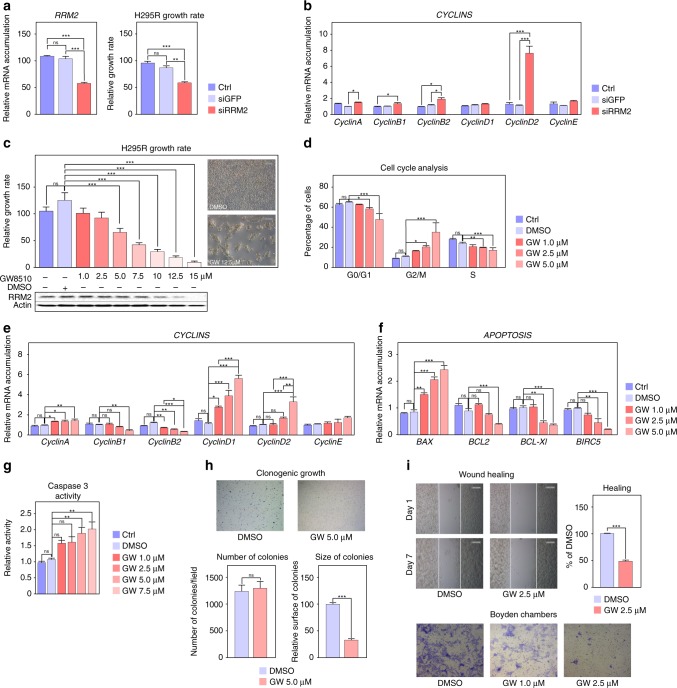
Results: We show that EZH2 mostly works as a transcriptional inducer in ACC, through cooperation with the transcription factor E2F1 and identify three positive targets involved in cell cycle regulation and mitosis i.e., RRM2, PTTG1 and ASE1/PRC1. Overexpression of these genes is associated with poor prognosis, suggesting a potential role in acquisition of aggressive ACC features. Pharmacological and siRNA-mediated inhibition of RRM2 blocks cell proliferation, induces apoptosis and inhibits cell migration, suggesting that it may be an interesting target in ACC.

Conclusions: Altogether, these data show an unexpected role of EZH2 and E2F1 in stimulating expression of genes associated with ACC aggressiveness.


Conflict of interest statement

The authors declare no competing interests.

Figures

Fig. 1
Fig. 1
EZH2 may act as a transcriptional activator through potential cooperation with E2F1 in ACC. a Heatmap showing levels of expression of the genes with highest Pearson’s correlation with EZH2 (FDR < 0.001) in transcriptomes of three ACC cohorts (TCGA, Cochin, Michigan). Patients (columns) are organised according to increasing EZH2 expression shown as a z-score (from blue, low expression, to red, high expression). Genes (lines) are organised by decreasing Pearson’s R coefficient. b Correlation coefficients with EZH2 were used in a pre-ranked Gene set enrichment analysis (GSEA) to evaluate the presence of PRC2 targets in the genes correlated with EZH2. Curated lists of PRC2 targets were described in. c Correlation coefficients with EZH2 were used in a pre-ranked GSEA analysis to identify putative transcription factors binding sites in the promoters of the genes correlated with EZH2. Only gene sets with FDR < 0.01 were selected. Gene sets were extracted from MSigDB C3, which contains gene sets defined by the presence of putative transcription factor binding sites within their regulatory regions. d Genes constituting the leading edges of the 21 ‘E2F’ gene sets were extracted and intersected to build an EZH2/E2F core list of 94 genes. Their correlation coefficients with EZH2 and E2F1 were computed in the three cohorts of patients and represented as a heatmap. Columns represent the three cohorts, line represent correlation coefficients for each gene. e The capacity of E2F1 to bind to the regulatory regions (±2 kb from TSS) of the 94 leading edge genes was analysed in publically available E2F1 ChIP sequencing data obtained from six different cell lines. Pie charts represent the proportion of genes with (orange) or without (blue) E2F1 binding. f Patients’ overall survival (Cochin, Michigan, TCGA) and disease-free survival (Cochin) was analysed as a function of the mean expression of the 94 genes (EZH2_E2F1 metagene) by the Kaplan–Meier method. Statistical significance was evaluated by the Logrank test. g Expression of the metagene in ACC in the groups of good (blue) and poor prognosis (red). Statistical significance was evaluated by Wilcoxon’s test. h Expression of the metagene in ACC classified as CIMP low/intermediate/high and in clusters of clusters I, II and III. Statistical significance was evaluated by ANOVA
Fig. 2
Fig. 2
Identification of EZH2 target genes. a Differential gene expression was evaluated by micro-array analysis in a mouse model of adrenal-specific inactivation of Ezh2, compared with wild-type mice. Volcano plot represents Log Fold Change and –Log10 of adjusted p-value (FDR) for four knockout compared with three wild-type adrenals. Red dots show genes significantly up-regulated in knockout compared with wild-type adrenals. Blue dots show genes significantly down-regulated in knockout compared with wild-type adrenals. b GSEA evaluation of PRC2 targets enrichment in differentially expressed genes. c Strategy for identification of EZH2 targets in ACC by intersection of patients’ correlation data with mouse gene expression data. d Expression levels of the three identified positive target genes (RRM2, PTTG1, PRC1) were determined by RTqPCR in eight wild-type and eight Ezh2 knockout adrenals. Bars represent the mean ± SEM. Statistical analysis was conducted by Wilcoxon’s test. *p < 0.05, **p < 0.01 e Correlogram shows correlation of expression of RRM2, PTTG1 and PRC1 with expression of EZH2 and E2F1 in Cochin’s cohort. f Expression of RRM2, PTTG1 and PRC1 in normal adrenals, adrenocortical adenomas and adrenocortical carcinomas. Significance was evaluated by ANOVA. g Expression of RRM2, PTTG1 and PRC1 in the groups of good (blue) and poor (red) prognosis in Cochin’s cohort. Significance was evaluated by Wilcoxon’s test. h Overall (O.S) and disease-free (D.F.S) survival as a function of RRM2, PTTG1 and PRC1 expression in Cochin’s cohort. Statistical significance was evaluated by the Logrank test
Fig. 3
Fig. 3
EZH2 and E2F1 cooperate to up-regulate expression of RRM2, PTTG1 and PRC1 in ACC. a Graphical representation of enrichment for EZH2, H3K4me3, H3K27me3 and E2F1 on the regulatory regions of RRM2, PTTG1 and PRC1 in HeLa, K562, LM2 and Raji cells. Red boxes show regions with EZH2, E2F1 and H3K4me3 enrichment, in absence of H3K27me3. Regions amplified by qPCR in e are shown as red segments under graphical representations. b Effect of 5 µM DZNep treatment for 24, 48 and 72 h on expression of RRM2, PTTG1 and PRC1 was evaluated by RTqPCR (graphs) and western blot (bottom panels) in H295R cells. c Effect of DZNep and/or HLM treatment for 48 h on expression of RRM2, PTTG1 and PRC1 was evaluated by RTqPCR (graphs) and western blot (bottom panels) in H295R cells. d Effect of EZH2 and/or E2F1 knockdown on expression of RRM2, PTTG1 and PRC1 was evaluated by RTqPCR after transfection of siRNAs targeting EZH2 and/or E2F1 in H295R cells. e Binding of EZH2 and E2F1 to the regulatory regions of RRM2, PTTG1 and PRC1 was evaluated by ChIP qPCR in H295R cells. Data are expressed as percent of enrichment over chromatin input. IgG were included as negative control. In bd graphs represent the mean of five independent experiments ± SEM. In e, graphs represent the mean of three independent IP experiments ± SEM. Significance was evaluated by ANOVA in be. *p < 0.05, **p < 0.01, ***p < 0.001
Fig. 4
Fig. 4
Inhibition of RRM2 reduces H295R cells growth and aggressiveness. a Effect of siRNA-mediated knockdown of RRM2 on RRM2 expression (left panel) and H295R cells growth after five days. b Effect of siRNA-mediated knockdown of RRM2 on expression of Cyclin coding genes in H295R cells was evaluated by RTqPCR. c Effect of pharmacological inhibition of RRM2 on the growth of H295R cells was determined by counting live cells after 5 days of treatment with increasing amounts of GW8510. Bottom panel shows RRM2 accumulation following GW8510 treatment. Representative images were taken at the end of treatment. d Effect of pharmacological inhibition of RRM2 on H295R cell cycle was determined by FACS following propidium iodide incorporation after 2 days of treatment with increasing amounts of GW8510. e Effect of RRM2 inhibition on expression of Cyclin coding genes in H295R cells was evaluated by RTqPCR. f Effect of RRM2 inhibition on expression of apoptosis-related genes in H295R cells was evaluated by RTqPCR. g Caspase 3 activity in H295R cells was determined after 1 day of GW8510 treatment at increasing concentrations. h Effect of RRM2 inhibition on clonogenic cell growth was determined by growing H295R cells in soft agar for 21 days in the presence or absence of 5 µM GW8510. Number and sizes of colonies were determined using Image J. i Effect of RRM2 inhibition on cell migration was determined by wound healing assays (top panel) in the absence or presence of 2.5 µM GW8510 for 7 days. For Boyden chambers migration assays (bottom panel) cells were incubated for 48h with two doses of GW8510 and migrating cells were stained with Haematoxylin. Graphs in ag represent the mean of four experiments ± SEM. Statistical significance in these panels was evaluated by ANOVA. *p < 0.05, **p < 0.01, ***p < 0.001. Graphs in h, i represent the mean of three experiments ± SEM. Statistical significance was determined by Wilcoxon’s test
Fig. 5
Fig. 5
Combined effects of mitotane and RRM2 inhibition on H295R cells growth and aggressiveness. a Effect of pharmacological inhibition of RRM2 and/or mitotane treatment on the growth of H295R cells was determined by counting live cells after 5 days of treatment with two doses of GW8510 and/or mitotane. Representative images were taken at the end of treatment. b Effect of pharmacological inhibition of RRM2 and/or mitotane treatment on expression of Cyclin coding genes in H295R cells was evaluated by RTqPCR. c Effect of pharmacological inhibition of RRM2 and/or mitotane treatment on H295R cell cycle was determined by FACS, following propidium iodide incorporation after 2 days of treatment with GW8510 and/or mitotane. d Effect of RRM2 inhibition and/or mitotane treatment on expression of apoptosis-related genes in H295R cells was evaluated by RTqPCR (left panel). Caspase 3 activity was determined after 1 day of treatment with  5 µM  GW8510 and/or 10 µM mitotane (right panel). e Effect of GW8510 and/or mitotane on cell migration was determined by wound healing assays in the absence or presence of 2.5 µM GW8510 and/or 10 µM Mitotane for 7 days. Graphs in a-e represent the mean of four experiments ± SEM. Statistical significance was determined by ANOVA. *p < 0.05, **p < 0.01, ***p < 0.001

Similar articles

Cited by

References

    1. Libé R. Adrenocortical carcinoma (ACC): diagnosis, prognosis, and treatment. Front Cell Dev. Biol. 2015;3:45. doi: 10.3389/fcell.2015.00045. - DOI - PMC - PubMed
    1. Assié G, Letouzé E, Fassnacht M, Jouinot A, Luscap W, Barreau O, et al. Integrated genomic characterization of adrenocortical carcinoma. Nat. Genet. 2014;46:607–612. doi: 10.1038/ng.2953. - DOI - PubMed
    1. Zheng S, Cherniack AD, Dewal N, Moffitt RA, Danilova L, Murray BA, et al. Comprehensive pan-genomic characterization of adrenocortical carcinoma. Cancer Cell. 2016;29:723–736. doi: 10.1016/j.ccell.2016.04.002. - DOI - PMC - PubMed
    1. Batisse-Lignier M, Sahut-Barnola I, Tissier F, Dumontet T, Mathieu M, Drelon C, et al. P53/Rb inhibition induces metastatic adrenocortical carcinomas in a preclinical transgenic model. Oncogene. 2017;36:4445–4456. doi: 10.1038/onc.2017.54. - DOI - PubMed
    1. Drelon C, Berthon A, Val P. Adrenocortical cancer and IGF2: is the game over or our experimental models limited? J. Clin. Endocrinol. Metab. 2013;98:505–507. doi: 10.1210/jc.2012-3310. - DOI - PubMed

Publication types

MeSH terms