. 2019 Sep 1;142(9):2705-2721.
doi: 10.1093/brain/awz209.

Circuit-based interventions in the dentate gyrus rescue epilepsy-associated cognitive dysfunction

Affiliations

Circuit-based interventions in the dentate gyrus rescue epilepsy-associated cognitive dysfunction

Julia B Kahn et al. Brain. .

Abstract

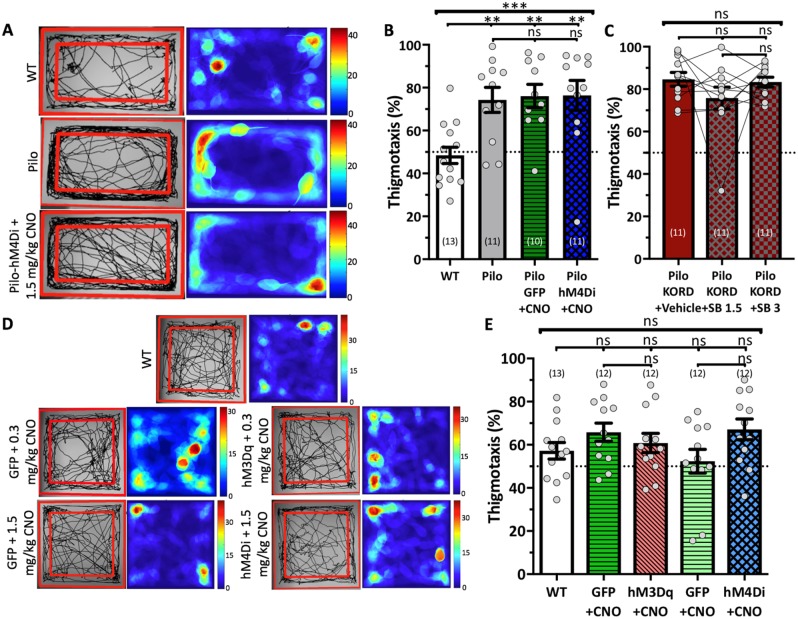
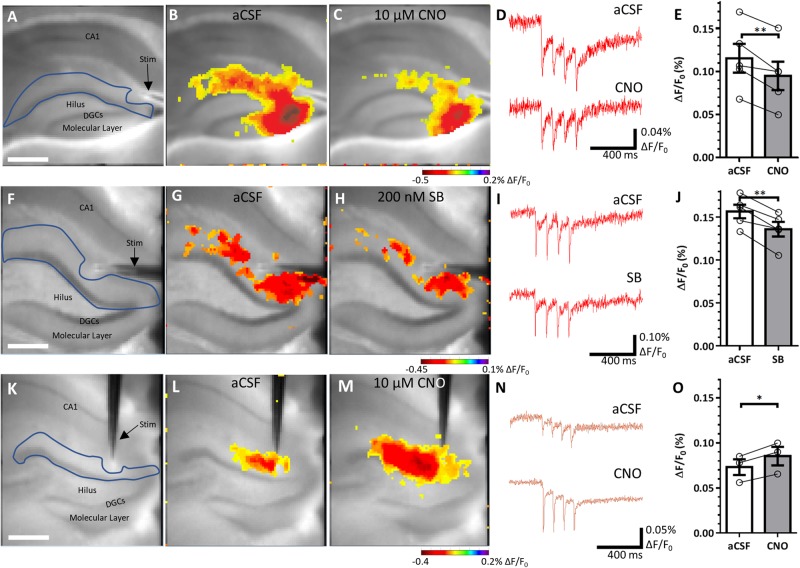
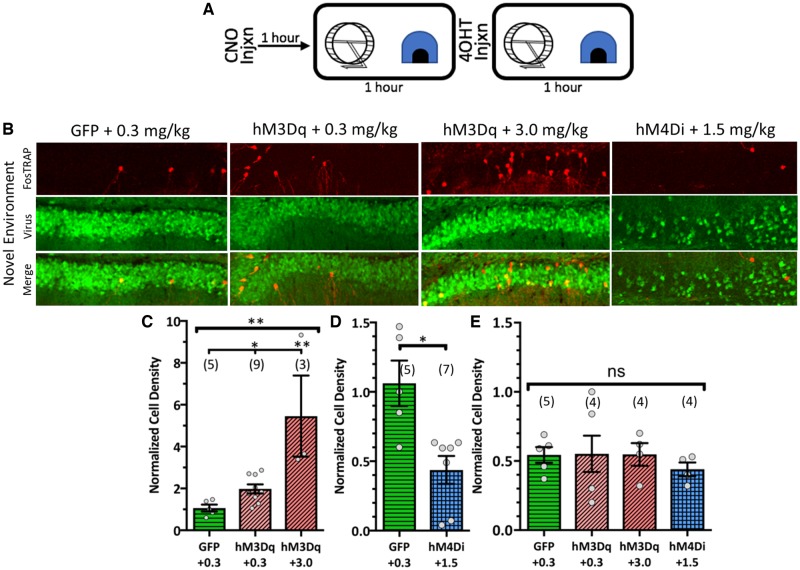
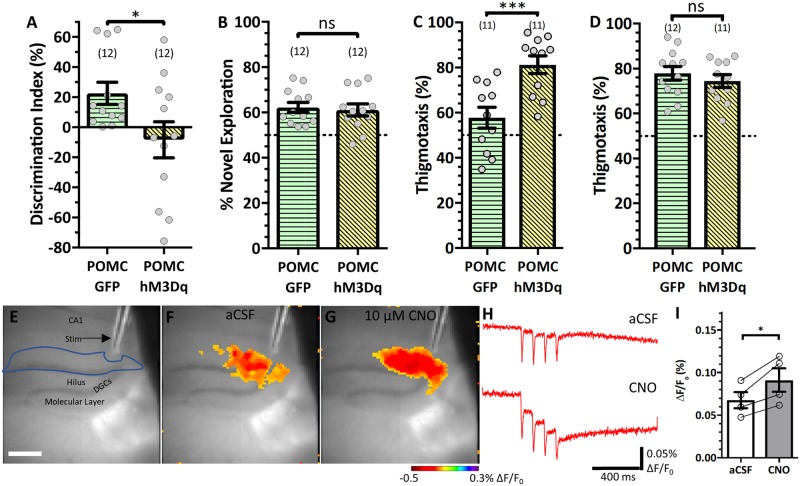
Temporal lobe epilepsy is associated with significant structural pathology in the hippocampus. In the dentate gyrus, the summative effect of these pathologies is massive hyperexcitability in the granule cells, generating both increased seizure susceptibility and cognitive deficits. To date, therapeutic approaches have failed to improve the cognitive symptoms in fully developed, chronic epilepsy. As the dentate's principal signalling population, the granule cells' aggregate excitability has the potential to provide a mechanistically-independent downstream target. We examined whether normalizing epilepsy-associated granule cell hyperexcitability-without correcting the underlying structural circuit disruptions-would constitute an effective therapeutic approach for cognitive dysfunction. In the systemic pilocarpine mouse model of temporal lobe epilepsy, the epileptic dentate gyrus excessively recruits granule cells in behavioural contexts, not just during seizure events, and these mice fail to perform on a dentate-mediated spatial discrimination task. Acutely reducing dorsal granule cell hyperactivity in chronically epileptic mice via either of two distinct inhibitory chemogenetic receptors rescued behavioural performance such that they responded comparably to wild type mice. Furthermore, recreating granule cell hyperexcitability in control mice via excitatory chemogenetic receptors, without altering normal circuit anatomy, recapitulated spatial memory deficits observed in epileptic mice. However, making the granule cells overly quiescent in both epileptic and control mice again disrupted behavioural performance. These bidirectional manipulations reveal that there is a permissive excitability window for granule cells that is necessary to support successful behavioural performance. Chemogenetic effects were specific to the targeted dorsal hippocampus, as hippocampal-independent and ventral hippocampal-dependent behaviours remained unaffected. Fos expression demonstrated that chemogenetics can modulate granule cell recruitment via behaviourally relevant inputs. Rather than driving cell activity deterministically or spontaneously, chemogenetic intervention merely modulates the behaviourally permissive activity window in which the circuit operates. We conclude that restoring appropriate principal cell tuning via circuit-based therapies, irrespective of the mechanisms generating the disease-related hyperactivity, is a promising translational approach.

Keywords: chemogenetics; circuit-based therapy; cognitive deficits; dentate gyrus; temporal lobe epilepsy.


Figures

Figure 1
Figure 1
Epileptic animals have hyperactive DGCs. (A) Schematic of FosTRAP × tdTomato mechanism. Fos drives expression of CreERT so that tdTomato expression only occurs when tamoxifen or its metabolite 4OHT is present to remove the stop codon. (B) Schematic of novel environment protocol. (C) Confocal micrographs of tdTomato expression overlaid the transmitted image to show TRAPed DGCs in control mice (left), epileptic mice (middle), and epileptic mice that displayed seizure-related behaviours while the 4OHT was onboard (right). Scale bar = 318 µm. (D) Cell density analysis per animal normalized to the control group’s mean. Epileptic animals 2–3 months post-status epilepticus recruit significantly more DGCs after exposure to a novel environment [t(4.284) = 11.53, ***P = 0.0002, Welch’s t-test]. Data are represented as mean ± SEM. Each circle represents an animal (number of animals indicated in parentheses).
Figure 2
Figure 2
Reducing DGC hyperactivity via inhibitory DREADDs rescues performance. (A) Schematic of SOR task. (B) Representative images of SOR exploration for a wild-type (top) and a pilocarpine (bottom) mouse during their third training trial and their test trial. Background images show the object configuration with the displaced object marked in red for the test trial. Tracking images show the mouse’s total exploration during the trial with the total interaction time with each object quantified in the green boxes. The object interaction bouts images are heat maps of the cumulative time (s) the animal spent in each location when it was interacting with an object. The wild-type mouse shows an increased preference for the displaced object during its test trial while the Pilo mouse does not. (C) Quantified SOR performance showing that hM4Di recruitment rescues discrimination performance in epileptic mice [F(3,46) = 8.388, P = 0.0001, one-way ANOVA with Tukey’s multiple comparisons correction]. CNO = 1.5 mg/kg. (D and E) Representative confocal micrographs of the fluorescent reporter co-expressing with the viral vectors. (D) Micrographs (4×) showing viral expression was localized to the dentate gyrus. Scale bar = 500 µm. (E) Micrographs (10×) of reporter for the CamKIIα-GFP (left) and CamKIIα-hM4Di (right). Scale bar = 200 µm. Data are represented as mean ± SEM. Each circle represents an animal (number of animals indicated in parentheses). nsP > 0.05, *P < 0.05, **P < 0.01, ***P < 0.001.
Figure 3
Figure 3
DGC tuning dictates SOR performance. (A) Schematic of SOR task with drug treatment timeline. (B and C) SOR performance. (B) Pilo+KORD mice were tested on SOR under multiple treatment conditions. SB at 1.5 mg/kg rescued performance while 3 mg/kg SB compromised performance [F(1.29,12.91) = 4.759, P = 0.041, repeated measures one-way ANOVA with Geisser-Greenhouse’s correction and Tukey’s multiple comparisons correction]. (C) Decreasing [left, CNO = 1.5 mg/kg, t(22) = 2.991, P = 0.007, Student’s t-test] or increasing [right, CNO = 0.3 mg/kg, t(22) = 2.893, P = 0.008, Student’s t-test] DGC activity in control animals disrupted discrimination. (D) Representative confocal micrographs (10 x) of fluorescent reporter co-expressing with the CamKIIα-GFP (left), CamKIIα-KORD (middle left), CamKIIα-hM4Di (middle right), and CamKIIα-hM3Dq (right) viral vectors. Scale bar = 200 µm. Data are represented as mean ± SEM. Each circle represents an animal (number of animals indicated in parentheses). nsP > 0.05, *P < 0.05, **P < 0.01.
Figure 4
Figure 4
DREADD effects are specific to the hippocampus. DREADD manipulations of the dentate gyrus in epileptic and control animals do not affect novel object recognition performance, showing DREADD effects are structurally specific. (A) Schematic of task. (B) Representative images of exploration for a wild-type (top) and a pilocarpine (bottom) mouse during their test trial. Background images show the object configuration with the novel object marked in red. Tracking images show the mouse’s total exploration during the trial with the total interaction time with each object quantified in the green boxes. The object interaction bouts images are heat maps of the cumulative time (s) the animal spent in each location when it was interacting with an object. The wild-type mouse shows an increased preference for the novel object while the Pilo mouse does not differentiate. (C) While Pilo mice display a deficit on the task compared to wild-type (WT) mice, DREADDs do not affect task performance [F(4,56) = 4.234, P = 0.005, one-way ANOVA with Tukey’s multiple comparisons correction]. CNO (1.5 mg/kg) or SB (3 mg/kg) were administered before the training and test trials. (D) DREADDs do not affect task performance in control mice [left, t(22) = 0.1066, P = 0.916, Student’s t-test; right, t(22) = 0.7774, P = 0.445, Student’s t-test]. Control mice received saline before the training trial and CNO (left, 0.3 mg/kg; right, 1.5 mg/kg) before the test trial. Data are represented as mean ± SEM. Each circle represents an animal (number of animals indicated in parentheses). nsP > 0.05, *P < 0.05, **P < 0.01.
Figure 5
Figure 5
DREADD effects are regionally specific within the hippocampus. DREADDs do not affect behavioural measures of anxiety, showing dorsal hippocampal specificity. (A) Representative images of open field analysis performed on the SOR habituation trial. Left images show ambulation tracking with boundary for anxiety analysis. Right images show heat maps of ambulation tracking depicting the cumulative time (s) the animal spent in each location. (B and C) Thigmotaxis analysis. While epileptic animals display anxiogenic behaviour, DREADDs do not affect performance [B: F(3,41) = 7.011, P = 0.0006; C: F(1.30, 12.96) = 1.502, P = 0.251]. (D) Representative images of open field analysis for control animals in a novel open field arena with their respective CNO doses. (E) Thigmotaxis analysis [F(4,56) = 1.769, P = 0.148]. Statistical comparisons were done with either an ordinary one-way ANOVA (B and E) or a repeated measures one-way ANOVA with Geisser-Greenhouse correction (C), all with Tukey’s multiple comparisons correction. Data are represented as mean ± SEM. Each circle represents an animal (number of animals indicated in parentheses). nsP > 0.05, *P < 0.05, **P < 0.01, ***P < 0.001. WT = wild-type.
Figure 6
Figure 6
Voltage sensitive dye imaging confirms DREADD-mediated changes in activity. (A) Representative micrograph from the CCD camera of the recording setup and analysis region of interest in blue. Scale bar = 425 µm. (B and C) Per cent ΔF/F0 maximal response of the hM4Di-expressing epileptic slice in artificial CSF (aCSF) (B) and in 10 µM CNO (C). (D) Representative traces of ΔF/F0 (%) in artificial CSF and CNO. (E) Quantified ΔF/F0 (%) in aCSF and in CNO [t(4) = 4.768, P = 0.009]. FJ are comparable to AE, examining KORD effects in epileptic tissue. (J) Quantified ΔF/F0 (%) in artificial CSF and in 200 nM SB [t(4) = 6.186, P = 0.004]. KO are comparable to AE, examining hM3Dq effects in control tissue. (O) Quantified ΔF/F0 (%) in artificial CSF and in 10 µM CNO [t(2) = 7.652, P = 0.017]. Statistical comparisons are two-tailed paired t-tests. Data are represented as mean ± SEM. Each circle represents an animal (each circle indicates the mean of two to three slices for a given animal). *P < 0.05, **P < 0.01.
Figure 7
Figure 7
FosTRAP confirms behavioural relevance of DREADDs and lack of seizures. (A) Schematic of novel environment procedure. (B) Confocal micrographs showing the FosTRAPed DGCs, viral expression, and the merge at each condition + CNO dose. (CE) Cell density results, normalized to the GFP-expressing group in C. (C) Normalized cell density results quantifying the effect of different CNO doses on hM3Dq-mediated DGC recruitment [H(3, 17) = 9.816, P = 0.002, Kruskal-Wallis test with Dunn’s multiple comparisons correction]. (D) Normalized cell density results quantifying the effect of hM4Di on DGC recruitment [t(10) = 2.637, P = 0.025, Student’s t-test]. Note that the GFP group in D is the same data repeated from C. (E) Home cage normalized cell density analysis to examine spontaneous activity the DREADDs may recruit [F(3,13) = 0.2708, P = 0.845, one-way ANOVA]. Data are represented as mean ± SEM. Each circle represents an animal (number of animals indicated in parentheses) nsP > 0.05, *P < 0.05, **P < 0.01.
Figure 8
Figure 8
Selectively activating DGCs compromises SOR. POMC-Cre mice were injected with either GFP or hM3Dq and received 0.3 mg/kg CNO 1 h prior to test trials throughout behavioural testing. (A) SOR performance [t(22) = 2.196, P = 0.039]. (B) Novel object recognition performance [t(22) = 0.3256, P = 0.748]. (C) Open field anxiety analysis [t(20) = 3.857, P = 0.001]. (D) SOR test trial anxiety analysis [t(20) = 0.8083, P = 0.428]. (E) Representative micrograph of voltage sensitive dye recording configuration in an hM3Dq-expressing slice. Scale bar = 425 µm. (F and G) ΔF/F0 (%) max response in artificial CSF (aCSF) (F) and 10 µM CNO (G). (H) Representative traces of ΔF/F0 in artificial CSF (top) and CNO (bottom). (I) Quantification of response to stimulation in the DGC+molecular layer [t(3) = 4.302, P = 0.023]; each circle represents the average of two to three slices per animal. Statistical comparisons were Student’s t-tests (AD) or two-tailed paired t-tests (I). Data are represented as mean ± SEM. Each circle represents an animal (number of animals indicated in parentheses). nsP > 0.05, *P < 0.05, **P < 0.01.

References

    1. Armbruster BN, Li X, Pausch MH, Herlitze S, Roth BL. Evolving the lock to fit the key to create a family of G protein-coupled receptors potently activated by an inert ligand. Proc Natl Acad Sci 2007; 104: 5163–8. - PMC - PubMed
    1. Bender RA, Soleymani S V, Brewster AL, Nguyen ST, Beck H, Mathern GW et al. . Enhanced expression of a specific hyperpolarization-activated cyclic nucleotide-gated cation channel (HCN) in surviving dentate gyrus granule cells of human and experimental epileptic hippocampus. J Neurosci 2003; 23: 6826–36. - PMC - PubMed
    1. Berg AT, Zelko FA, Levy SR, Testa FM. Age at onset of epilepsy, pharmacoresistance, and cognitive outcomes: a prospective cohort study. Neurology 2012; 79: 1384–91. - PMC - PubMed
    1. Bertram EH. Functional anatomy of spontaneous seizures in a rat model of limbic epilepsy. Epilepsia 1997; 38: 95–105. - PubMed
    1. Blumcke I, Suter B, Behle K, Kuhn R, Schramm J, Elger CE et al. . Loss of Hilar Mossy cells in ammon’s horn sclerosis. Epilepsia 2000; 41: S174–80. - PubMed

Publication types

MeSH terms