. 2019 Dec;138(6):987-1012.
doi: 10.1007/s00401-019-02049-1. Epub 2019 Jul 30.

Detrimental and protective action of microglial extracellular vesicles on myelin lesions: astrocyte involvement in remyelination failure

Affiliations

Detrimental and protective action of microglial extracellular vesicles on myelin lesions: astrocyte involvement in remyelination failure

Marta Lombardi et al. Acta Neuropathol. 2019 Dec.

Abstract

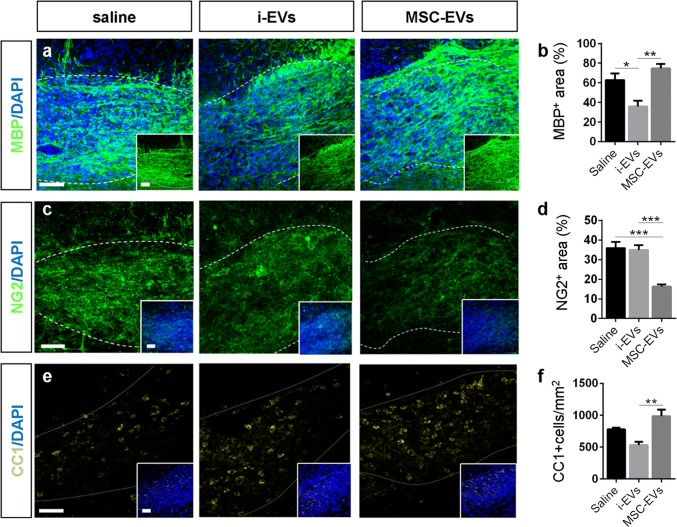
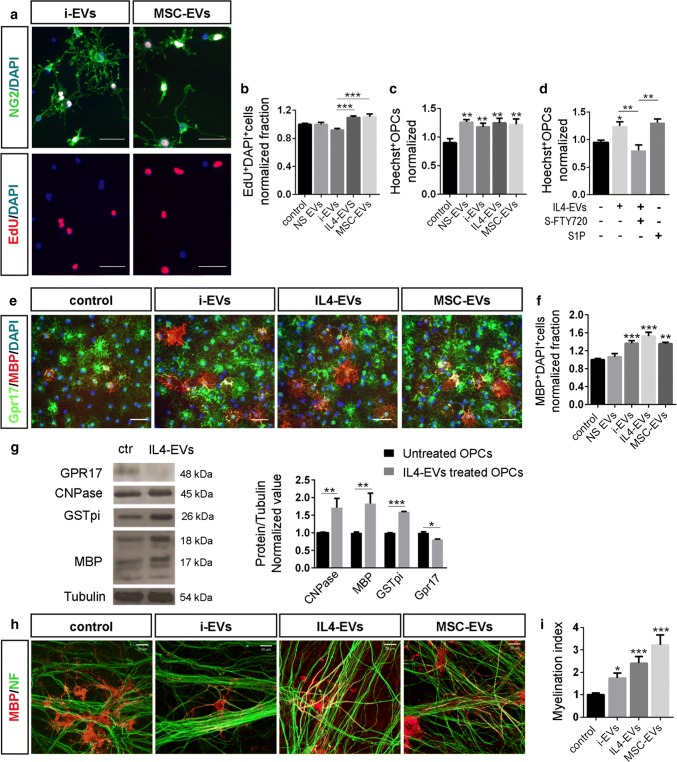
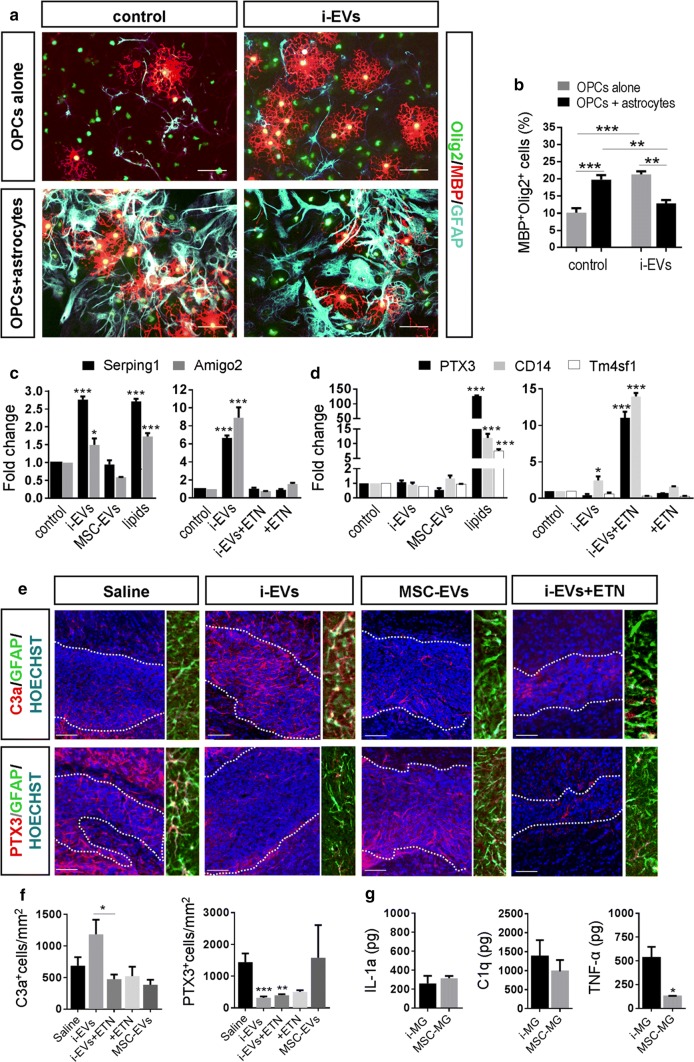
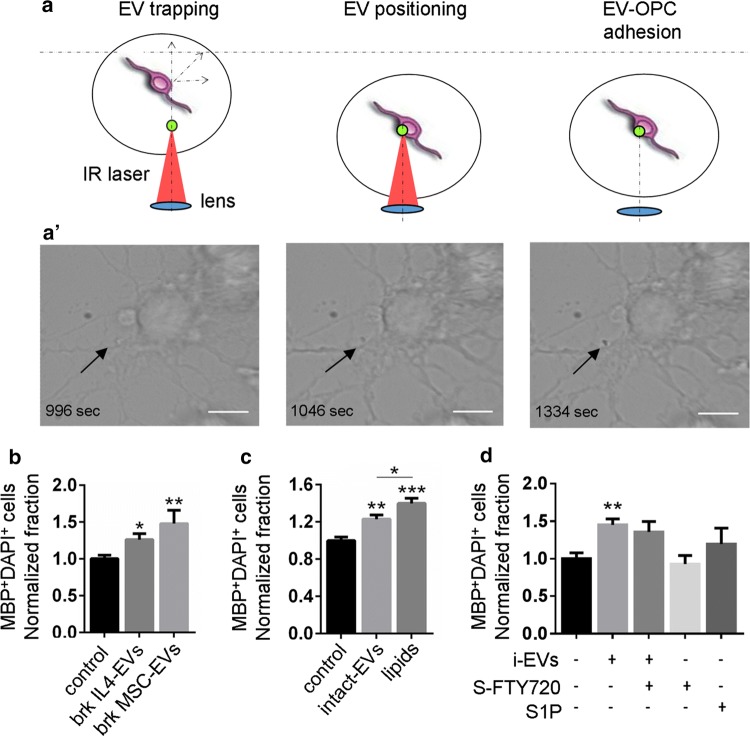
Microglia are highly plastic immune cells which exist in a continuum of activation states. By shaping the function of oligodendrocyte precursor cells (OPCs), the brain cells which differentiate to myelin-forming cells, microglia participate in both myelin injury and remyelination during multiple sclerosis. However, the mode(s) of action of microglia in supporting or inhibiting myelin repair is still largely unclear. Here, we analysed the effects of extracellular vesicles (EVs) produced in vitro by either pro-inflammatory or pro-regenerative microglia on OPCs at demyelinated lesions caused by lysolecithin injection in the mouse corpus callosum. Immunolabelling for myelin proteins and electron microscopy showed that EVs released by pro-inflammatory microglia blocked remyelination, whereas EVs produced by microglia co-cultured with immunosuppressive mesenchymal stem cells promoted OPC recruitment and myelin repair. The molecular mechanisms responsible for the harmful and beneficial EV actions were dissected in primary OPC cultures. By exposing OPCs, cultured either alone or with astrocytes, to inflammatory EVs, we observed a blockade of OPC maturation only in the presence of astrocytes, implicating these cells in remyelination failure. Biochemical fractionation revealed that astrocytes may be converted into harmful cells by the inflammatory EV cargo, as indicated by immunohistochemical and qPCR analyses, whereas surface lipid components of EVs promote OPC migration and/or differentiation, linking EV lipids to myelin repair. Although the mechanisms through which the lipid species enhance OPC maturation still remain to be fully defined, we provide the first demonstration that vesicular sphingosine 1 phosphate stimulates OPC migration, the first fundamental step in myelin repair. From this study, microglial EVs emerge as multimodal and multitarget signalling mediators able to influence both OPCs and astrocytes around myelin lesions, which may be exploited to develop novel approaches for myelin repair not only in multiple sclerosis, but also in neurological and neuropsychiatric diseases characterized by demyelination.

Keywords: Astrocytes; Extracellular vesicles; Mesenchymal stem cells; Microglia; Myelin lesion; S1P.


Figures

Fig. 1
Fig. 1
Microglia infiltrating the myelin lesion release EVs. EM images of the CC showing dark cells resembling microglia (a), oligodendrocytes (b) and astrocytes (b) infiltrating demyelinated lesion at 10 dpl. High magnification inserts in c show examples of EVs budding from the surface of dark microglia (scale bars 2 μm)
Fig. 2
Fig. 2
Production and characterization of EVs released by microglia with different activation states. a Scheme of microglia polarisation in vitro. b Gene expression of inflammatory markers (IL-1a, C1q, TNF-α, IL-1β and iNOS), pro-regenerative markers (Arg1 and Socs-3) and the metabolic gene Chpt1 in unstimulated microglia (NS-MG), IL-4-treated microglia (IL-4-MG) or microglia stimulated with inflammatory cytokines in the absence (i-MG) or in the presence of MSCs (MSC-MG) [number of independent experiments (n) = 7–11/group; Kruskal–Wallis test with Dunn’s multiple comparison *p < 0.05, **p < 0.01, ***p < 0.001. c Representative cryo-EM images of the heterogeneous population of microglial EVs in the 100 k g pellet. d Size profile of EVs pelleted from 1 × 106 microglia, re-suspended in 100 μl of 0.1 µm-filtered PBS and analysed using NTA (top). Histograms show production of EVs from NS or polarised microglia during 30 min stimulation with 1 mM ATP (bottom) (n = 4; one way ANOVA p = 0.2898 with Tukey’s multiple comparisons test]. e Mean Raman spectra obtained using 532 nm laser line from EVs of NS or polarized microglia. All spectra were baseline corrected, aligned and normalised before averaging. f Multivariate statistical analysis performed on the Raman spectra (n ≥ 30 per sample). The scatter plot represents the values obtained for the Canonical Variable 1 and Canonical Variable 2 after LDA. In the classification model, spectra from EVs were grouped based on the cell of origin to test RS ability to discriminate the molecular composition of EVs from different microglial phenotypes. The first 10 PC scores calculated by means of PCA were used for the LDA. Each dot represents a single spectrum
Fig. 3
Fig. 3
Action of EVs on early response to EVs. a Experimental design of EV delivery to LPC-treated mice during the phase of OPC recruitment. Histograms show the density of total proliferating cells (b) [number of animals (N) = 3–5/group; one-way ANOVA main effect of treatment p = 0.0021 with Holm–Sidak’s multiple comparisons test vs Saline] and the percentage of BrdU+ proliferating OPCs (c) (N = 3–5/group; one way ANOVA p = 0.0165 with Holm–Sidak’s multiple comparisons test vs Saline] in saline, i-EVs- IL4-EVs- or MSC-EVs-injected lesions. d Representative images of Saline, i-EVs, IL4-EVs or MSC-EVs-injected lesions (area delimited by dotted line) immunostained against Sox10 (red) (scale bars of images and insets, 50 μm). Low magnification inserts show Sox10/DAPI double staining to visualise nuclei. e Corresponding density of Sox10+ cells (histograms) (N = 3–5/group; one way ANOVA p = 0.0013 with Holm-Sidak’s multiple comparisons test vs Saline) and percentage of immature (NG2+ Sox10+) oligodendrocytes (red line) (N = 3–5/group; one way ANOVA p = 0.0074 with Holm–Sidak’s multiple comparisons test vs Saline). f–h Representative images of saline, i-EVs, IL4-EVs or MSC-EVs-injected lesions (area delimited by dotted line) immunostained against MBP (green) and DAPI (blue) (f) or against NG2 (green), Sox10 (red) and DAPI (blue) (h) (scale bars 50 μm). g, i Histograms show the percentage of the lesioned area immunoreactive for MBP (g) (N = 3–7/group; one way ANOVA p = 0.0001 with Holm–Sidak’s multiple comparisons test vs Saline) or NG2 (i) (N = 3–4/group; one way ANOVA p = 0.0173 with Holm–Sidak’s multiple comparisons test vs Saline) in saline-injected mice and mice that received different types of EVs
Fig. 4
Fig. 4
Action of EVs on myelin deposition in acute LPC-mediated focal demyelination. a Experimental protocol of EV delivery to LPC-treated mice during the phase of OPC differentiation. b Histograms show percentage of immature (Sox10+NG2+) and differentiated cells (Sox10+NG2), oligodendrocytes in saline-injected mice and mice that received i-EVs or MSC-EVs (N = 3–4/group; Kruskal–Wallis test p = 0.0129 with Dunn’s multiple comparisons test vs Saline). Representative images of saline, i-EVs or MSC-EVs-injected lesions (area delimited by dotted line), immunostained against MBP (green, c), NG2 (green, e), or CC1 (yellow, g) (scale bars 50 μm). Histograms show the percentage of the lesioned area immunoreactive for MBP (d) (N = 3–4/group; one-way ANOVA p < 0.0001 with Holm–Sidak’s multiple comparisons test), NG2 (f) (N = 4/group; one-way ANOVA p < 0.0001 with Holm–Sidak’s multiple comparisons test) or the density of mature oligodendrocytes (CC1) (h) (N = 3/group; one-way ANOVA p < 0.0001 with Holm–Sidak’s multiple comparisons test. i Representative electron micrographs of CC in saline-injected mice and mice that received i-EVs or MSC-EVs (scale bars of images, 1 μm; original magnification 25,000). j Histograms show the percentage of unmyelinated/myelinated fibres (N = 3/group; one-way ANOVA p = 0.039 with Dunn’s multiple comparison test). k Myelin thickness can be quantified by the G-ratio, defined as the ratio between the inner (axonal, d, white) and outer (overlying myelin, d, yellow) diameters of myelinated axons. Scale bar of image, 1.5 μm. l Histograms show quantifications of the G-ratio (N = 3/group; Kruskal–Wallis test p < 0.0001 with Dunn’s multiple comparisons test). m Histograms show myelin sheath thickness (N = 3/group; Kruskal–Wallis test p < 0.0001 with Dunn’s multiple comparisons test). Each dot represents an individual value. n Scatter plots of G-ratio against axon diameter. The G-ratio of each measured myelinated fibre is indicated by a single circle (n = 160 saline, n = 167 MSC-EVs, n = 169 i-EVs). Correlation between axon diameter (x1) and G-ratio (y1) is expressed by the correlation coefficient (r) of the linear regression curve (saline: r = 0.503, i-EVs: r = 0.518; MSC-EVs: r = 0.448)
Fig. 5
Fig. 5
Action of microglia-derived EVs on OPC differentiation at myelin lesion in young mice. Representative images of saline, i-EVs and MSC-EVs-injected lesions (area delimited by dotted line), immunostained against MBP (green, a), NG2 (green, c), or CC1 (yellow, e) (scale bars 50 μm). Low magnification inserts show double labelling for DAPI. Histograms show the percentage of the lesioned area immunoreactive for MBP (b), NG2 (d) or CC1 (f) at 7 dpl in saline-injected mice and mice injected with i-EVs or MSC-EVs [number of animals (N) = 3–5/group, one-way ANOVA with Holm–Sidak’s multiple comparison: MBP, p = 0.0012; NG2, p < 0.0001; CC1, p = 0.0090)
Fig. 6
Fig. 6
EV impact on OPC migration, differentiation and myelination. a, b Fluorescence images of cultured OPCs incubated with EdU (red), fixed and stained for NG2 (green) and DAPI (blue) after 24 h exposure to i-EVs or MSC-EVs (scale bars 50 µm). The histograms in b show the percentage of EdU+ OPCs in cultures exposed or not to different EV types. Data have been normalized to control [number of experiments (n) = 5–8/group; Kruskal–Wallis test p < 0.0001 with Dunn’s multiple comparisons test]. c Histograms show the percentage of OPCs migrated through the filter of the Boyden chamber in control conditions and following addition of different types of EVs. Data have been normalized to control (n = 3; one-way ANOVA p = 0.0054 with Holm–Sidak’s multiple comparisons test vs control). d Percentage of migrated OPCs in response to S1P or IL-4-EVs in the presence or in the absence of the S1P receptor antagonist S-FTY720-Vinylphosphonate (n = 3; Kruskal–Wallis test p < 0.0001 with Dunn’s multiple comparisons test). e Representative images of OPCs maintained in control conditions or exposed to different types of EVs for 2 days, fixed and stained for MBP (red), GPR17 (green) and DAPI (blue) (scale bars 50 µm). f Corresponding quantification of MBP+ OPCs. Data have been normalized to control (n = 5–8/group, Kruskal–Wallis test p < 0.0001 with Dunn’s multiple comparisons test vs control). g Western blot of control OPCs and IL4-EVs-treated OPCs for the indicated markers of OPC differentiation. Tubulin has been used as loading control. Relative quantification of the band density is shown on the right (n = 3; CNPase: unpaired t test p = 0.0033; MBP: unpaired t test p = 0.0018; GST-pi: unpaired t test p < 0.0001; GPR17: unpaired t test p = 0.0224). h Representative images of OPC-DRG co-cultures maintained in control conditions or exposed to i-EVs, IL4-EVs or MSC-EVs for 11 days, fixed and stained for MBP (red) and neurofilament (NF, green) (scale bars 20 µm). e Myelination index (MBP staining/NF staining) under different experimental conditions (n = 3; Kruskal–Wallis test p < 0.0001 with Dunn’s multiple comparisons test vs control)
Fig. 7
Fig. 7
Astrocytes transform the pro-differentiating action of i-EVs to inhibitory activity. a Representative images of OPCs cultured alone or with astrocytes in the presence or in the absence of i-EVs immunostained for MBP (red), Olig2 (green) and GFAP (cyan) (scale bars 20 μm). b Corresponding quantifications of MBP+ OPCs (n = 2; one-way ANOVA p < 0.0001 with Tukey’s multiple comparisons test). Representative qPCR analysis of A1 (c) and A2 (d) marker expression in unstimulated astrocytes (control), astrocytes exposed to i-EVs, the lipid fraction of i-EVs (lipids), MSC-EVs (left panels). Right panels show A1 and A2 marker expression in astrocytes exposed to i-EVs in the presence/absence of the TNF-a inhibitor etanercept (ETN).Three replicates/condition have been normalized to control (one-way ANOVA p < 0.0001 with Holm–Sidak’s multiple comparisons test). e Representative images of saline, i-EVs, or MSC-EVs-injected lesions, immunostained against C3 or PTX3 (red) and Hoechst (blue) (scale bars 50 μm). High magnification inserts show astrocytes double stained for GFAP (green) and C3 or PTX3 (red). f Density of C3- and PTX3-positive astrocytes at saline, i-EVs-, i-EVs + ETN, or MSC-EVs-injected lesions (C3, number of sections = 5–10/group; Kruskal–Wallis test p = 0.0298 with Dunn’s multiple comparisons test among Saline, i-EVs and i-EVs + ETN); (PTX3, number of sections = 5–10/group; Kruskal–Wallis test p < 0.0001 with Dunn’s multiple comparisons test). g ELISA quantification of IL-1a, C1q, and TNF-α in 1X10⁶ inflammatory microglia (i-MG) and in MSC-treated microglia (MSC-MG) (n = 3; IL-1a, Mann–Whitney t test p = 0.9000; C1q, unpaired t test p = 0.5619; TNF-α, Mann–Whitney t test p = 0.0286)
Fig. 8
Fig. 8
EVs efficiently interact with OPCs. a Schematic representation of EV delivery to OPCs by optical tweezers. EVs are first trapped above the OPCs by the IR laser tweezers (left), then the stage is moved in plane (XY) and the objective/trap is moved axially (Z) to set the EVs in contact with the OPCs (middle). The trapping laser is switched off to check whether EV adheres to the neuron membrane (right). a′ Sequence of phase-contrast images showing one example of EV driven to an OPC following the procedure described in a (scale bar 10 μm). b, c OPCs were maintained in control condition or exposed to intact EVs, broken EVs or the lipid extract of EVs for 2 days, fixed and stained for MBP. Histograms show the percentage of mature MBP+ oligodendrocytes in cultures exposed to broken EVs derived from IL-4 microglia (Brk IL4-EVs) or MSC-treated cells (Brk MSC-EVs) (b; n = 3; Kruskal–Wallis test p = 0.0049 with Dunn’s multiple comparisons test versus control), intact EVs or native lipids (lipids) extracted from IL4-EVs (c; one-way ANOVA p = 0.0001 with Holm-Sidak’s multiple comparisons test). Data have been normalized to control. d Percentage of differentiated MBP+ oligodendrocytes in cultures exposed for 2 days to i-EVs alone or in combination with S-FTY720-Vinylphosphonate, FTY720-Vinylphosphonate alone or S1P. Data have been normalized to control (n = 3; Kruskal–Wallis test p = 0.0009 with Dunn’s multiple comparisons test versus control)

Similar articles

Cited by

References

    1. Antonucci F, Turola E, Riganti L, Caleo M, Gabrielli M, Perrotta C, et al. Microvesicles released from microglia stimulate synaptic activity via enhanced sphingolipid metabolism. EMBO J. 2012;31:1231–1240. doi: 10.1038/emboj.2011.489. - DOI - PMC - PubMed
    1. Arab T, Raffo-Romero A, Van Camp C, Lemaire Q, Le Marrec-Croq F, Drago F, et al. Proteomic characterisation of leech microglia extracellular vesicles (EVs): comparison between differential ultracentrifugation and Optiprep density gradient isolation. J Extracell Vesicles. 2019;8:1603048. doi: 10.1080/20013078.2019.1603048. - DOI - PMC - PubMed
    1. Baecher-Allan C, Kaskow BJ, Weiner HL. Multiple sclerosis: mechanisms and immunotherapy. Neuron. 2018;97:742–768. doi: 10.1016/j.neuron.2018.01.021. - DOI - PubMed
    1. Barenholz Y, Gibbes D, Litman BJ, Goll J, Thompson TE, Carlson RD. A simple method for the preparation of homogeneous phospholipid vesicles. Biochemistry. 1977;16:2806–2810. doi: 10.1021/bi00631a035. - DOI - PubMed
    1. Bertero A, Liska A, Pagani M, Parolisi R, Masferrer ME, Gritti M, et al. Autism-associated 16p11.2 microdeletion impairs prefrontal functional connectivity in mouse and human. Brain J Neurol. 2018;141:2055–2065. doi: 10.1093/brain/awy111. - DOI - PubMed

Publication types

MeSH terms

Substances