

Baseline incidence of adverse birth outcomes and infant influenza and pertussis hospitalisations prior to the introduction of influenza and pertussis vaccination in pregnancy: a data linkage study of 78 382 mother-infant pairs, Northern Territory, Australia, 1994-2015
- PMID: 31364572
- PMCID: PMC6627012
- DOI: 10.1017/S0950268819001171
Baseline incidence of adverse birth outcomes and infant influenza and pertussis hospitalisations prior to the introduction of influenza and pertussis vaccination in pregnancy: a data linkage study of 78 382 mother-infant pairs, Northern Territory, Australia, 1994-2015
Abstract
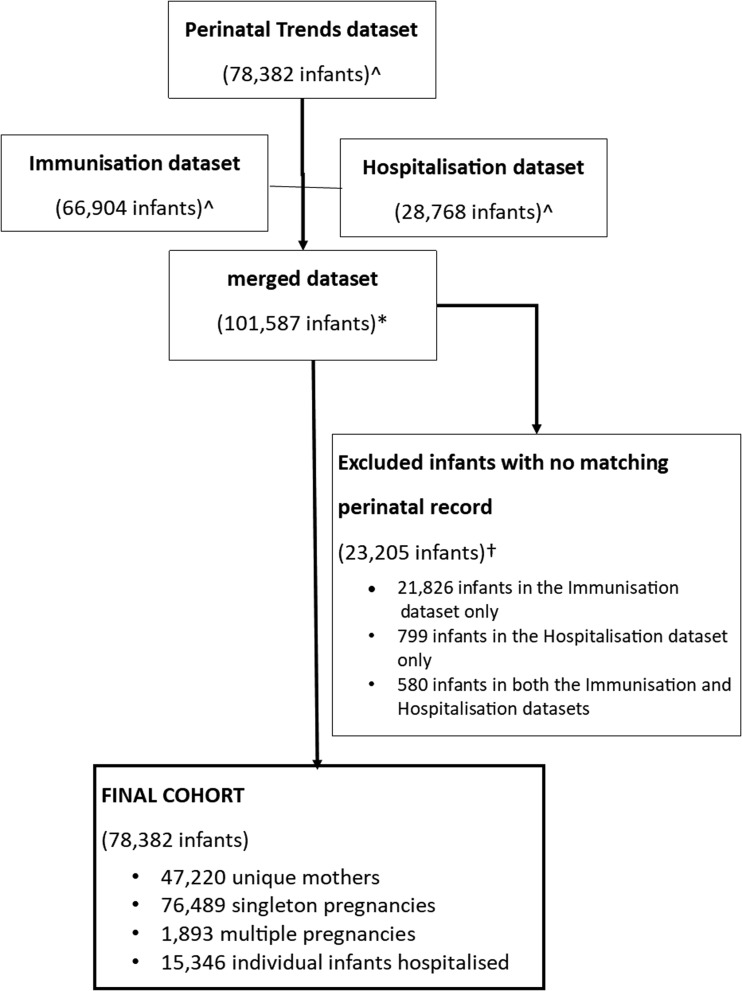
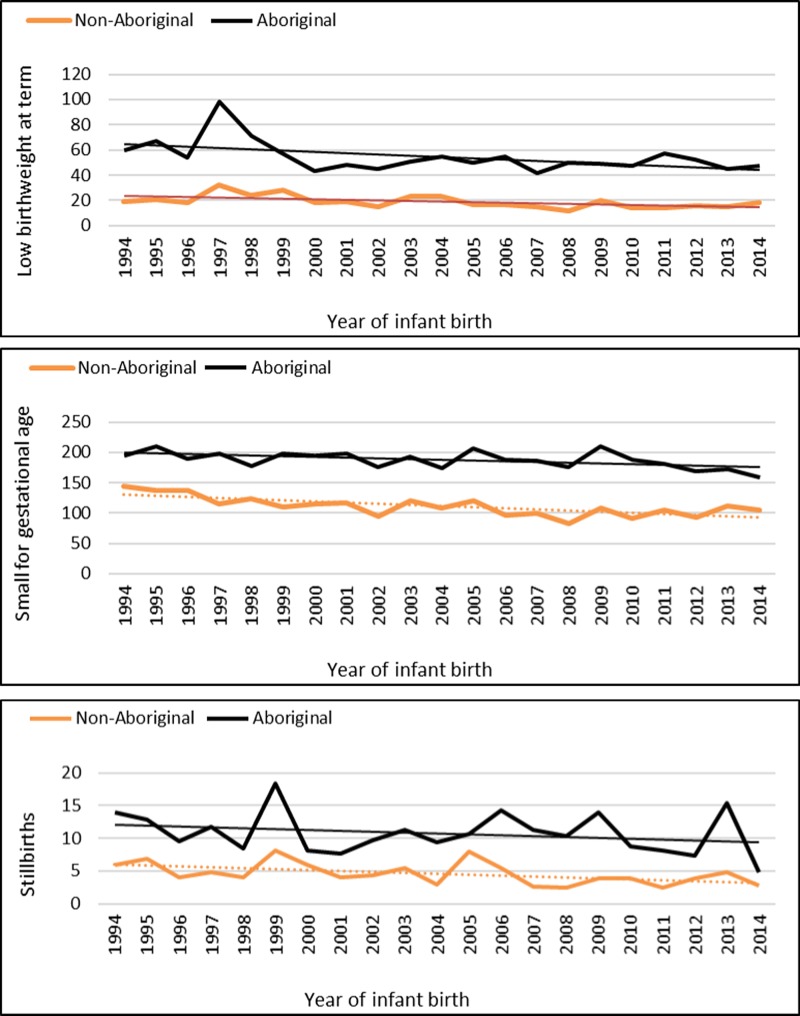
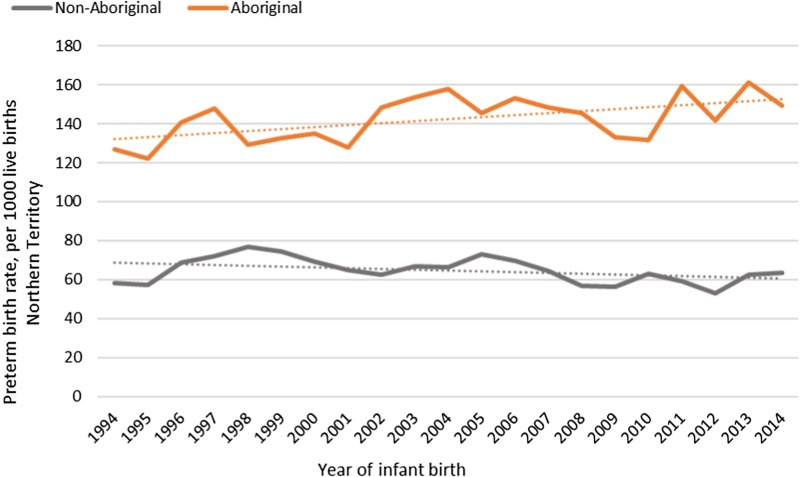
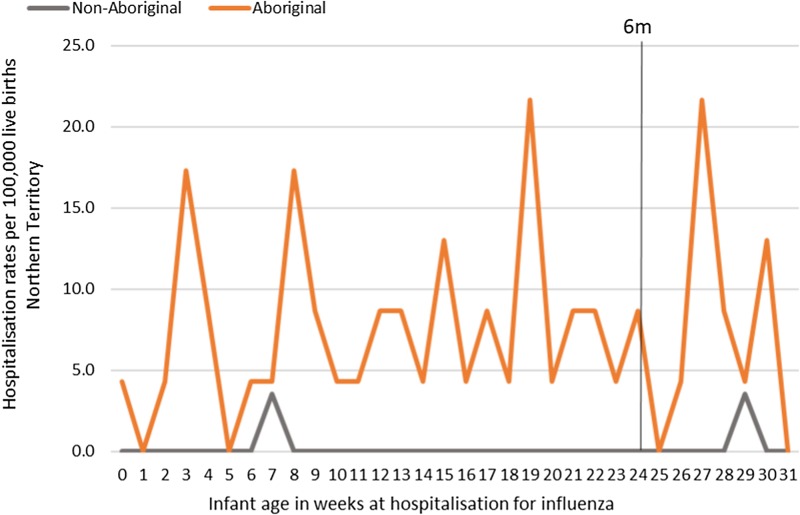
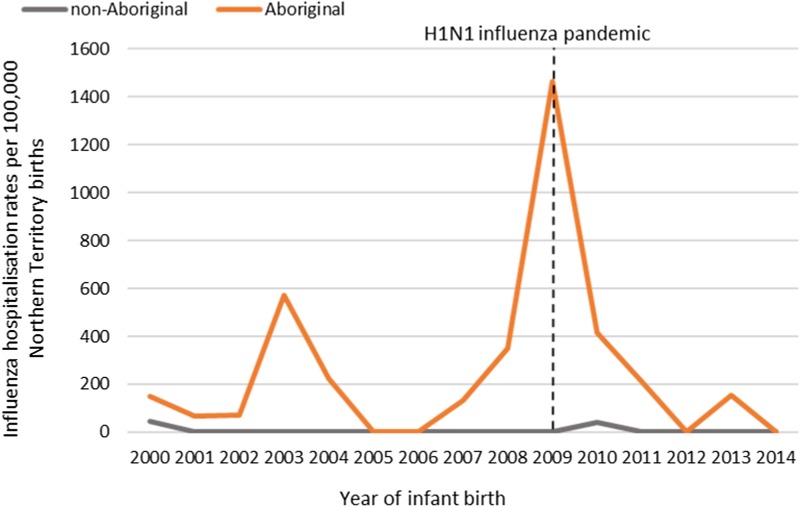
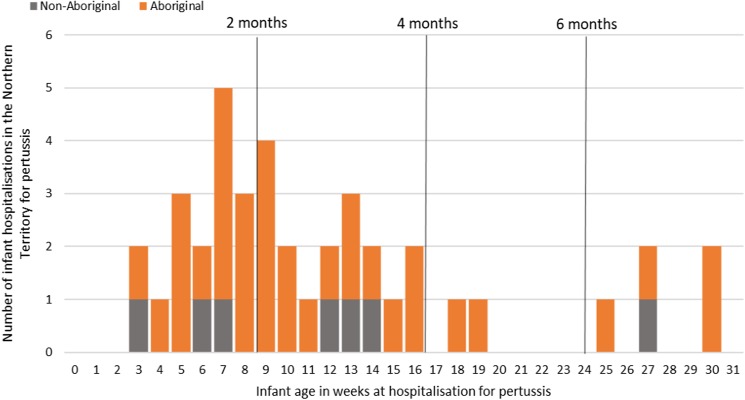
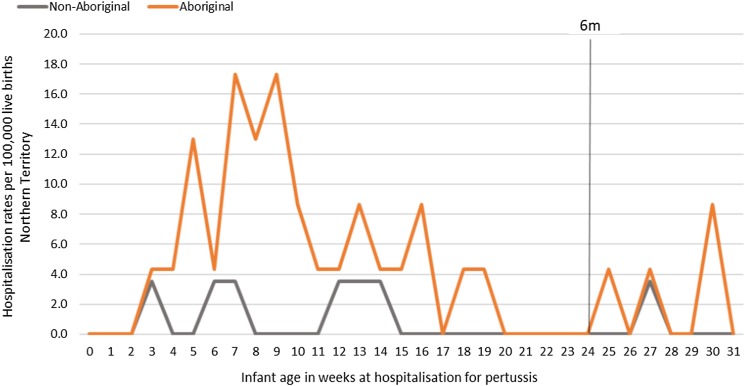
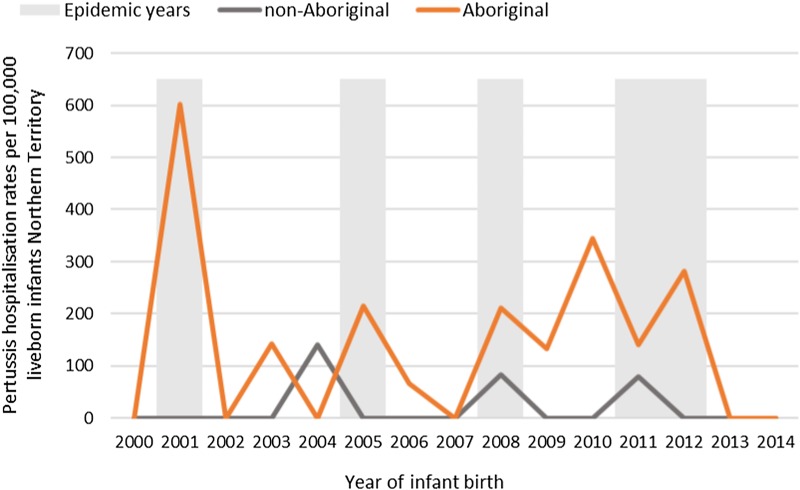
We conducted probabilistic data linkage of three population datasets for the Northern Territory (NT), Australia, to describe the incidence of preterm births, stillbirths, low birthweight and small for gestational age (SGA) per 1000 NT births; and influenza and pertussis hospitalisations per 1 00 000 NT births in infants <7 months of age, in a pre-maternal vaccination era. The Perinatal Trends dataset (1994-2014) formed the cohort of 78 382 births. Aboriginal mother-infant pairs (37%) had disproportionately higher average annual rates (AR) for all adverse birth outcomes compared to their non-Aboriginal counterparts; rate ratios: preterm births 2.2 (AR 142.4 vs. 64.7); stillbirths 2.3 (AR 10.8 vs. 4.6); low birthweight 2.9 (AR 54 vs. 19); and SGA 1.7 (AR 187 vs. 111). Hospitalisation (2000-2015) and Immunisation Register datasets (1994-2015), showed that influenza hospitalisations (n = 53) and rates were 42.3 times higher in Aboriginal infants (AR 254 vs. 6); and that pertussis hospitalisations (n = 37) were 7.1 times higher in Aboriginal infants (AR 142.5 vs. 20.2) compared to non-Aboriginal infants. These baseline data are essential to assess the safety and effectiveness of influenza and pertussis vaccinations in pregnant women from the NT. Remote living Aboriginal women and infants stand to benefit the most from these vaccines.
Keywords: Aboriginal and Torres Strait Islander; Australia; hospitalisations; incidence; infants; influenza; pertussis.
Conflict of interest statement
All authors have no conflicts of interest to declare.
Figures
Similar articles
-
The effectiveness of maternal pertussis vaccination for protecting Aboriginal and Torres Strait Islander infants against infection, 2012-2017: a retrospective cohort study.Med J Aust. 2024 Mar 4;220(4):196-201. doi: 10.5694/mja2.52220. Epub 2024 Feb 14. Med J Aust. 2024. PMID: 38353124
-
'Links2HealthierBubs' cohort study: protocol for a record linkage study on the safety, uptake and effectiveness of influenza and pertussis vaccines among pregnant Australian women.BMJ Open. 2019 Jun 20;9(6):e030277. doi: 10.1136/bmjopen-2019-030277. BMJ Open. 2019. PMID: 31227542 Free PMC article.
-
The Safety of Influenza and Pertussis Vaccination in Pregnancy in a Cohort of Australian Mother-Infant Pairs, 2012-2015: The FluMum Study.Clin Infect Dis. 2019 Jan 18;68(3):402-408. doi: 10.1093/cid/ciy517. Clin Infect Dis. 2019. PMID: 30475988
-
Australian vaccine preventable disease epidemiological review series: Pertussis, 2013-2018.Commun Dis Intell (2018). 2022 Jan 27;46. doi: 10.33321/cdi.2022.46.3. Commun Dis Intell (2018). 2022. PMID: 35093001 Review.
-
Experience and challenges on influenza and pertussis vaccination in pregnant women.Hum Vaccin Immunother. 2018;14(9):2183-2188. doi: 10.1080/21645515.2018.1483810. Epub 2018 Jul 24. Hum Vaccin Immunother. 2018. PMID: 30024822 Free PMC article. Review.
Cited by
-
Safety, equity and monitoring: a review of the gaps in maternal vaccination strategies for Aboriginal and Torres Strait Islander women.Hum Vaccin Immunother. 2020;16(2):371-376. doi: 10.1080/21645515.2019.1649552. Epub 2019 Sep 6. Hum Vaccin Immunother. 2020. PMID: 31368832 Free PMC article. Review.
-
Linking cohort-based data with electronic health records: a proof-of-concept methodological study in Hong Kong.BMJ Open. 2021 Jun 22;11(6):e045868. doi: 10.1136/bmjopen-2020-045868. BMJ Open. 2021. PMID: 34158297 Free PMC article.
-
Inequity of antenatal influenza and pertussis vaccine coverage in Australia: the Links2HealthierBubs record linkage cohort study, 2012-2017.BMC Pregnancy Childbirth. 2023 May 8;23(1):314. doi: 10.1186/s12884-023-05574-w. BMC Pregnancy Childbirth. 2023. PMID: 37150828 Free PMC article.
References
-
- La Ruche G et al. (2009) The 2009 pandemic H1N1 influenza and indigenous populations of the Americas and the Pacific. EuroSurveillance 14, 19366. - PubMed
-
- Pillsbury A, Quinn H and McIntyre P (2014) Australian vaccine preventable disease epidemiological review series: pertussis, 2006–2012. Communicable Diseases Intelligence Short Report 38, E179–EE94. - PubMed
-
- Australian Technical Advisory Group on Immunisation (ATAGI) National Health and Medical Research Council (2013) The Australian Immunisation Handbook, 10th edn, Canberra: Department of Health and Ageing.
-
- Beard F (2015) Pertussis immunisation in pregnancy: a summary of funded Australian state and territory programs. Communicable Diseases Intelligence Short Report 39, E329–E336. - PubMed
-
- World Health Organization (2014) Safety of Immunization during Pregnancy: A review of the evidence. Global Advisory Committee on Vaccine Safety. Available At http://www.who.int/vaccine_safety/publications/safety_pregnancy_nov2014.pdf
Publication types
MeSH terms
Substances
LinkOut - more resources
Full Text Sources
Medical
Research Materials
