

Effects of large-scale oceanic phenomena on non-cholera vibriosis incidence in the United States: implications for climate change
- PMID: 31364581
- PMCID: PMC6805737
- DOI: 10.1017/S0950268819001316
Effects of large-scale oceanic phenomena on non-cholera vibriosis incidence in the United States: implications for climate change
Abstract
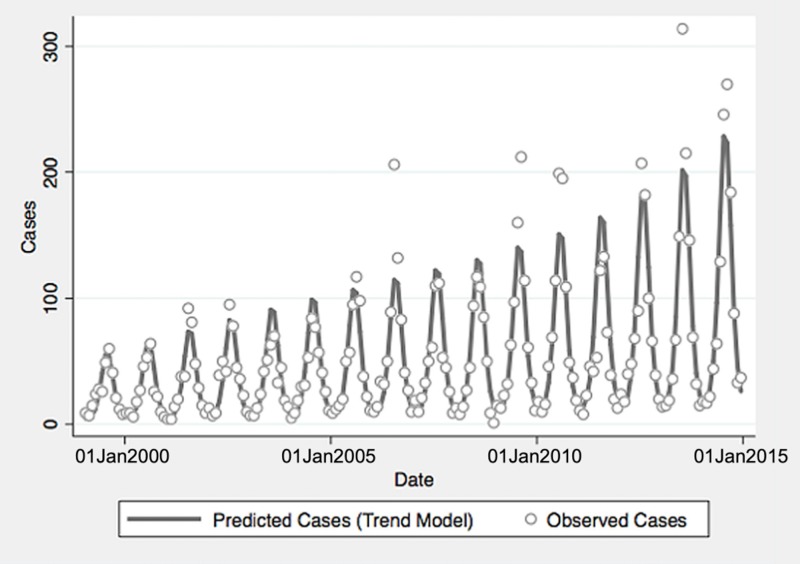
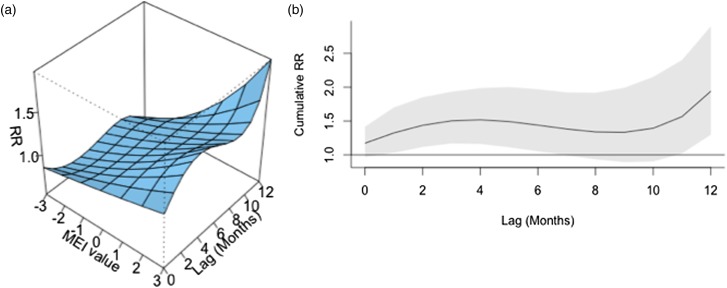
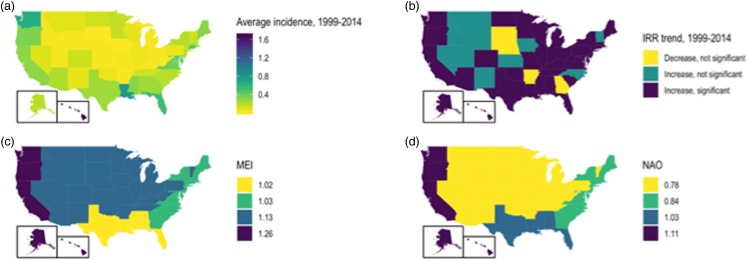
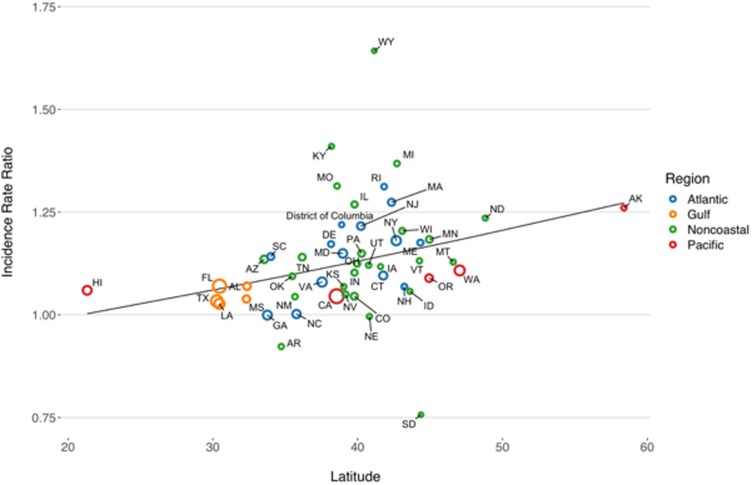
Non-cholera Vibrio (NCV) species are important causes of disease. These pathogens are thermophilic and climate change could increase the risk of NCV infection. The El Niño Southern Oscillation (ENSO) is a 'natural experiment' that may presage ocean warming effects on disease incidence. In order to evaluate possible climatic contributions to observed increases in NCV infection, we obtained NCV case counts for the United States from publicly available surveillance data. Trends and impacts of large-scale oceanic phenomena, including ENSO, were evaluated using negative binomial and distributed non-linear lag models (DNLM). Associations between latitude and changing risk were evaluated with meta-regression. Trend models demonstrated expected seasonality (P < 0.001) and a 7% (6.1%-8.1%) annual increase in incidence from 1999 to 2014. DNLM demonstrated increased vibriosis risk following ENSO conditions over the subsequent 12 months (relative risk 1.940, 95% confidence interval (CI) 1.298-2.901). The 'relative-relative risk' (RRR) of annual disease incidence increased with latitude (RRR per 10° increase 1.066, 95% CI 1.027-1.107). We conclude that NCV risk in the United States is impacted by ocean warming, which is likely to intensify with climate change, increasing NCV risk in vulnerable populations.
Keywords: Climate change; Vibrio fluvialis; Vibrio parahaemolyticus; Vibrio vulnificus; foodborne illness.
Conflict of interest statement
None of the authors has any conflict of interest, financial or otherwise, associated with this work.
Figures
Similar articles
-
Examining the Relationship between Climate Change and Vibriosis in the United States: Projected Health and Economic Impacts for the 21st Century.Environ Health Perspect. 2022 Aug;130(8):87007. doi: 10.1289/EHP9999a. Epub 2022 Aug 19. Environ Health Perspect. 2022. PMID: 35983960 Free PMC article.
-
Impact of El Niño Southern Oscillation on infectious disease hospitalization risk in the United States.Proc Natl Acad Sci U S A. 2016 Dec 20;113(51):14589-14594. doi: 10.1073/pnas.1604980113. Epub 2016 Oct 24. Proc Natl Acad Sci U S A. 2016. PMID: 27791069 Free PMC article.
-
Increasing rates of vibriosis in the United States, 1996-2010: review of surveillance data from 2 systems.Clin Infect Dis. 2012 Jun;54 Suppl 5(0 5):S391-5. doi: 10.1093/cid/cis243. Clin Infect Dis. 2012. PMID: 22572659 Free PMC article.
-
Non-Cholera Vibrios: The Microbial Barometer of Climate Change.Trends Microbiol. 2017 Jan;25(1):76-84. doi: 10.1016/j.tim.2016.09.008. Epub 2016 Nov 12. Trends Microbiol. 2017. PMID: 27843109 Review.
-
Cholera and other vibrioses in the United States.N Engl J Med. 1985 Feb 7;312(6):343-50. doi: 10.1056/NEJM198502073120604. N Engl J Med. 1985. PMID: 3881668 Review. No abstract available.
Cited by
-
Climate change and antibiotic resistance: a deadly combination.Ther Adv Infect Dis. 2021 Feb 15;8:2049936121991374. doi: 10.1177/2049936121991374. eCollection 2021 Jan-Dec. Ther Adv Infect Dis. 2021. PMID: 33643652 Free PMC article. Review.
-
Immunogenic characterization and protective efficacy of recombinant CsgA, major subunit of curli fibers, against Vibrio parahaemolyticus.Appl Microbiol Biotechnol. 2021 Jan;105(2):599-616. doi: 10.1007/s00253-020-11038-4. Epub 2021 Jan 6. Appl Microbiol Biotechnol. 2021. PMID: 33404830
-
Impact of adjustment for differential testing by age and sex on apparent epidemiology of SARS-CoV- 2 infection in Ontario, Canada.BMC Infect Dis. 2025 Apr 23;25(1):589. doi: 10.1186/s12879-025-10968-6. BMC Infect Dis. 2025. PMID: 40269768 Free PMC article.
-
Human Health and Ocean Pollution.Ann Glob Health. 2020 Dec 3;86(1):151. doi: 10.5334/aogh.2831. Ann Glob Health. 2020. PMID: 33354517 Free PMC article. Review.
-
Examining the Relationship between Climate Change and Vibriosis in the United States: Projected Health and Economic Impacts for the 21st Century.Environ Health Perspect. 2022 Aug;130(8):87007. doi: 10.1289/EHP9999a. Epub 2022 Aug 19. Environ Health Perspect. 2022. PMID: 35983960 Free PMC article.
References
-
- Armstrong G, Hollingsworth J and Morris J (1998) Bacterial foodborne infections In Evans A and Brachman P (eds), Bacterial Infections of Humans: Epidemiology and Control, 3rd Edn New York: Plenum Medical Book Company, pp. 109–138.
-
- Franca SM et al. (1980) Vibrio parahaemolyticus in Brazilian coastal waters. JAMA 244, 587–588. - PubMed
-
- Mahon BE et al. (1996) Reported cholera in the United States, 1992–1994: a reflection of global changes in cholera epidemiology. JAMA 276, 307–312. - PubMed
-
- Dechet AM et al. (2008) Nonfoodborne Vibrio infections: an important cause of morbidity and mortality in the United States, 1997–2006. Clinical Infectious Diseases 46, 970–976. - PubMed
MeSH terms
LinkOut - more resources
Full Text Sources
Medical
