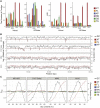
Comparison of the sequencing bias of currently available library preparation kits for Illumina sequencing of bacterial genomes and metagenomes
- PMID: 31364694
- PMCID: PMC6796507
- DOI: 10.1093/dnares/dsz017
Comparison of the sequencing bias of currently available library preparation kits for Illumina sequencing of bacterial genomes and metagenomes
Abstract
In bacterial genome and metagenome sequencing, Illumina sequencers are most frequently used due to their high throughput capacity, and multiple library preparation kits have been developed for Illumina platforms. Here, we systematically analysed and compared the sequencing bias generated by currently available library preparation kits for Illumina sequencing. Our analyses revealed that a strong sequencing bias is introduced in low-GC regions by the Nextera XT kit. The level of bias introduced is dependent on the level of GC content; stronger bias is generated as the GC content decreases. Other analysed kits did not introduce this strong sequencing bias. The GC content-associated sequencing bias introduced by Nextera XT was more remarkable in metagenome sequencing of a mock bacterial community and seriously affected estimation of the relative abundance of low-GC species. The results of our analyses highlight the importance of selecting proper library preparation kits according to the purposes and targets of sequencing, particularly in metagenome sequencing, where a wide range of microbial species with various degrees of GC content is present. Our data also indicate that special attention should be paid to which library preparation kit was used when analysing and interpreting publicly available metagenomic data.
Keywords: Illumina sequencing; bacterial genome sequencing; library preparation kits; metagenome sequencing; sequencing bias.
© The Author(s) 2019. Published by Oxford University Press on behalf of Kazusa DNA Research Institute.
Figures


Similar articles
-
Rapid, user-friendly, cost-effective DNA and library Preparation methods for whole-genome sequencing of bacteria with varying cell wall composition and GC content using minimal DNA on the illumina platform.BMC Genomics. 2025 Apr 23;26(1):396. doi: 10.1186/s12864-025-11598-7. BMC Genomics. 2025. PMID: 40269696 Free PMC article.
-
GC bias affects genomic and metagenomic reconstructions, underrepresenting GC-poor organisms.Gigascience. 2020 Feb 1;9(2):giaa008. doi: 10.1093/gigascience/giaa008. Gigascience. 2020. PMID: 32052832 Free PMC article.
-
Comparison of Sample Preparation Methods Used for the Next-Generation Sequencing of Mycobacterium tuberculosis.PLoS One. 2016 Feb 5;11(2):e0148676. doi: 10.1371/journal.pone.0148676. eCollection 2016. PLoS One. 2016. PMID: 26849565 Free PMC article.
-
Library preparation methods for next-generation sequencing: tone down the bias.Exp Cell Res. 2014 Mar 10;322(1):12-20. doi: 10.1016/j.yexcr.2014.01.008. Epub 2014 Jan 15. Exp Cell Res. 2014. PMID: 24440557 Review.
-
Best Practices for Illumina Library Preparation.Curr Protoc Hum Genet. 2019 Jun;102(1):e86. doi: 10.1002/cphg.86. Curr Protoc Hum Genet. 2019. PMID: 31216112 Review.
Cited by
-
High-throughput DNA extraction and cost-effective miniaturized metagenome and amplicon library preparation of soil samples for DNA sequencing.PLoS One. 2024 Apr 4;19(4):e0301446. doi: 10.1371/journal.pone.0301446. eCollection 2024. PLoS One. 2024. PMID: 38573983 Free PMC article.
-
Emergence of carbapenem resistance in persistent Shewanella algae bacteremia: the role of pdsS G547W mutation in adaptive subpopulation dynamics.Ann Clin Microbiol Antimicrob. 2024 Nov 20;23(1):102. doi: 10.1186/s12941-024-00759-3. Ann Clin Microbiol Antimicrob. 2024. PMID: 39568026 Free PMC article.
-
Improving rigor and reproducibility in chromatin immunoprecipitation assay data analysis workflows with Rocketchip.bioRxiv [Preprint]. 2024 Jul 16:2024.07.10.602975. doi: 10.1101/2024.07.10.602975. bioRxiv. 2024. PMID: 39071274 Free PMC article. Preprint.
-
Insights into water insecurity in Indigenous communities in Canada: assessing microbial risks and innovative solutions, a multifaceted review.PeerJ. 2024 Oct 18;12:e18277. doi: 10.7717/peerj.18277. eCollection 2024. PeerJ. 2024. PMID: 39434791 Free PMC article. Review.
-
GC Content-Associated Sequencing Bias Caused by Library Preparation Method May Infrequently Affect Salmonella Serotype Prediction Using SeqSero2.Appl Environ Microbiol. 2020 Sep 1;86(18):e00614-20. doi: 10.1128/AEM.00614-20. Print 2020 Sep 1. Appl Environ Microbiol. 2020. PMID: 32680856 Free PMC article. No abstract available.
References
Publication types
MeSH terms
LinkOut - more resources
Full Text Sources
Miscellaneous

