. 2019 Oct 1;317(4):C843-C856.
doi: 10.1152/ajpcell.00144.2019. Epub 2019 Jul 31.

Impaired glucose tolerance, glucagon, and insulin responses in mice lacking the loop diuretic-sensitive Nkcc2a transporter

Affiliations

Impaired glucose tolerance, glucagon, and insulin responses in mice lacking the loop diuretic-sensitive Nkcc2a transporter

Lisa Kelly et al. Am J Physiol Cell Physiol. .

Abstract

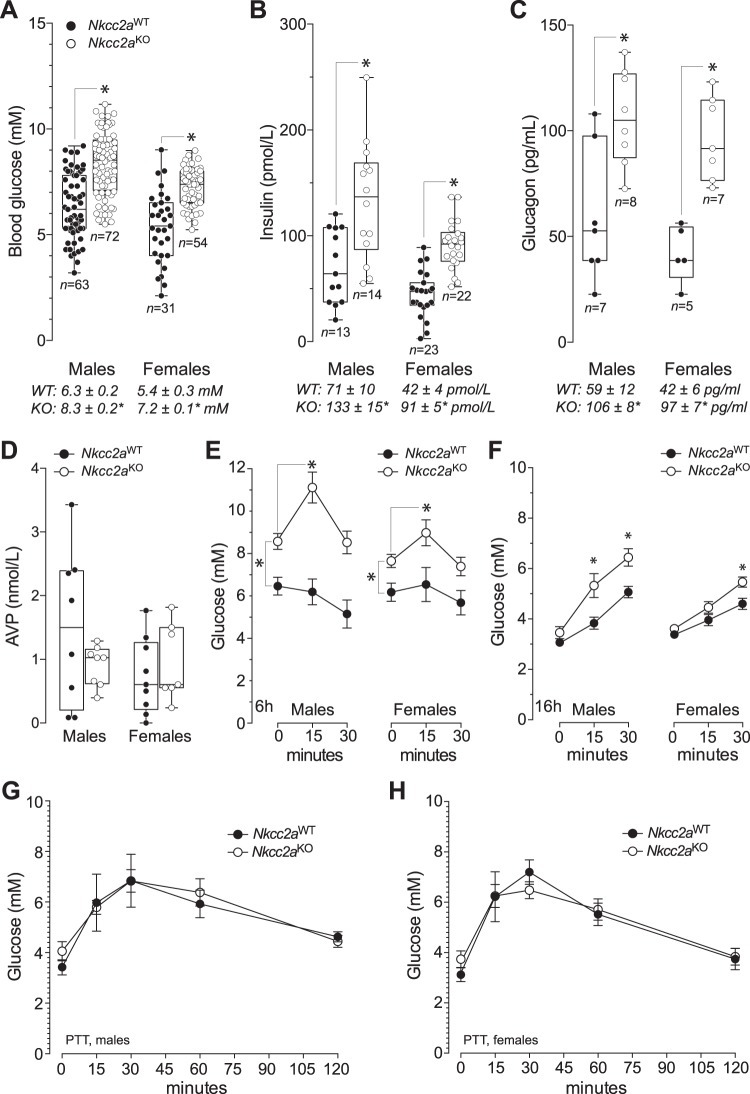
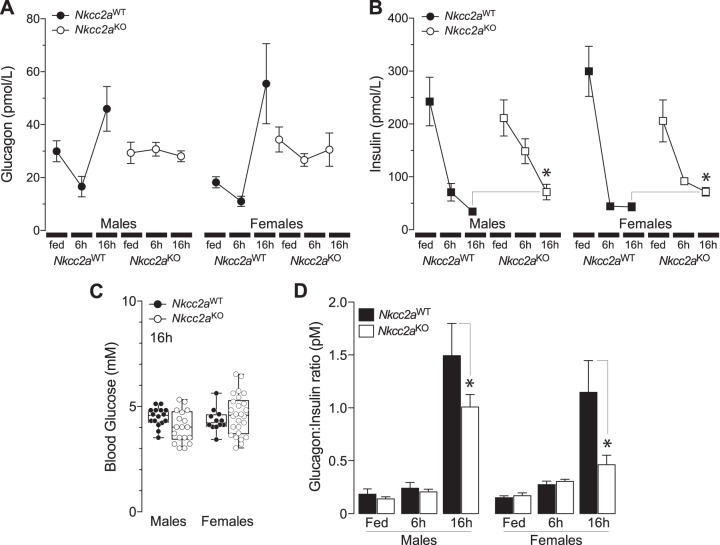
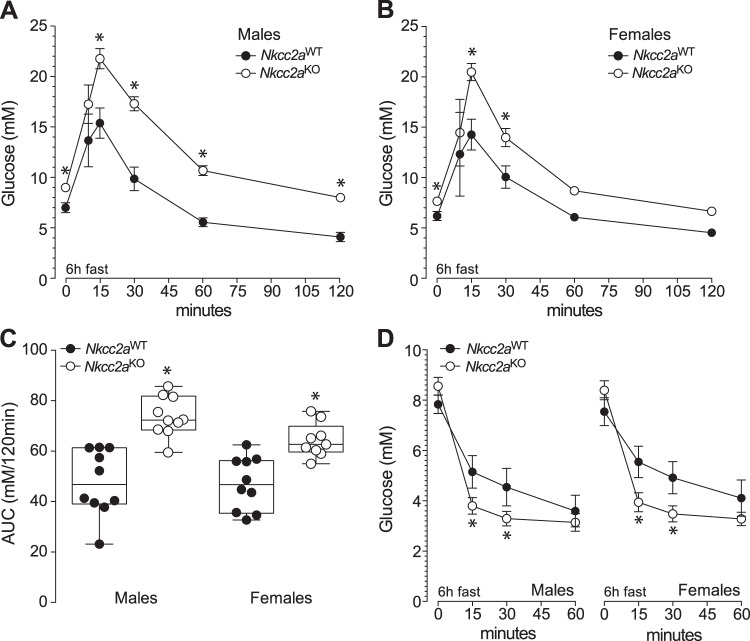
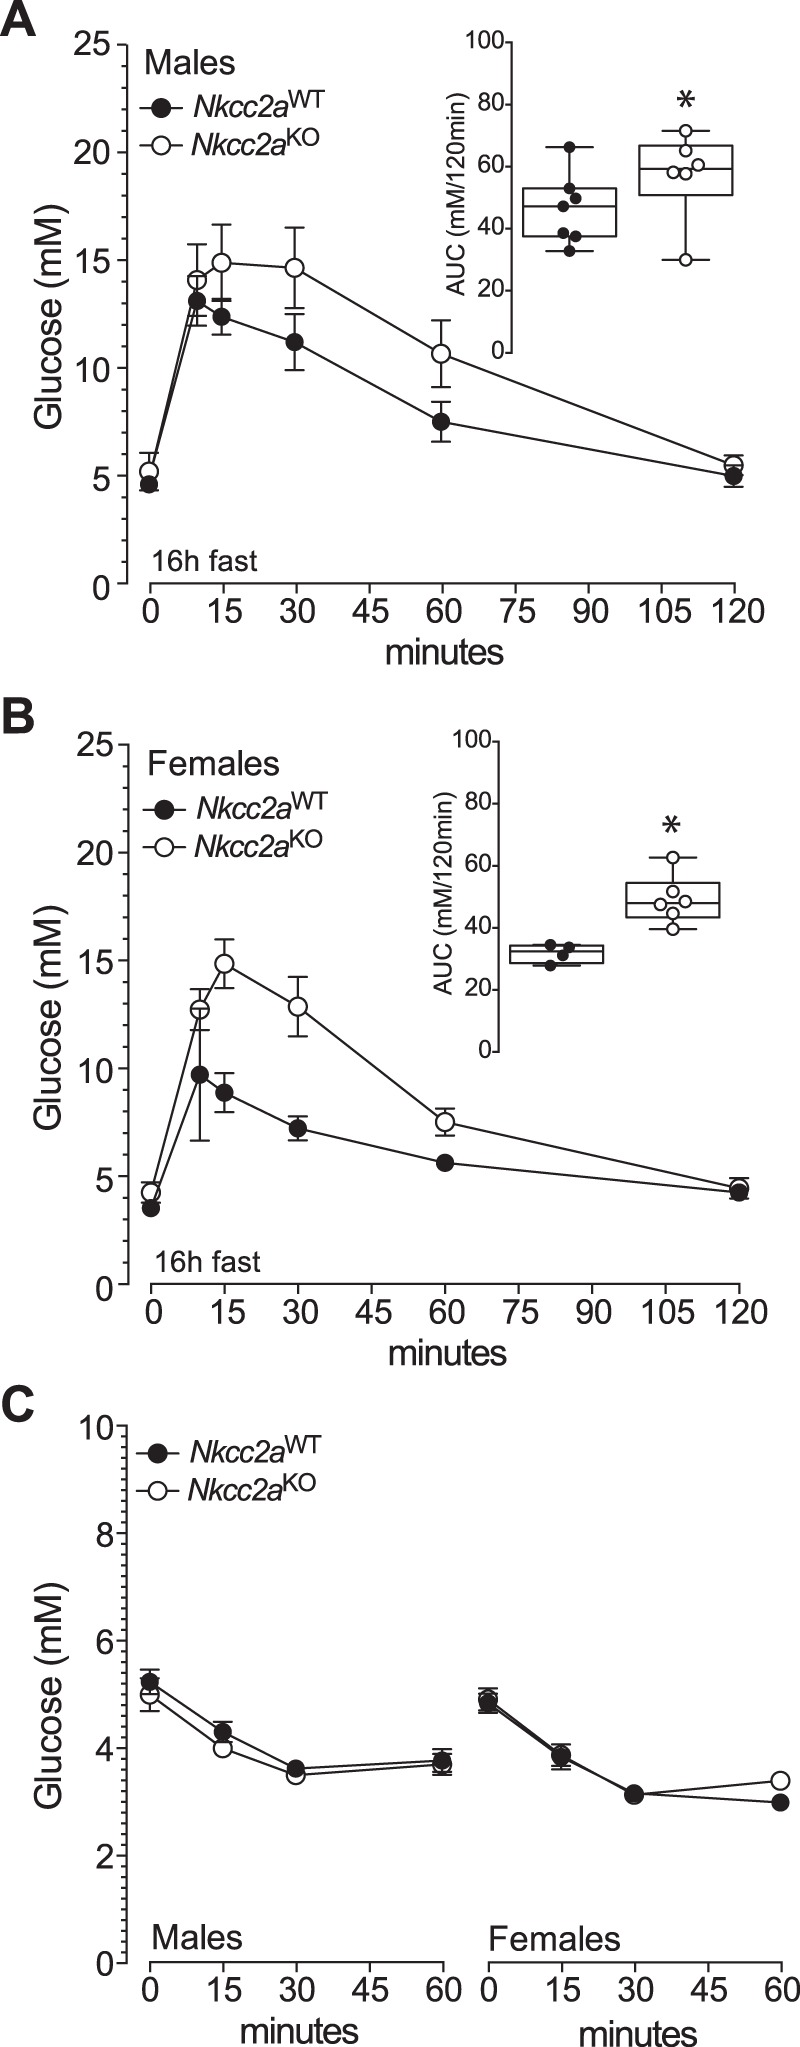
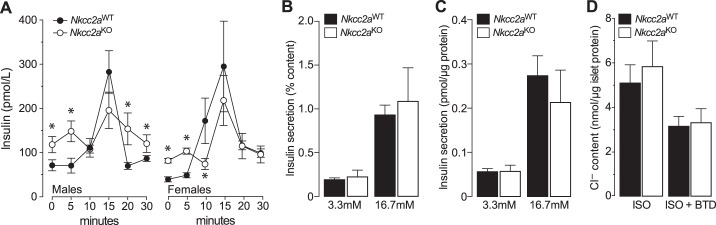
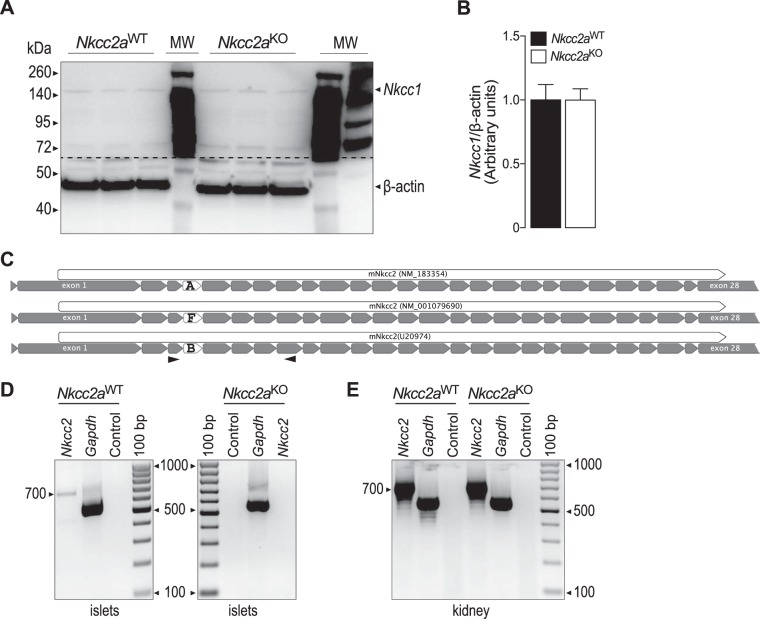
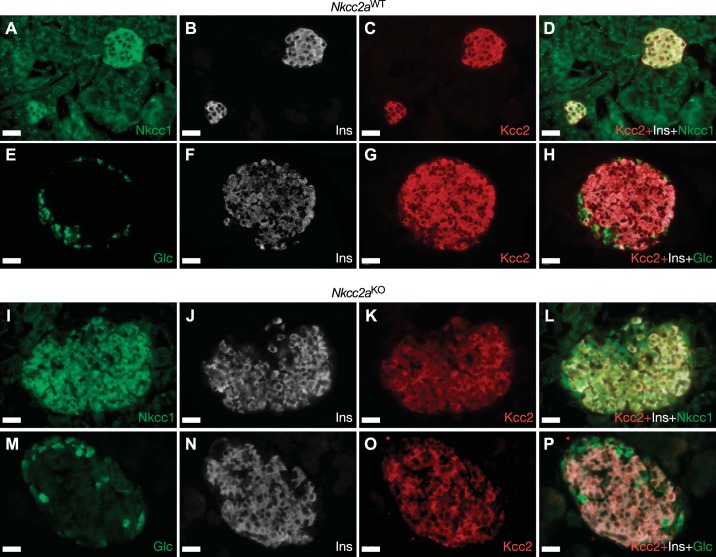
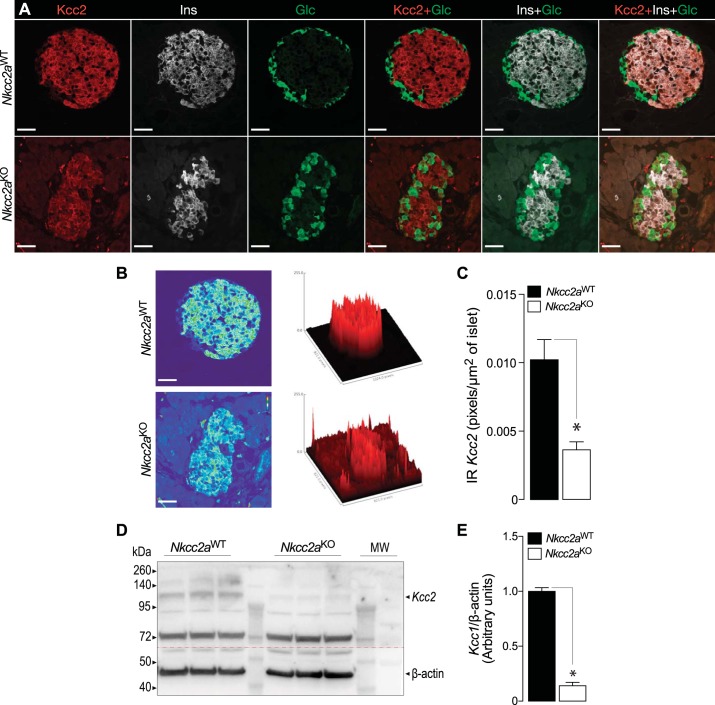
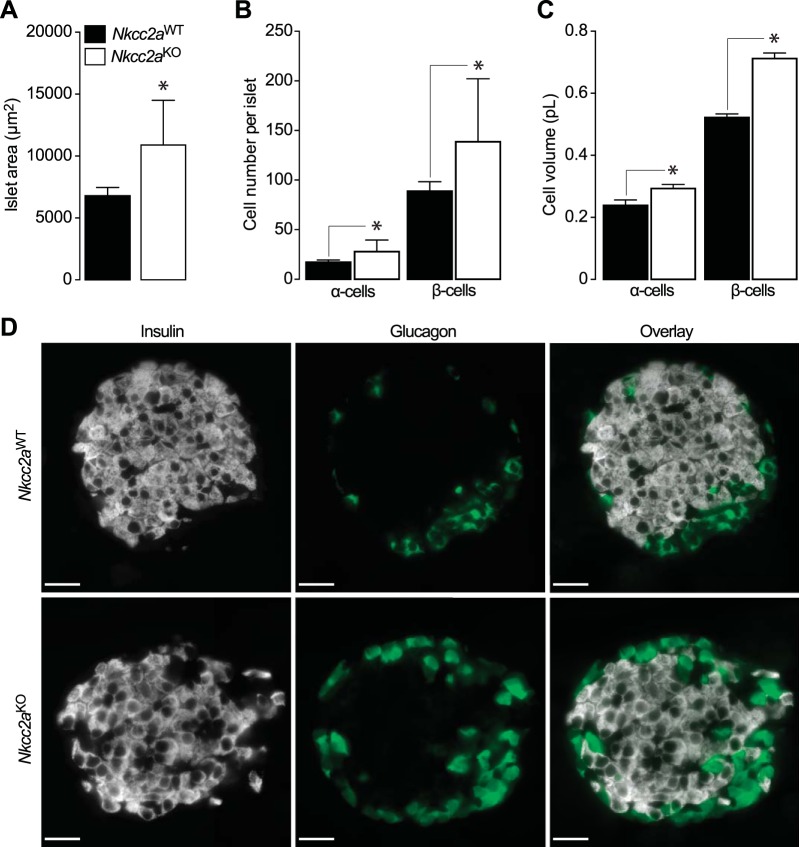
The Na+K+2Cl- cotransporter-2 (Nkcc2, Slc12a1) is abundantly expressed in the kidney and its inhibition with the loop-diuretics bumetanide and furosemide has been linked to transient or permanent hyperglycemia in mice and humans. Notably, Slc12a1 is expressed at low levels in hypothalamic neurons and in insulin-secreting β-cells of the endocrine pancreas. The present study was designed to determine if global elimination of one of the Slc12a1 products, i.e., Nkcc2 variant a (Nkcc2a), the main splice version of Nkcc2 found in insulin-secreting β-cells, has an impact on the insulin and glucagon secretory responses and fuel homeostasis in vivo. We have used dynamic tests of glucose homeostasis in wild-type mice and mice lacking both alleles of Nkcc2a (Nkcc2aKO) and assessed their islet secretory responses in vitro. Under basal conditions, Nkcc2aKO mice have impaired glucose homeostasis characterized by increased blood glucose, intolerance to the sugar, delayed/blunted in vivo insulin and glucagon responses to glucose, and increased glycemic responses to the gluconeogenic substrate alanine. Further, we provide evidence of conserved quantitative secretory responses of Nkcc2aKO islets within a context of increased islet size related to hyperplastic/hypertrophic glucagon- and insulin-positive cells (α-cells and β-cells, respectively), normal total islet Cl- content, and reduced β-cell expression of the Cl- extruder Kcc2.

Keywords: Slc12a1/Nkcc2a; Slc12a5/Kcc2; glucagon; glucose homeostasis; insulin.


Conflict of interest statement

No conflicts of interest, financial or otherwise, are declared by the authors.

Figures

Fig. 1.
Fig. 1.
Nkcc2aKO mice exhibit increased basal blood glucose, plasma insulin, and hepatic gluconeogenesis. AD: box and whisker plots representing fasting (6 h) values of blood glucose (A), plasma insulin (B), glucagon (C), and arginine-vasopressin (AVP; D) obtained in male and female mice of each genotype (Nkcc2aKO and Nkcc2aWT). Shown are the means (horizontal bars), the number of determinations (open or closed circles), the distribution of values (upper and lower quartiles, box), the lowest and highest values (whiskers), and the statistical significance of the noted means (*P < 0.01). The mean  ± SE values of fasting blood glucose (mM), plasma insulin (pmol/L), and glucagon (pg/ml) are shown at the bottom of each graph. E: serial blood glucose responses of 6 h-fasted Nkcc2aWT and Nkcc2aKO mice (closed and open circles, respectively) to injected alanine (2 g/kg, *P < 0.05). The mean changes in glucose levels 15 min after alanine administration were: male Nkcc2aWT: –0.86 ± 0.27 mM (n = 10) and Nkcc2aKO: 1.54 ± 0.68* mM (n = 13), *P < 0.05; female Nkcc2aWT: –0.04 ± 0.49 mM (n = 10) and Nkcc2aKO: 1.72 ± 0.59* mM (n = 15), *P < 0.05]. F: shown are blood glucose responses at 0, 15, and 30 min after intraperitoneal administration of alanine (2 g/kg) to 16 h-fasted male and female Nkcc2aWT and Nkcc2aKO mice (closed and open circles, respectively) (*P < 0.05). The mean changes in glucose levels 30 min after alanine administration were as follows: male Nkcc2aWT: 1.94 ± 0.21 mM (n = 16) and Nkcc2aKO: 2.76 ± 0.36* mM (n = 10), *P < 0.05; female Nkcc2aWT: 0.99 ± 0.31 mM (n = 12) and Nkcc2aKO: 1.95 ± 0.28* mM (n = 12), *P < 0.05]. G and H: pyruvate tolerance tests in 16 h-fasted mice. Blood glucose responses to intraperitoneal administration of pyruvate (2 g/kg) in males (A) and females (B) of the Nkcc2aWT and Nkcc2aKO genotypes (closed and open circles, respectively) (n = 5–10) are shown.
Fig. 2.
Fig. 2.
Nkcc2aKO mice exhibit increased plasma glucagon and impaired glucagon responses to fasting. A and B: plasma glucagon (A) and insulin (B) in fed, 6 h-, and 16 h-fasted Nkcc2aWT and Nkcc2aKO mice of both sexes (glucagon, n = 5–8; insulin, n = 6–11). C: box and whisker plots representing values of blood glucose from 16 h-fasted male and female mice of each genotype (Nkcc2aKO and Nkcc2aWT, *P < 0.05). D: glucagon-to-insulin molar ratios (pmol/L) of male (left) and female (right) Nkcc2aWT and Nkcc2aKO mice in the fed state (n = 10) or after 6 h (n = 7–13) and 16 h (n = 7–11) fasting period (*P < 0.05).
Fig. 3.
Fig. 3.
Nkcc2aKO mice are glucose intolerant. A and B: intraperitoneal glucose tolerance tests (GTT) performed in 6 h-fasted male (A) and female (B) mice of both genotypes: Nkcc2aWT (closed circles, *P < 0.05, n = 10–15) and Nkcc2aKO (open circles, *P < 0.05, n = 10–15). C: areas under the curve (AUCs) of each GTT performed in 6 h-fasted mice of each sex and genotype. AUCs are expressed as blood glucose (in mM) cleared from blood in 120 min (*P < 0.05). D: glucose responses to intraperitoneal injection of insulin in 6 h-fasted Nkcc2aWT and Nkcc2aKO mice of both sexes (*P < 0.05, n = 10–15).
Fig. 4.
Fig. 4.
Glucose and insulin tolerance tests in 16 h-fasted Nkcc2aWT and Nkcc2aKO mice. A and B: blood glucose responses recorded at the indicated time points after intraperitoneal administration of glucose (2 g/kg) to 16 h-fasted males (A) and females (B) of the Nkcc2aWT and Nkcc2aKO genotypes (closed and open circles, respectively). Also shown are the areas under each curve (AUC; insets; *P < 0.05, n = 6 or 7). C: hypoglycemic responses of 16 h-fasted Nkcc2aWT and Nkcc2aKO mice of both sexes.
Fig. 5.
Fig. 5.
Nkcc2aKO mice exhibit delayed and blunted insulin responses in vivo. A: plasma insulin (pmol/L) responses to injected glucose (2 g/kg) in 6 h-fasted male and female mice (n = 10–15) of both genotypes (Nkcc2aWT and Nkcc2aKO, closed and open circles, respectively, *P < 0.05). B and C: static glucose-stimulated insulin secretion experiments (n = 3). In vitro islet insulin secretory response to noninsulinotropic and insulinotropic glucose (3.3 and 16.7 mM, respectively). Results are expressed relative to islet insulin content (B) or total protein (C). The islet insulin content per µg of islet protein was: Nkcc2aKO: 27.5 ± 3.1 pmol/µg protein and Nkcc2aWT: 29.5 ± 1.9 pmol/µg protein (P = 0.626). D: total Cl uptake of Nkcc2aWT and Nkcc2aKO islets (closed and open bars, respectively) was determined 5 min after incubation in isotonic (ISO) media containing physiological concentrations of Cl (120 mM) alone or in the presence of bumetanide (BTD; 10 µM). Results are expressed as nmol Cl per µg protein (n = 5).
Fig. 6.
Fig. 6.
Nkcc2 transcript and Nkcc1 protein expression in islets of Nkcc2aWT and Nkcc2aKO mice. A: original immunoblotting of protein extracts (75 µg/lane) obtained from freshly purified islets from Nkcc2aWT and Nkcc2aKO mice (n = 3 each). Nkcc1 and β-actin protein of expected approximate apparent molecular mass (Nkcc1: ~140 kDa and β-actin: ~45 kDa) were detected, as indicated. The dashed line represents where the membrane was cut. B: semiquantitative densitometry analysis of Nkcc1 levels relative to β-actin (n = 6). C: schematic representation of Nkcc2a, Nkcc2b, and Nkcc2f transcripts along with accession numbers. The full-length coding regions and their corresponding exons are indicated as white and gray arrowed boxes, respectively. The exons defining Nkcc2a, Nkcc2b, and Nkcc2f variants are noted. In D and E, the relative positions of the sense and antisense Nkcc2 primers used in RT-PCR experiments are indicated as opposite arrowheads. D: representative RT-PCR experiments demonstrating transcript expression of Nkcc2 in freshly isolated primary islets obtained from Nkcc2aWT mice but not in those from Nkcc2aKO. Shown are amplicons of expected lengths for Nkcc2a (700 bp). As positive and negative controls, RT-PCRs were directed by using Gapdh primers (555 bp) with or without total RNA. E: Nkcc2 transcript expression in kidney obtained from Nkcc2aWT and Nkcc2aKO mice.
Fig. 7.
Fig. 7.
Pancreatic islets of Nkcc2aWT and Nkcc2aKO mice express Nkcc1 and Kcc2. Representative immunofluorescence microscopy images of Nkcc2aWT (AH) and Nkcc2aKO (IP) pancreas sections immunolabeled against Nkcc1 (A), insulin (Ins; B, F, J, and N), Kcc2 (C, G, K, and O), and glucagon (Glc; E and M) using Cy3-, AF488-, or DyLight405-labeled secondary antibodies [red (Kcc2), green (Nkcc1 and glucagon), and white (insulin), respectively]. Superimposed overlays are shown in D, H, L, and P. Scale bars, 25 µm.
Fig. 8.
Fig. 8.
Pancreatic islets of Nkcc2aKO mice express reduced levels of Kcc2. A: representative confocal images of pancreas tissue sections obtained from Nkcc2aWT and Nkcc2aKO mice (top and bottom, respectively) colabeled against Kcc2 (red), insulin (white), and glucagon (green). Overlay combinations of these images are also shown for Nkcc2aWT and Nkcc2aKO sections. Scale bars, 25 µm. B: 3D surface plots of triple-labeled pancreatic islets shown in A. Data were obtained by computing total pixel density of the respective superimposed pictures by using the Interactive 3D Surface Plot plugin of ImageJ (https://imagej.nih.gov/ij/). Scale bars, 25 µm. C: semiquantitation of immunoreactive Kcc2 (IR Kcc2) expressed in islets of the Nkcc2aWT (n = 51) and Nkcc2aKO (n = 95) genotypes. Results are expressed as pixels per µm2 of islet area and were obtained from at least 5 slides obtained from 3 different mice (*P < 0.001). D: original immunoblot of protein extracts (75 µg/lane) corresponding to primary islets obtained from Nkcc2aWT and Nkcc2aKO mice (n = 3 each). Kcc2 and β-actin protein of expected approximate apparent molecular mass (Kcc2: ~120 kDa, β-actin: ~45 kDa) were detected, as indicated. The dashed line represents where the membrane was cut. E: semiquantitative densitometry analysis of Kcc2 expression relative to β-actin (n = 3, *P < 0.001).
Fig. 9.
Fig. 9.
Increased islet area, α- and β-cell mass in pancreas sections of Nkcc2aKO mice. AC: Shown are the islet (n = 20, each genotype) surface areas expressed in µm2 (A, means ± SE, *P < 0.05), α- and β-cell number per islet (B, means ± SE, *P < 0.05), and estimated α- and β-cell volume expressed in pL (C, means ± SE, *P < 0.05) computed on high-resolution immunofluorescence microscopy images obtained from 10 to 15 pancreas sections (n = 3 mice, each genotype). D: representative confocal immunofluorescence microscopy images of pancreas obtained from Nkcc2aWT and Nkcc2aKO mice (top and bottom, respectively). Scale bars, 25 µm.

Similar articles

Cited by

References

    1. Abramoff MD, Magalhães PJ, Ram SJ. Image processing using ImageJ. Biophoton Int 11: 36–42, 2004.
    1. Alsahli M, Gerich JE. Renal glucose metabolism in normal physiological conditions and in diabetes. Diabetes Res Clin Pract 133: 1–9, 2017. doi:10.1016/j.diabres.2017.07.033. - DOI - PubMed
    1. Alshahrani S, Almutairi MM, Kursan S, Dias-Junior E, Almiahuob MM, Aguilar-Bryan L, Di Fulvio M. Increased Slc12a1 expression in β-cells and improved glucose disposal in Slc12a2 heterozygous mice. J Endocrinol 227: 153–165, 2015. doi:10.1530/JOE-15-0327. - DOI - PMC - PubMed
    1. Alshahrani S, Alvarez-Leefmans FJ, Di Fulvio M. Expression of the Slc12a1 gene in pancreatic β-cells: molecular characterization and in silico analysis. Cell Physiol Biochem 30: 95–112, 2012. doi:10.1159/000339050. - DOI - PubMed
    1. Alshahrani S, Di Fulvio M. Enhanced insulin secretion and improved glucose tolerance in mice with homozygous inactivation of the Na+K+2Cl− co-transporter 1. J Endocrinol 215: 59–70, 2012. doi:10.1530/JOE-12-0244. - DOI - PubMed

Publication types

MeSH terms