. 2019 Sep 1;122(3):1147-1162.
doi: 10.1152/jn.00228.2019. Epub 2019 Jul 31.

Beta-band motor unit coherence and nonlinear surface EMG features of the first dorsal interosseous muscle vary with force

Affiliations

Beta-band motor unit coherence and nonlinear surface EMG features of the first dorsal interosseous muscle vary with force

Lara McManus et al. J Neurophysiol. .

Abstract

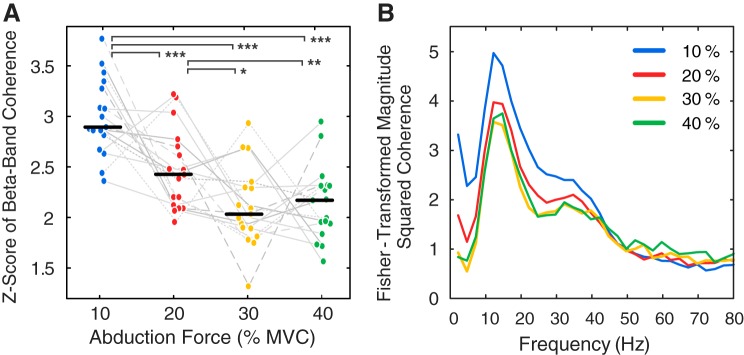
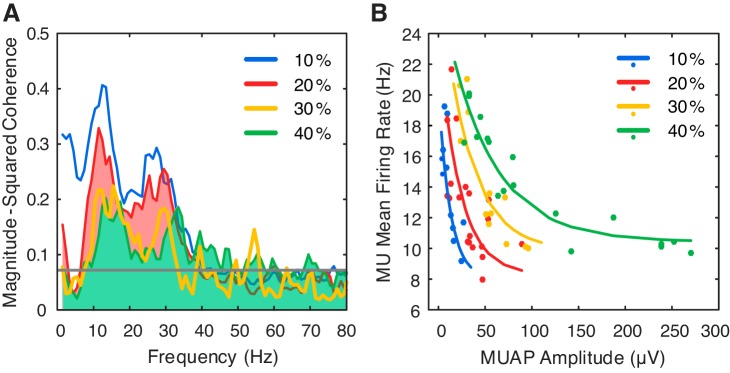
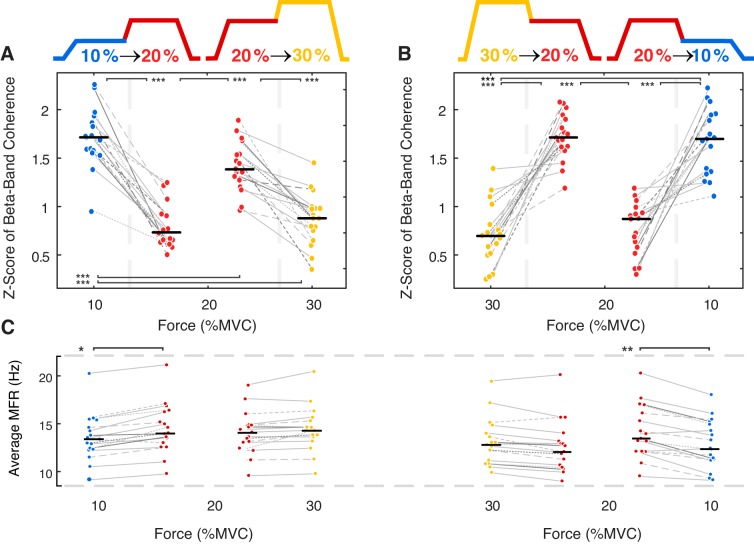
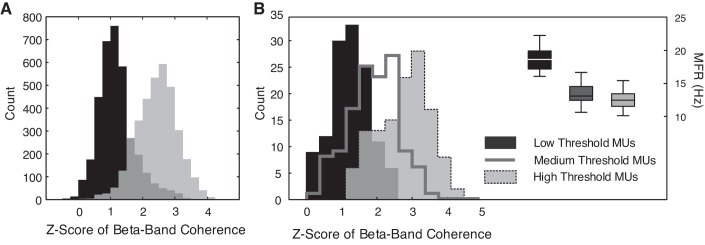
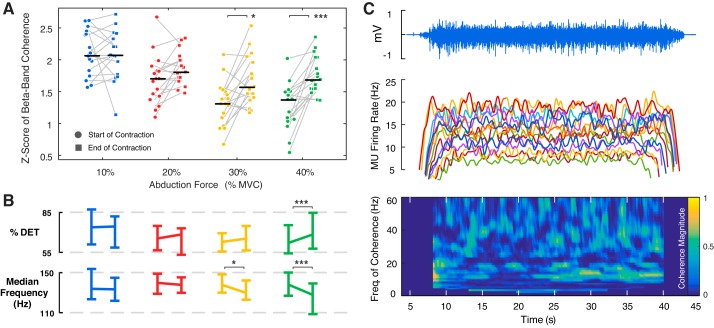
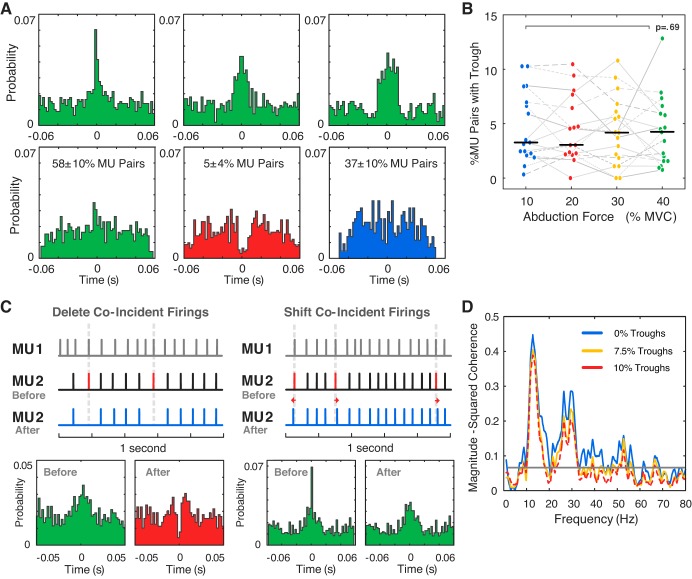
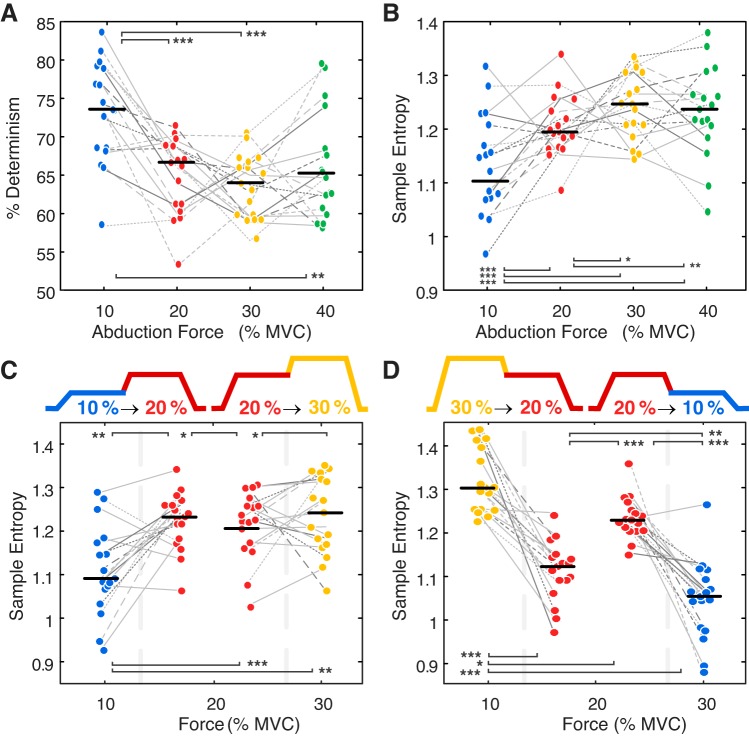
Motor unit firing times are weakly coupled across a range of frequencies during voluntary contractions. Coherent activity within the beta-band (15-35 Hz) has been linked to oscillatory cortical processes, providing evidence of functional connectivity between the motoneuron pool and motor cortex. The aim of this study was to investigate whether beta-band motor unit coherence is altered with increasing abduction force in the first dorsal interosseous muscle. Coherence between motor unit firing times, extracted from decomposed surface electromyography (EMG) signals, was investigated in 17 subjects at 10, 20, 30, and 40% of maximum voluntary contraction. Corresponding changes in nonlinear surface EMG features (specifically sample entropy and determinism, which are sensitive to motor unit synchronization) were also examined. A reduction in beta-band and alpha-band coherence was observed as force increased [F(3, 151) = 32, P < 0.001 and F(3, 151) = 27, P < 0.001, respectively], accompanied by corresponding changes in nonlinear surface EMG features. A significant relationship between the nonlinear features and motor unit coherence was also detected (r = -0.43 ± 0.1 and r = 0.45 ± 0.1 for sample entropy and determinism, respectively; both P < 0.001). The reduction in beta-band coherence suggests a change in the relative contribution of correlated and uncorrelated presynaptic inputs to the motoneuron pool, and/or a decrease in the responsiveness of the motoneuron pool to synchronous inputs at higher forces. The study highlights the importance of considering muscle activation when investigating changes in motor unit coherence or nonlinear EMG features and examines other factors that can influence coherence estimation.NEW & NOTEWORTHY Intramuscular alpha- and beta-band coherence decreased as muscle contraction force increased. Beta-band coherence was higher in groups of high-threshold motor units than in simultaneously active lower threshold units. Alterations in motor unit coherence with increases or decreases in force and with the onset of fatigue were accompanied by corresponding changes in surface electromyography sample entropy and determinism. Mixed-model analysis indicated mean firing rate and number of motor units also influenced the coherence estimate.

Keywords: EMG; coherence; determinism; motor unit; sample entropy.


Conflict of interest statement

No conflicts of interest, financial or otherwise, are declared by the authors.

Figures

Fig. 1.
Fig. 1.
A: median and interquartile range of the Fisher-transformed coherence values in the beta-band range across all subjects. Differences in motor unit (MU) coherence between force levels were tested with pairwise comparisons of least-square means using all trials (n = 171 trials, see Table 1 for average MU number per trial) while adjusting for the effect of the number of MU in the coherence calculation and mean firing rate. B: composite coherence spectrum across all subjects, averaged across all subjects and trials (in 2.5-Hz bins). *P < 0.05; **P < 0.01; ***P < 0.001. MVC, maximal voluntary contraction.
Fig. 2.
Fig. 2.
Magnitude-squared coherence spectrum for a single subject, averaged across all trials (in 1-Hz bins) (A) and the motor unit (MU) mean firing rates as a function of the MU action potential (MUAP) size within a single representative trial at each force level (fit with a stretched exponential function) (B).
Fig. 3.
Fig. 3.
Power spectral density of two motor unit (MU) pulse trains for a representative 20% maximal voluntary contraction trial, their respective firing rates [MU 1: interpulse interval (IPI) = 0.052 ± 0.013 s and MU 1: IPI = 0.085 ± 0.026 s], and the coherence estimate obtained for the MU pair are shown (A). Power spectral density is presented for the summed MU pulse trains in the same trial in groups of 6 MUs (B), 10 MUs (C and D), and 20 MUs (E), alongside the composite MU coherence estimate for each group. In (E), interpulse intervals of the raw pulse trains were shuffled to remove any correlation but maintain the same mean firing rates, and the coherence estimate was calculated on the reconstructed pulse trains with shuffled IPIs. A schematic illustrating how a driving oscillation of a particular frequency could modulate MU activity is shown (F) [McAuley and Marsden (2000); reprinted and adapted by permission of Oxford University Press on behalf of the Guarantors of Brain. OUP and the Guarantors of Brain are not responsible or in any way liable for the accuracy of the adaptation. L. McManus is solely responsible for the adaptation in this publication]. A synchronous input can induce an MU to fire earlier than a similar unsynchronized input, so that the MU has a higher probability of firing with each 30 or 10 Hz input. An external periodic signal can thus modulate MU firing patterns to produce coherence peaks at frequencies distinct from the MU mean firing rates.
Fig. 4.
Fig. 4.
Median and interquartile range of the Fisher-transformed coherence values in the beta-band range during the first and second half of a trial with two contraction force levels. Both increasing (A) and decreasing (B) force trials are shown. Changes in motor unit (MU) mean firing rates (MFRs) during the two force level trials are shown (C). Differences in MU coherence and MU MFR between force levels were tested with pairwise comparisons of least-square means using both the low- and high-force sections of all trials (n = 142 trials, see Table 1 for average MU number per trial), with differences in MU coherence adjusted for the effect of the number of MUs used in the coherence calculation and MFR. *P < 0.05; **P < 0.01; ***P < 0.001. MVC, maximal voluntary contraction.
Fig. 5.
Fig. 5.
A: distribution of the Fisher-transformed coherence values in the beta-band range for the 8 smallest motor units (MUs) (low threshold) and the 8 largest MUs (high threshold) across all subjects at 40% maximal voluntary contraction [MVC; data from each subject was normalized to minimize the contribution of intersubject variance (Loftus and Masson 1994)]. B: distribution of the Fisher-transformed coherence for a single trial in a representative subject at 20% MVC, with the coherence and MU mean firing rates (MFRs) calculated for three groups of 10 MUs arranged in order of size.
Fig. 6.
Fig. 6.
A: median and interquartile range of the Fisher-transformed coherence values in the beta-band range during the first and second half of the constant force contraction across all subjects. B: median and SD of the percentage determinism (%DET) and the median frequency of the surface electromyography (EMG) signal. C: surface EMG, motor unit (MU) mean firing rates, and the wavelet coherence during a single force trial at 30% maximal voluntary contraction (MVC) in a representative subject. *P < 0.05; ***P < 0.001.
Fig. 7.
Fig. 7.
A: sample cross-correlograms between pairs of motor unit (MU) pulse trains. Across all trials, ~58 ± 10% of MU pairs had a narrow or broad peak (of varying amplitude) centered at approximately zero lag in the cross-correlogram (green), 5 ± 4% had a dip or trough at zero lag (red), and 37 ± 10% showed no distinct peaks or troughs (blue). B: percentage of the MU pairs that exhibited a trough at zero lag in the cross-correlogram at each force level for all subjects (median over all subjects shown in black). C: troughs could be artificially induced in the cross-correlogram for an MU pair by deleting coincident firing times in one MU (MU2) relative to the other reference unit (MU1). A broader, less-distinct peak in the correlogram was observed when firing times were shifted (by 3 ms or less) in MU2 relative to coincident firings in MU1. D: changes in the coherence spectrum after the deletion of coincident firings in selected MUs for a trial in which no troughs were originally detected. Troughs were artificially induced in 1) 7.5% of all MU pairs (2 of 15 MUs indicated for removal) and 2) 10% of all MU pairs (3 of 15 MUs indicated for removal). MVC, maximal voluntary contraction.
Fig. 8.
Fig. 8.
Median and interquartile range of the sample entropy (A) and percentage determinism (%DET; B) calculated from the surface electromyography (EMG) signal during the constant force trials at 10, 20, 30, and 40% maximal voluntary contraction (MVC). Both increasing (A) and decreasing (B) force trials are shown. The sample entropy (SampEn) of the surface EMG signal was calculated for the first and second half of the trials with two contraction force levels, with both increasing (C) and decreasing force trials shown (D). Differences in SampEn and %DET between force levels were tested with pairwise comparisons of least-square means using all constant force (n = 171 trials) and two-force trials (n = 142 trials; see Table 1 for average MU number per trial). *P < 0.05; **P < 0.01; ***P < 0.001.

Similar articles

Cited by

References

    1. Alstermark B, Isa T. Circuits for skilled reaching and grasping. Annu Rev Neurosci 35: 559–578, 2012. doi:10.1146/annurev-neuro-062111-150527. - DOI - PubMed
    1. Bakdash JZ, Marusich LR. Repeated measures correlation. Front Psychol 8: 456, 2017. [Erratum in Front Psychol 10: 1201, 2019.] doi:10.3389/fpsyg.2017.00456. - DOI - PMC - PubMed
    1. Baker SN. The primate reticulospinal tract, hand function and functional recovery. J Physiol 589: 5603–5612, 2011. doi:10.1113/jphysiol.2011.215160. - DOI - PMC - PubMed
    1. Baker SN, Chiu M, Fetz EE. Afferent encoding of central oscillations in the monkey arm. J Neurophysiol 95: 3904–3910, 2006. doi:10.1152/jn.01106.2005. - DOI - PubMed
    1. Baker SN, Pinches EM, Lemon RN. Synchronization in monkey motor cortex during a precision grip task. II. Effect of oscillatory activity on corticospinal output. J Neurophysiol 89: 1941–1953, 2003. doi:10.1152/jn.00832.2002. - DOI - PubMed

Publication types

LinkOut - more resources