

Identifying important parameters in the inflammatory process with a mathematical model of immune cell influx and macrophage polarization
- PMID: 31365522
- PMCID: PMC6690555
- DOI: 10.1371/journal.pcbi.1007172
Identifying important parameters in the inflammatory process with a mathematical model of immune cell influx and macrophage polarization
Abstract
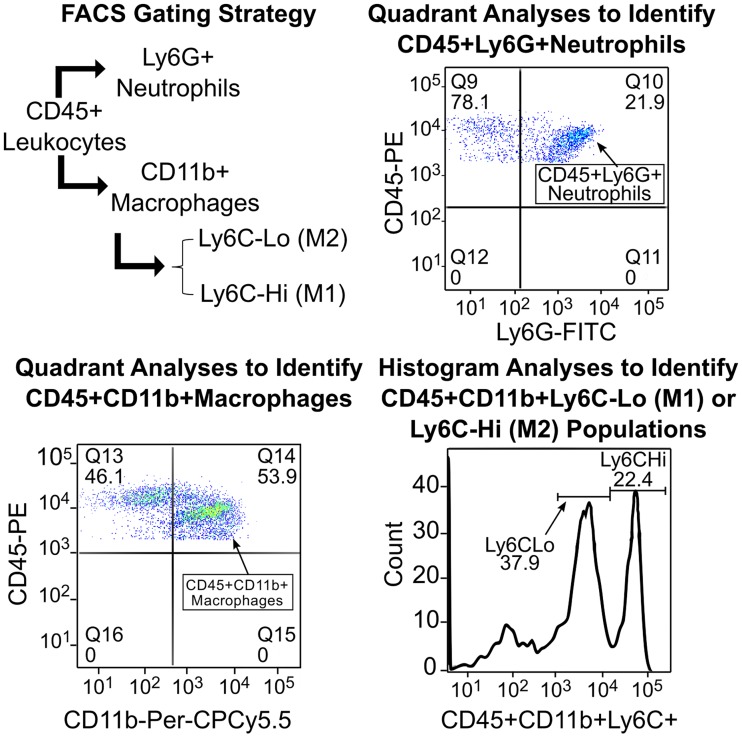
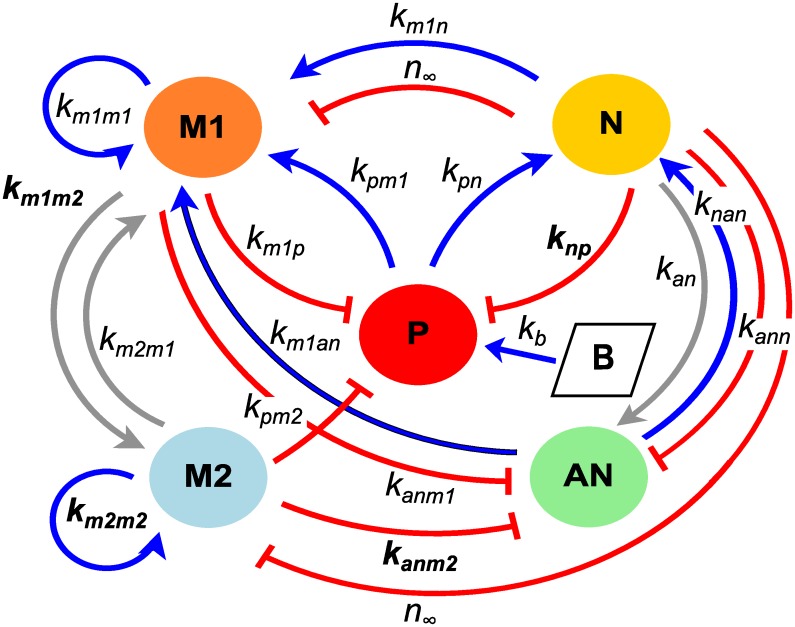
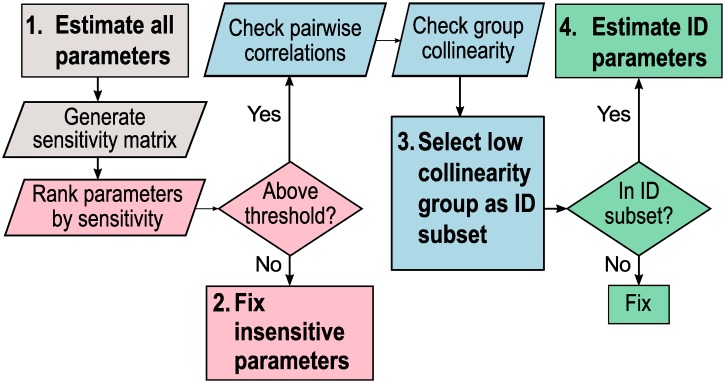
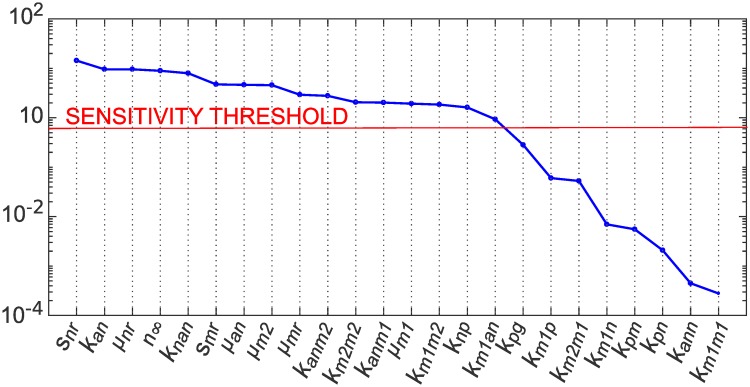
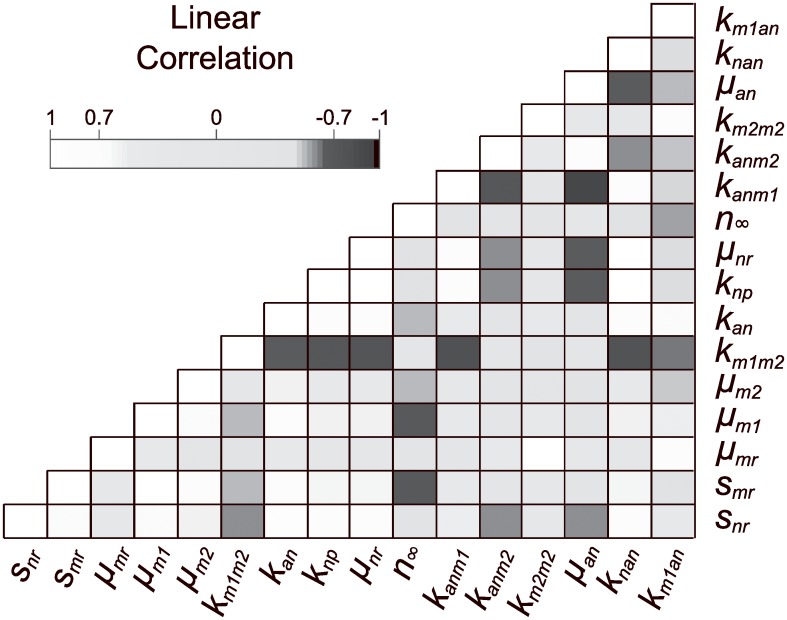
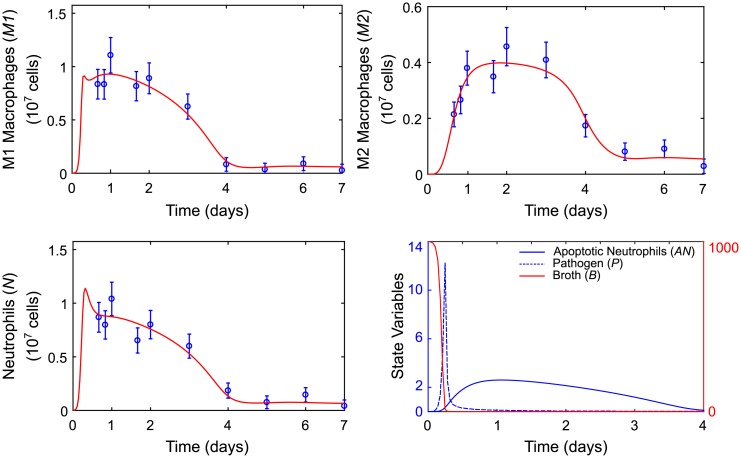
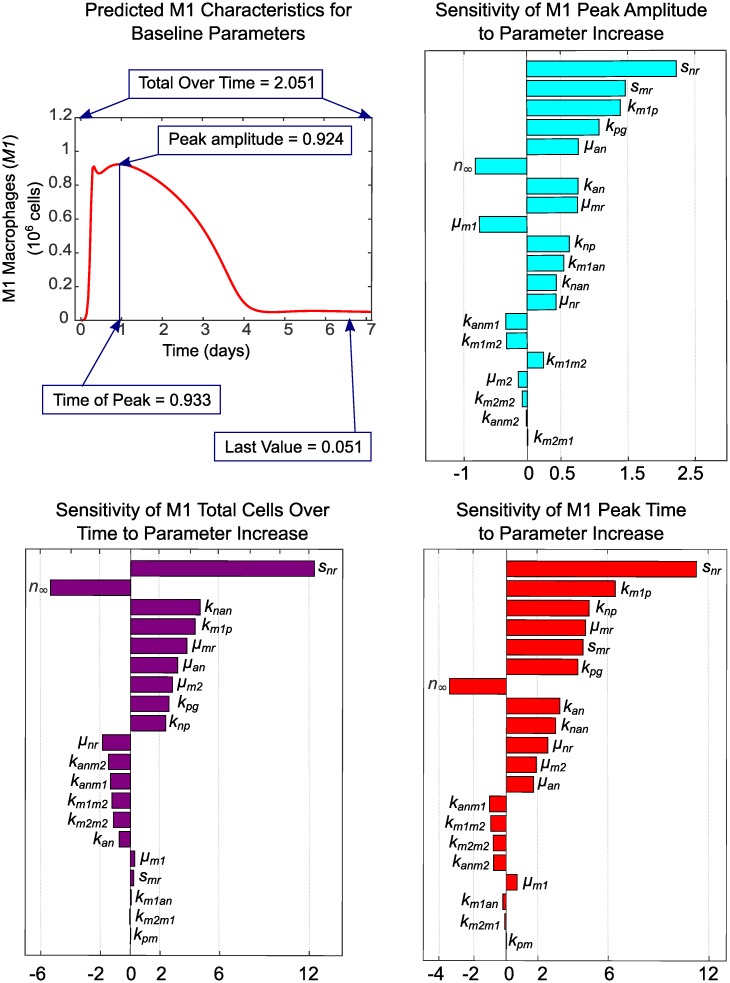
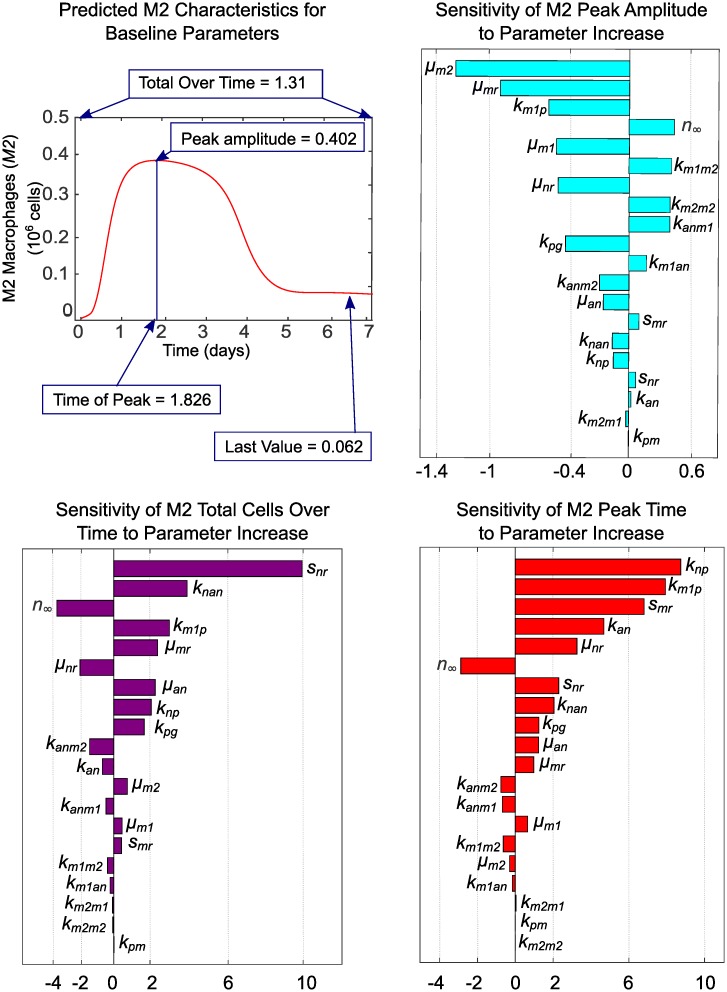
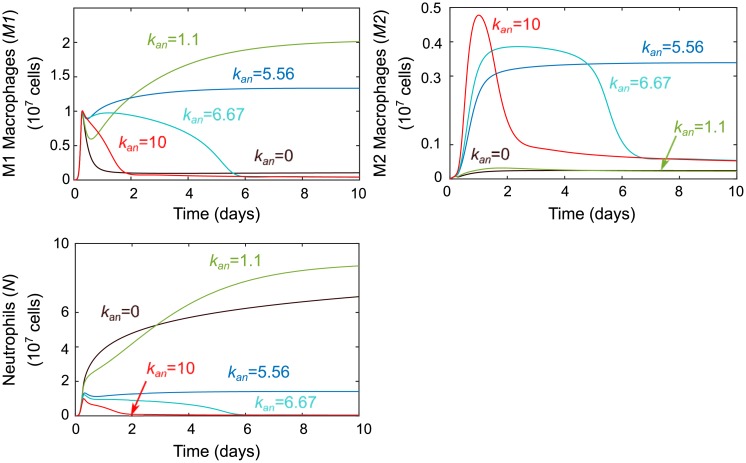
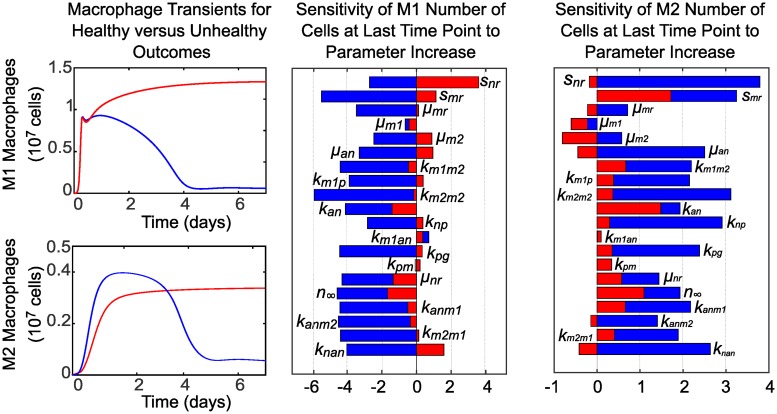
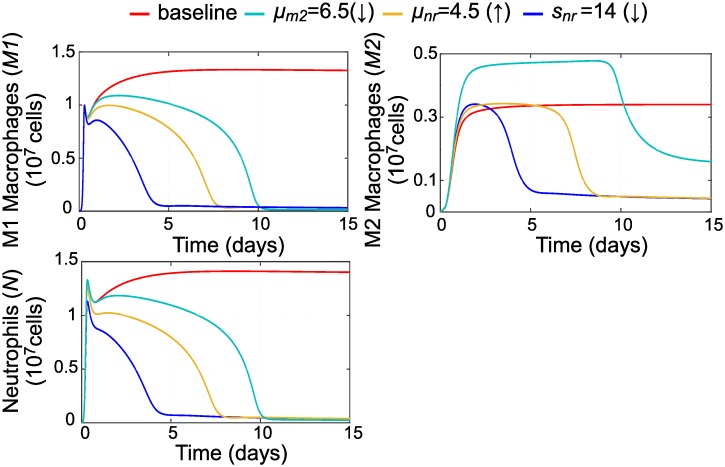
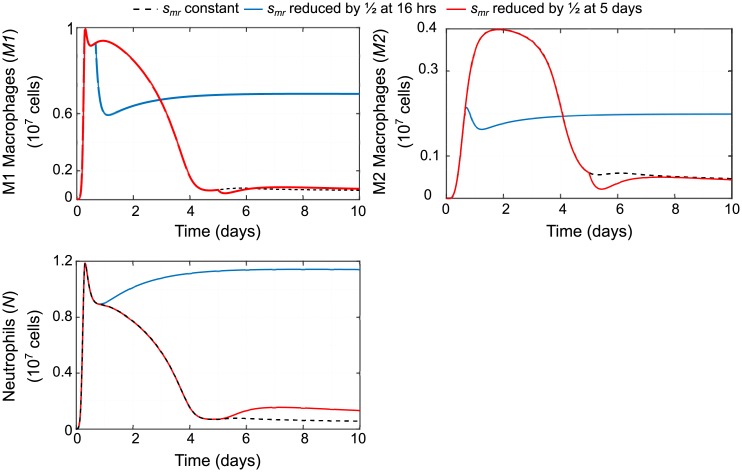
In an inflammatory setting, macrophages can be polarized to an inflammatory M1 phenotype or to an anti-inflammatory M2 phenotype, as well as existing on a spectrum between these two extremes. Dysfunction of this phenotypic switch can result in a population imbalance that leads to chronic wounds or disease due to unresolved inflammation. Therapeutic interventions that target macrophages have therefore been proposed and implemented in diseases that feature chronic inflammation such as diabetes mellitus and atherosclerosis. We have developed a model for the sequential influx of immune cells in the peritoneal cavity in response to a bacterial stimulus that includes macrophage polarization, with the simplifying assumption that macrophages can be classified as M1 or M2. With this model, we were able to reproduce the expected timing of sequential influx of immune cells and mediators in a general inflammatory setting. We then fit this model to in vivo experimental data obtained from a mouse peritonitis model of inflammation, which is widely used to evaluate endogenous processes in response to an inflammatory stimulus. Model robustness is explored with local structural and practical identifiability of the proposed model a posteriori. Additionally, we perform sensitivity analysis that identifies the population of apoptotic neutrophils as a key driver of the inflammatory process. Finally, we simulate a selection of proposed therapies including points of intervention in the case of delayed neutrophil apoptosis, which our model predicts will result in a sustained inflammatory response. Our model can therefore provide hypothesis testing for therapeutic interventions that target macrophage phenotype and predict outcomes to be validated by subsequent experimentation.
Conflict of interest statement
The authors have declared that no competing interests exist.
Figures
Similar articles
-
Macrophages: The Good, the Bad, and the Gluttony.Front Immunol. 2021 Aug 12;12:708186. doi: 10.3389/fimmu.2021.708186. eCollection 2021. Front Immunol. 2021. PMID: 34456917 Free PMC article. Review.
-
The resolution of inflammation: a mathematical model of neutrophil and macrophage interactions.Bull Math Biol. 2014 Aug;76(8):1953-80. doi: 10.1007/s11538-014-9987-x. Epub 2014 Jul 23. Bull Math Biol. 2014. PMID: 25053556
-
Azithromycin reduces exaggerated cytokine production by M1 alveolar macrophages in cystic fibrosis.Am J Respir Cell Mol Biol. 2009 Nov;41(5):590-602. doi: 10.1165/rcmb.2008-0155OC. Epub 2009 Feb 24. Am J Respir Cell Mol Biol. 2009. PMID: 19244203
-
Mechanisms and Points of Control in the Spread of Inflammation: A Mathematical Investigation.Bull Math Biol. 2020 Mar 28;82(4):45. doi: 10.1007/s11538-020-00709-y. Bull Math Biol. 2020. PMID: 32222839 Free PMC article.
-
Chemopreventive Effects of Phytochemicals and Medicines on M1/M2 Polarized Macrophage Role in Inflammation-Related Diseases.Int J Mol Sci. 2018 Jul 28;19(8):2208. doi: 10.3390/ijms19082208. Int J Mol Sci. 2018. PMID: 30060570 Free PMC article. Review.
Cited by
-
Unraveling Macrophage Polarization: Functions, Mechanisms, and "Double-Edged Sword" Roles in Host Antiviral Immune Responses.Int J Mol Sci. 2024 Nov 10;25(22):12078. doi: 10.3390/ijms252212078. Int J Mol Sci. 2024. PMID: 39596148 Free PMC article. Review.
-
Characterization of differences in immune responses during bolus and continuous infusion endotoxin challenges using mathematical modelling.Exp Physiol. 2024 May;109(5):689-710. doi: 10.1113/EP091552. Epub 2024 Mar 11. Exp Physiol. 2024. PMID: 38466166 Free PMC article.
-
Agent-based vs. equation-based multi-scale modeling for macrophage polarization.PLoS One. 2024 Jan 25;19(1):e0270779. doi: 10.1371/journal.pone.0270779. eCollection 2024. PLoS One. 2024. PMID: 38271449 Free PMC article.
-
Exploring the constituent mechanisms of hepatitis: a dynamical systems approach.Math Med Biol. 2023 Mar 13;40(1):24-48. doi: 10.1093/imammb/dqac013. Math Med Biol. 2023. PMID: 36197900 Free PMC article.
-
Unraveling host-pathogen dynamics in a murine Model of septic peritonitis induced by vancomycin-resistant Enterococcus faecium.Virulence. 2024 Dec;15(1):2367659. doi: 10.1080/21505594.2024.2367659. Epub 2024 Jul 1. Virulence. 2024. PMID: 38951957 Free PMC article.
References
-
- Duffield JS. The inflammatory macrophage: a story of Jekyll and Hyde. Clinical science. 2003;104(1):27–38. - PubMed
Publication types
MeSH terms
Substances
Grants and funding
LinkOut - more resources
Full Text Sources
