

Interaction between dietary fatty acids and genotype on immune response in Atlantic salmon (Salmo salar) after vaccination: A transcriptome study
- PMID: 31365530
- PMCID: PMC6668776
- DOI: 10.1371/journal.pone.0219625
Interaction between dietary fatty acids and genotype on immune response in Atlantic salmon (Salmo salar) after vaccination: A transcriptome study
Abstract
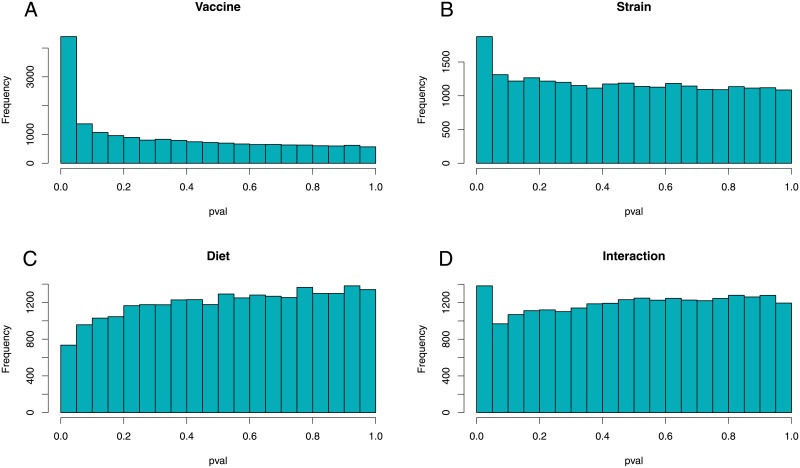
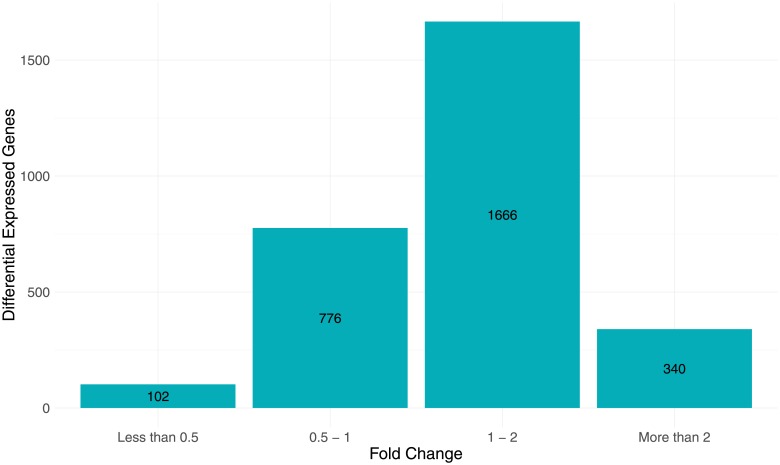
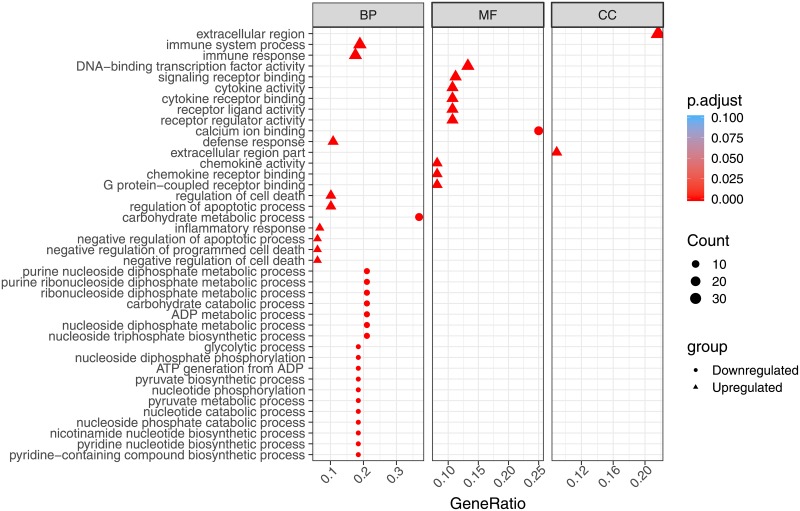
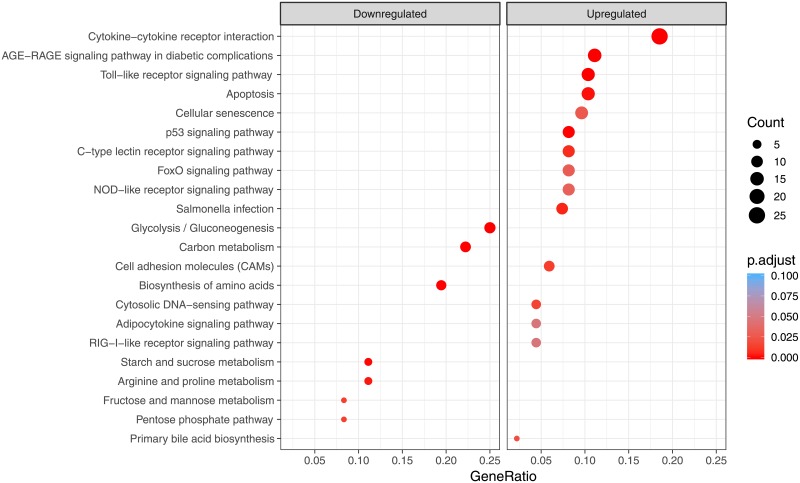
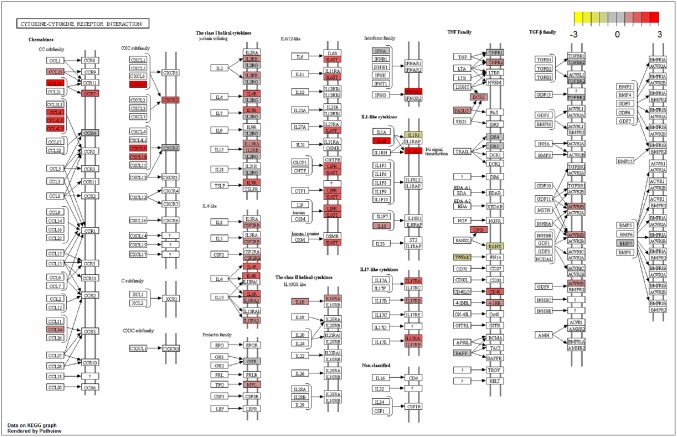
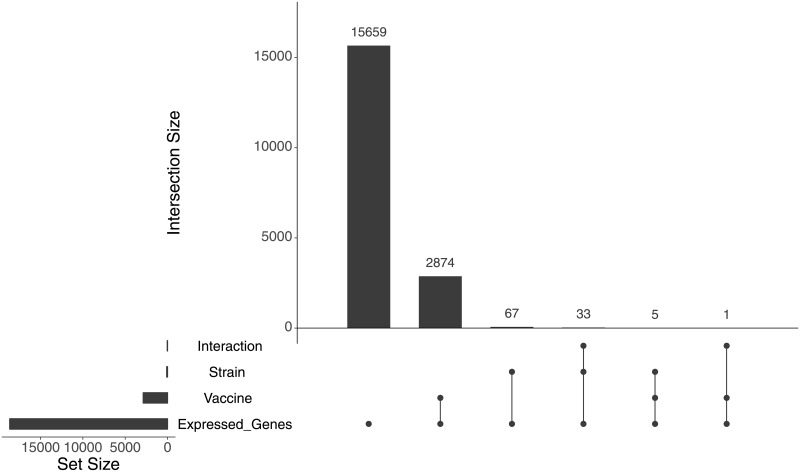
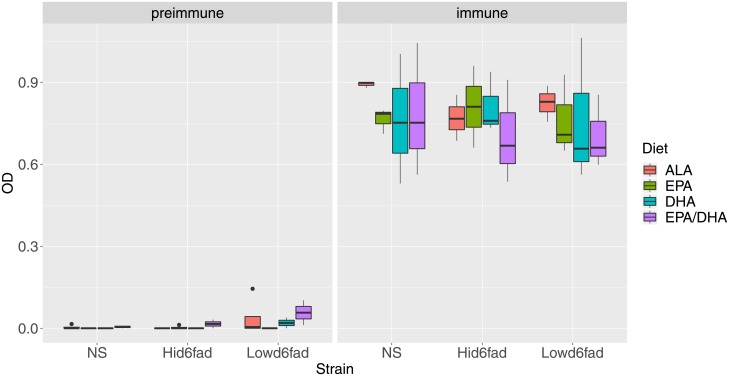
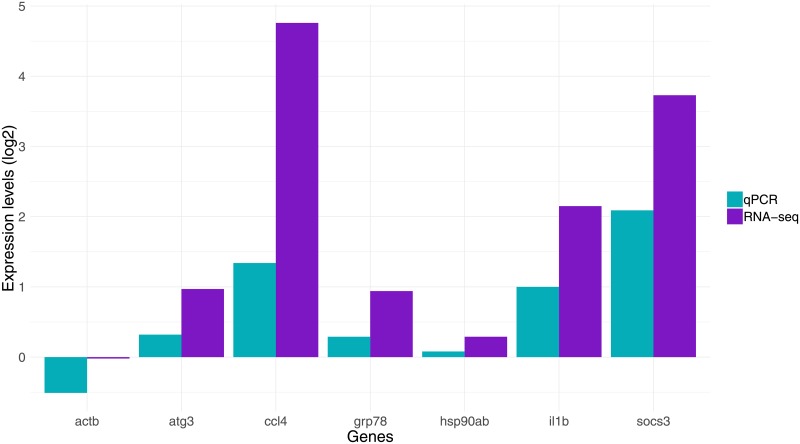
A pivotal matter to aquaculture is the sourcing of sustainable resources as ingredients to aquafeeds. Levels of plant delivered oils as source of fatty acids (FA) in aquafeeds have reached around 70% resulting in reduced levels of long-chain omega-3 polyunsaturated fatty acids (LC n-3 PUFA), such as eicosapentaenoic acid (EPA) and docosahexaenoic acid (DHA), in salmon fillet composition. EPA and DHA can modulate inflammation and immune response, so it is crucial to understand how fish immune response is affected by low LC n-3 PUFA diet and if this diet can have a detrimental effect on vaccine response. Atlantic salmon (Salmo salar) can produce EPA/DHA from α-linolenic acid (ALA) and this endogenous capacity can be explored to develop families with higher tolerance to low LC n-3 PUFA diets. Here we analyze innate and adaptive immune response in Atlantic salmon to a commercial vaccine after being fed low levels of EPA and DHA, and we also compare three strains of salmon selected by their endogenous capacity of synthesizing LC- n-3 PUFA. A total of 2,890 differentially expressed genes (DEGs) were identified (p-value adjusted < 0.1) when comparing vaccinated fish against control non-vaccinated. Gene ontology (GO) and KEGG analysis with 442 up/downregulated genes revealed that most DEGs were both related to immune response as well as part of important immune related pathways, as "Toll-like receptor" and "Cytokine-Cytokine interaction". Adaptive response was also addressed by measuring antigen specific IgM, and titers were significantly higher than in the pre-immune fish at 62 days post-immunization. However, diet and strain had no/little effect on vaccine-specific IgM or innate immune responses. Atlantic salmon therefore display robustness in its response to vaccination even when feed low levels of LC n-3 PUFA.
Conflict of interest statement
The authors have declared that no competing interests exist.
Figures
References
-
- FAO Yearbook. Fisheries and aquaculture statitstics 2016/FAO annuarie. FAO2018. p. 108.
-
- Sarker PK, Kapuscinski AR, Bae AY, Donaldson E, Sitek AJ, Fitzgerald DS, et al. Towards sustainable aquafeeds: Evaluating substitution of fishmeal with lipid-extracted microalgal co-product (Nannochloropsis oculata) in diets of juvenile Nile tilapia (Oreochromis niloticus). PLOS ONE. 2018;13(7):e0201315 10.1371/journal.pone.0201315 - DOI - PMC - PubMed
-
- FAO. The State of World Fisheries and Aquaculture 2016 (SOFIA) Contributing to food security and nutrition for all. FAO. Rome: Food and Agriculture Organization; 2016. p. 1–106.
-
- FAO. Fisheries and aquaculture software. FishStatJ—software for fishery statistical time series 2018 [cited 2018 08. January]. http://www.fao.org/fishery/.
-
- Gatlin DM, Barrows FT, Brown P, Dabrowski K, Gaylord TG, Hardy RW, et al. Expanding the utilization of sustainable plant products in aquafeeds: a review. Aquaculture Research. 2007;38(6):551–79. 10.1111/j.1365-2109.2007.01704.x - DOI
Publication types
MeSH terms
Substances
LinkOut - more resources
Full Text Sources
Medical
Research Materials
