

Space use of Pacific harbor seals (Phoca vitulina richardii) from two haulout locations along the Oregon coast
- PMID: 31365532
- PMCID: PMC6668786
- DOI: 10.1371/journal.pone.0219484
Space use of Pacific harbor seals (Phoca vitulina richardii) from two haulout locations along the Oregon coast
Abstract
Background: There are approximately 10,000-12,000 Pacific harbor seals (Phoca vitulina richardii) inhabiting the Oregon coast, and unlike other species of pinnipeds in this region, are reliably present year-round. Despite this, and drastic rebounds in population since the enactment of the Marine Mammal Protection Act, limited data is available for the present period regarding their space use at sea, and within estuarine, riverine, or bay areas within the state.
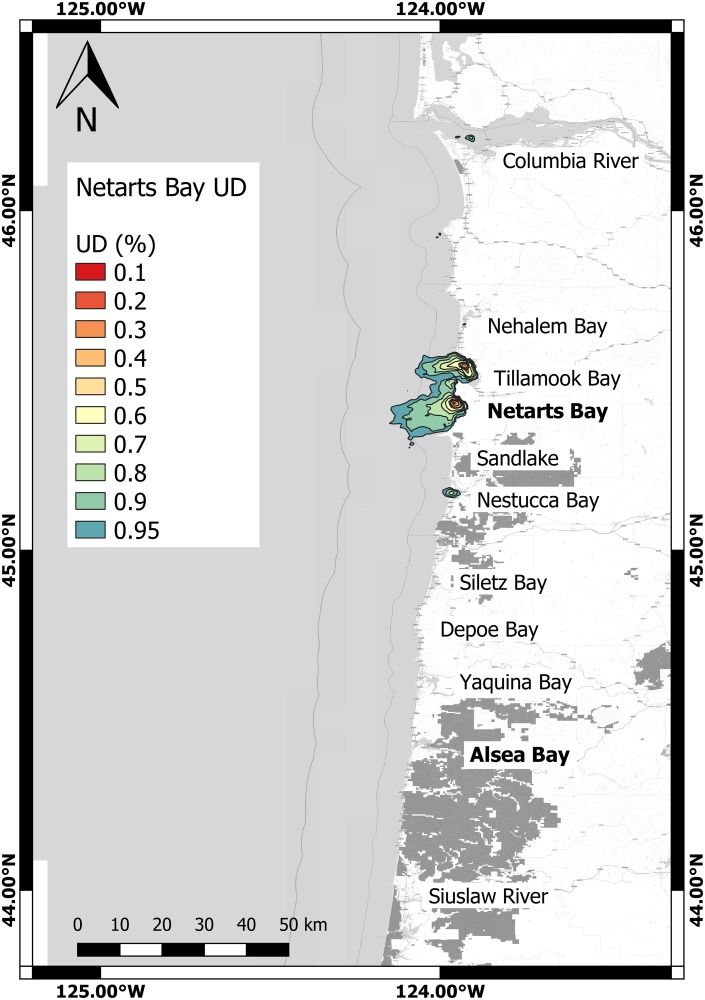
Objective: To examine site-based differences in space use for 24 adult Pacific harbor seals captured and outfitted with satellite transmitters at two predominant haulout sites on the Oregon Coast, USA.
Design: We captured 24 adult harbor seals from two haulout sites on the Central Oregon coast between September 2014-16 and fitted them with external Wildlife Computers SPOT5 satellite transmitters to track movement. Using state-space modeled locations derived from satellite telemetry data, we evaluated spatial behavior of these animals using a correlated random walk model via R package crawl. Kernel density estimation was subsequently used to calculate home range and core area for each animal. Percent use of open ocean habitat versus use of estuaries, rivers and bays was quantified, as was an initial examination of presence within five newly-established marine reserves in Oregon. Examination of haulout site-related differences in spatial behavior were examined for seals captured in Netarts and Alsea Bays, Oregon and haul out behavior related to time of day, season, and tidal level was also investigated.
Results: The average individual home range for seals was 364.47 ± 382.87 km2 with seals captured in Alsea bay demonstrating a significantly higher home range area than those captured in Netarts Bay. Alsea bay seals also tended to range farther from shore than Netarts Bay animals. The average calculated core area for seals encompassed on average 29.41 ± 29.23 km2 per animal, however the home range of one animal was so small, core area could not be calculated. Use of marine reserves was limited for animals in this study, representing less than 2% of locations with a majority occurring in Cape Perpetua Marine Reserve and North Marine Protected Area. Seals were more likely to haul out during low tides and periods of low light (dusk, night and dawn), and hauling out behavior increased in winter months.
Significance: These findings demonstrate the first major documentation of space use of harbor seals in the state for nearly three decades, and lends itself to future comparison and formation of mechanistically-based hypotheses for behavior of a common marine mammal in the highly productive northern California Current System.
Conflict of interest statement
The authors have declared that no competing interests exist.
Figures


Similar articles
-
Long distance movements and disjunct spatial use of harbor seals (Phoca vitulina) in the inland waters of the Pacific Northwest.PLoS One. 2012;7(6):e39046. doi: 10.1371/journal.pone.0039046. Epub 2012 Jun 18. PLoS One. 2012. PMID: 22723925 Free PMC article.
-
Individual-based energetic model suggests bottom up mechanisms for the impact of coastal hypoxia on Pacific harbor seal (Phoca vitulina richardii) foraging behavior.J Theor Biol. 2017 Mar 7;416:190-198. doi: 10.1016/j.jtbi.2017.01.006. Epub 2017 Jan 9. J Theor Biol. 2017. PMID: 28082128
-
Post-breeding season migrations of a top predator, the harbor seal (Phoca vitulina richardii), from a marine protected area in Alaska.PLoS One. 2013;8(2):e55386. doi: 10.1371/journal.pone.0055386. Epub 2013 Feb 14. PLoS One. 2013. PMID: 23457468 Free PMC article.
-
Factors Affecting Haul-Out Behavior of Harbor Seals (Phoca vitulina) in Tidewater Glacier Inlets in Alaska: Can Tourism Vessels and Seals Coexist?PLoS One. 2015 May 27;10(5):e0125486. doi: 10.1371/journal.pone.0125486. eCollection 2015. PLoS One. 2015. PMID: 26017404 Free PMC article.
-
Assessment of harbor seal predation on adult salmonids in a Pacific Northwest estuary.Ecol Appl. 2007 Mar;17(2):338-51. doi: 10.1890/05-1941. Ecol Appl. 2007. PMID: 17489243
References
-
- Carretta JV, Oleson EM, Weller DW, Lang AR, Forney KA, Baker JD, Hanson B, Martien KK, Muto M, Orr AJ, Huber HR. US Pacific marine mammal stock assessments, 2013.
-
- Brown RF, Wright BE, Riemer SD, Laake J. Trends in abundance and current status of harbor seals in Oregon: 1977–2003. Mar Mammal Sci. 2005;21(4): 657–70.
-
- Pearson JP, Verts BJ. Abundance and distribution of harbor seals and northern sea lions in Oregon. The Murrelet. 1970. January 1:1–5.
-
- Huber HR, Jeffries SJ, Brown RF, Delong RL, Vanblaricom G. Correcting aerial survey counts of harbor seals (Phoca vitulina richardsi) in Washington and Oregon. Marine Mammal Science. 2001. April;17(2):276–93.
-
- ODFW. Oregon Department of Fisheries and Wildlife Marine Mammal Program [Internet]. Vol. 2017. 2017. http://www.dfw.state.or.us/MRP/mammals/
Publication types
MeSH terms
Associated data
LinkOut - more resources
Full Text Sources
