. 2019 Jul 31;15(7):e1008304.
doi: 10.1371/journal.pgen.1008304. eCollection 2019 Jul.

Variation and selection on codon usage bias across an entire subphylum

Affiliations

Variation and selection on codon usage bias across an entire subphylum

Abigail L LaBella et al. PLoS Genet. .

Erratum in

Abstract

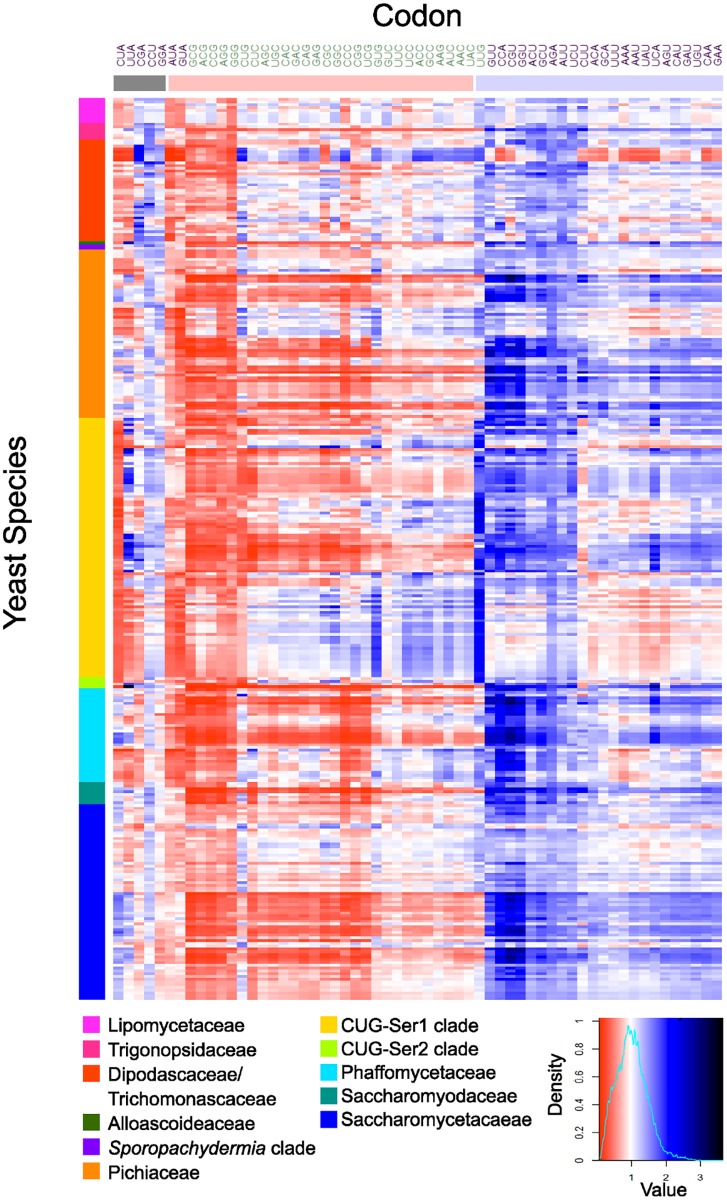
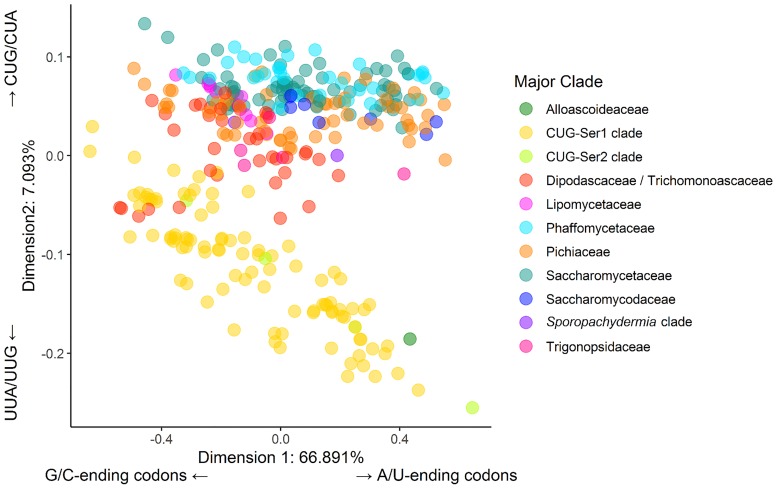
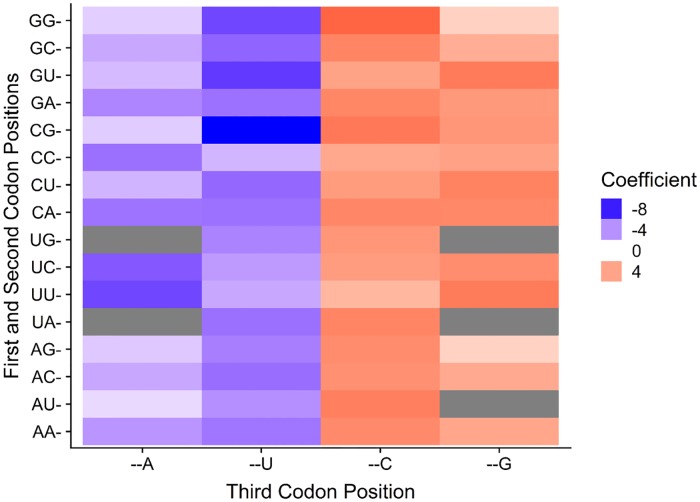
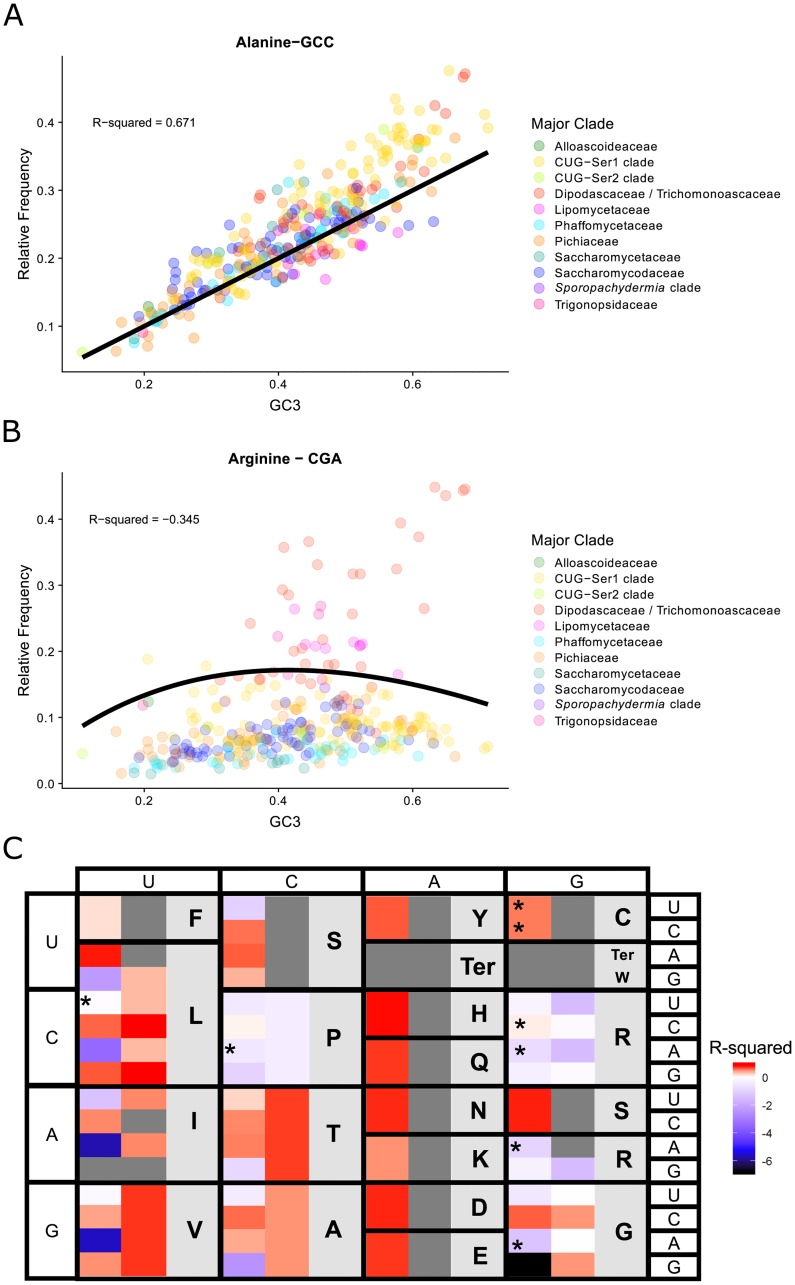
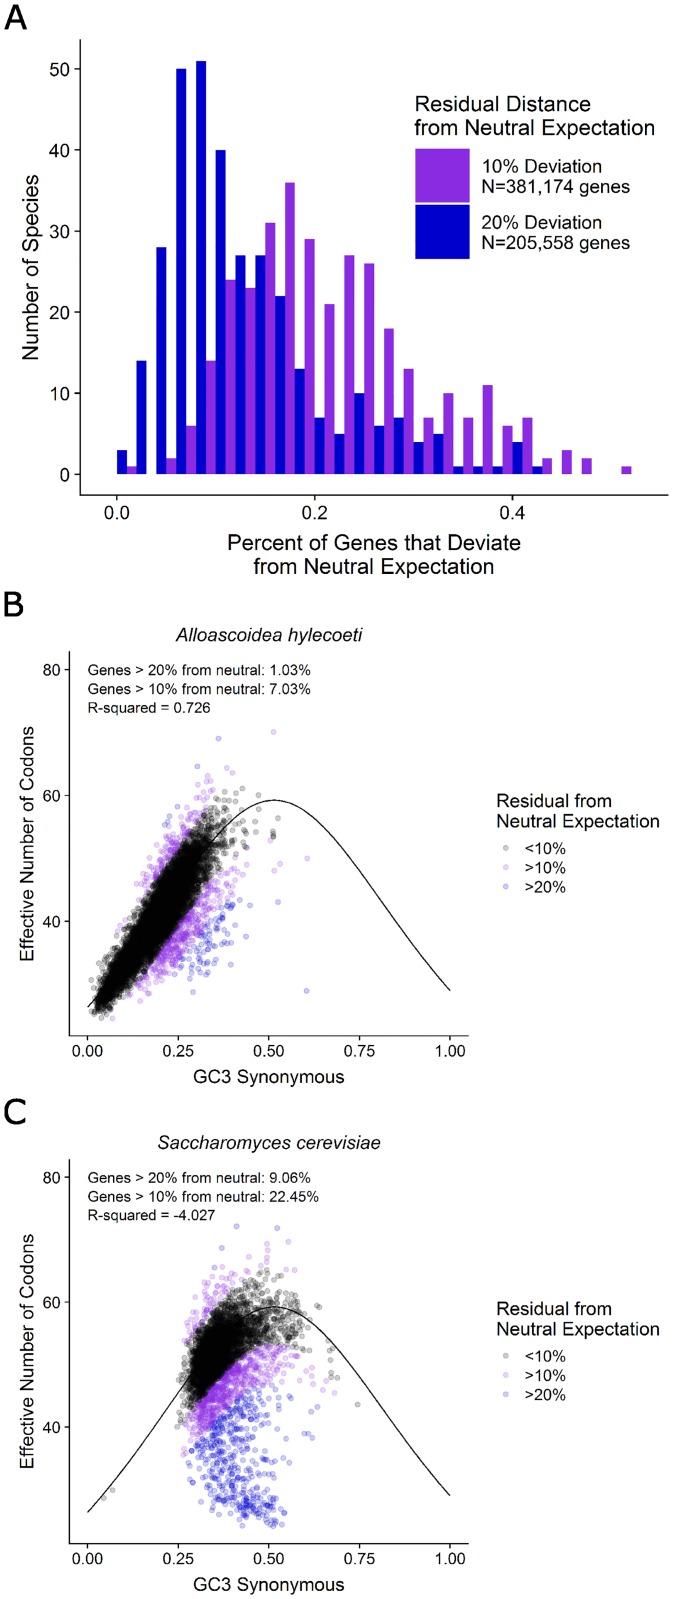
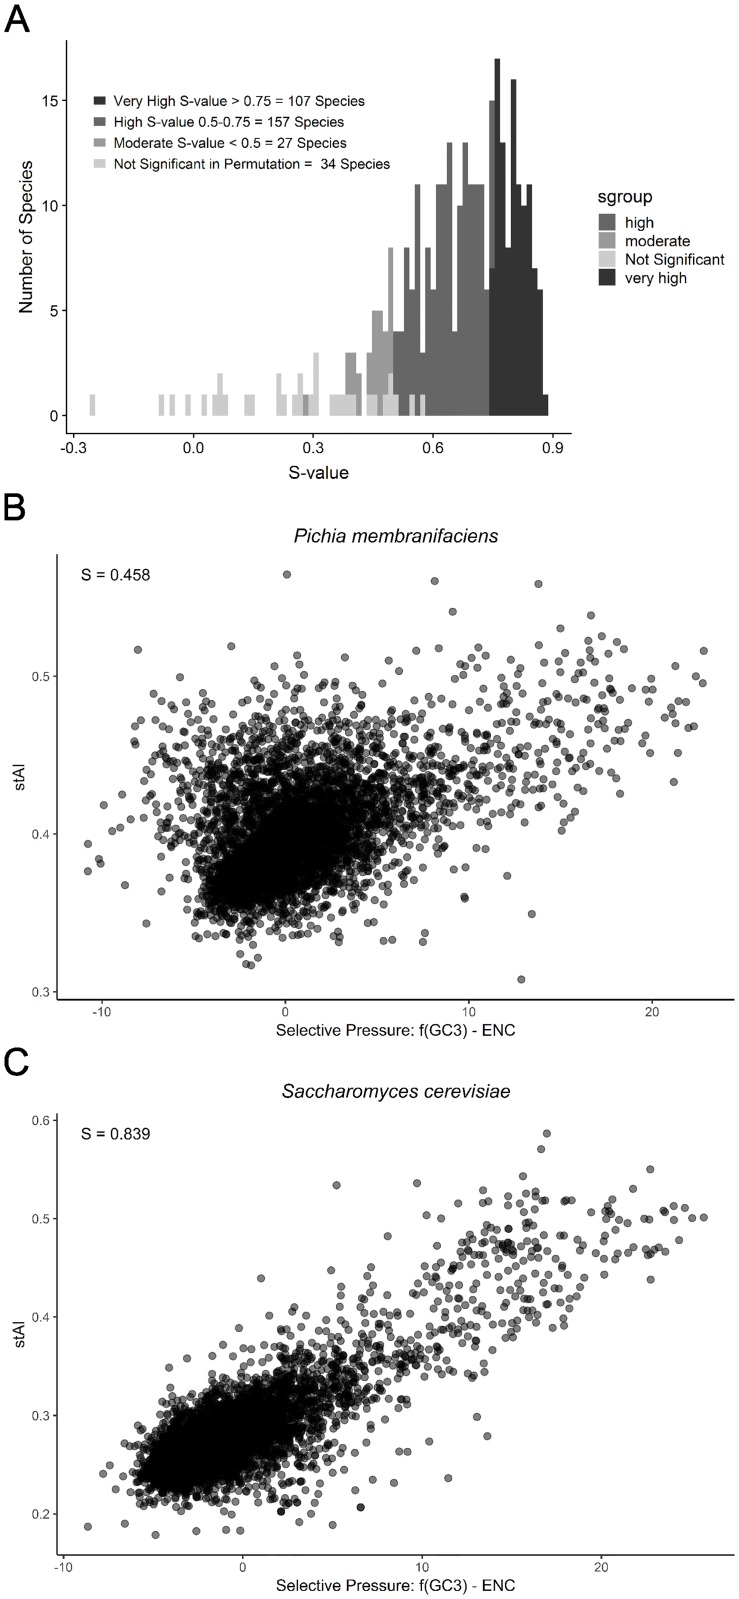
Variation in synonymous codon usage is abundant across multiple levels of organization: between codons of an amino acid, between genes in a genome, and between genomes of different species. It is now well understood that variation in synonymous codon usage is influenced by mutational bias coupled with both natural selection for translational efficiency and genetic drift, but how these processes shape patterns of codon usage bias across entire lineages remains unexplored. To address this question, we used a rich genomic data set of 327 species that covers nearly one third of the known biodiversity of the budding yeast subphylum Saccharomycotina. We found that, while genome-wide relative synonymous codon usage (RSCU) for all codons was highly correlated with the GC content of the third codon position (GC3), the usage of codons for the amino acids proline, arginine, and glycine was inconsistent with the neutral expectation where mutational bias coupled with genetic drift drive codon usage. Examination between genes' effective numbers of codons and their GC3 contents in individual genomes revealed that nearly a quarter of genes (381,174/1,683,203; 23%), as well as most genomes (308/327; 94%), significantly deviate from the neutral expectation. Finally, by evaluating the imprint of translational selection on codon usage, measured as the degree to which genes' adaptiveness to the tRNA pool were correlated with selective pressure, we show that translational selection is widespread in budding yeast genomes (264/327; 81%). These results suggest that the contribution of translational selection and drift to patterns of synonymous codon usage across budding yeasts varies across codons, genes, and genomes; whereas drift is the primary driver of global codon usage across the subphylum, the codon bias of large numbers of genes in the majority of genomes is influenced by translational selection.


Conflict of interest statement

The authors have declared that no competing interests exist.

Figures

Fig 1
Fig 1. Relative synonymous codon usage (RSCU) analysis revealed an overrepresentation of A/Uending codons across most of the Saccharomycotina subphylum.
Columns correspond to the 59 nondegenerate, non-stop codons; A/U-ending codons are shown in in purple font, and GC-ending codons are shown in green font. Rows correspond to the 327 Saccharomycotina species colored by major clade, following the recent genome-scale phylogeny of the subphylum [50]. Blue cells indicate overrepresented codons (RSCU > 1) and red cells indicate underrepresented codons (RSCU < 1). Codons were clustered (using hierarchical clustering) by RSCU value into three general groups (shown by horizontal bars of different colors): underrepresented A/U-ending codons (grey bar), underrepresented codons mostly ending in G/C (red bar), and overrepresented codons mostly ending in A/U (blue bar).
Fig 2
Fig 2. Differences in relative synonymous codon usage values between species are largely driven by variation in the usage of G/C- and A/U-ending codons.
The plot shows each of the 327 budding yeast species examined in this study along the first two dimensions (the X and Y axes) of a correspondence analysis. Each axis is labeled with the percent variance explained by the corresponding dimension and the codons that are the major drivers of the observed variance. The first dimension, which explains nearly 67% of the variation between species, is driven by the differential usage of G/C- versus A/U-ending codons. The second dimension, which differentiates the CUG-Ser1 clade, the CUG-Ser2 clade, and one Alloascoideaceae species from the rest of the species in the subphylum, explains a much smaller fraction of the observed variation (about 7%) and is primarily driven by differential usage of the CUA, CUG, UUG, and UUA codons in the two groups.
Fig 3
Fig 3. The high correlation between codon usage and GC composition of the third codon position suggests that codon usage bias at the level of individual codons is likely driven by genetic drift.
The graph illustrates a phylogenetic generalized least squares comparison between relative synonymous codon usage values and third codon position GC composition (GC3) for each codon across the 327 budding yeast species. Colors toward the red spectrum indicate a positive correlation between CG-ending codons and increasing GC3. Blue colors indicate a negative correlation between A/U-ending codons and increasing GC3. Grey cells denote non-degenerate codons encoding methionine or tryptophan or stop codons.
Fig 4
Fig 4. The complex relationship between relative frequency and genome-wide average base composition of the third codon position (GC3) suggests that individual codons vary in their fit to the neutral expectation (i.e., that codon usage is solely driven by GC mutational bias and genetic drift).
The neutral expectations for the different codons were obtained from the models developed by Palidwor et al. [38]. A) Observed relative frequency of the alanine codon GCC (shown on the Y axis) plotted against GC3(shown on the X axis) for each of the 327 budding yeast species analyzed in this study. The codon GCC had agood fit to the neutral expectation (black line, R-squared value = 0.671). B) Observed relative frequency of the arginine codon CGU plotted against GC3 composition for each species. The codon CGU had a poor fit to the neutral expectation (black line, R-squared value = -0.165); the same trend was also observed in the other Group-2 arginine codons (CGA and AGG). C) R-squared values for each of the codons (first column) and the sum of all codons for an amino acid (second column) compared to their neutral expectations. Boxes colored towards the red spectrum indicate a better fit to the neutral model, while boxes colored towards the blue spectrum indicate a poorer fit (i.e., worse than the mean) to the neutral model. Grey-colored boxes in the first column indicate non-degenerate amino acids or stop codons; grey boxes in the second column indicate codons that either have their own models (e.g., ATC) or have values that stem from the same model (e.g., all amino acids encoded by two codons, such as tyrosine (Y), which is encoded by TAT and TAC). Asterisks indicate codons with a Blomberg’s K variance over 1 when comparing GC3 and relative frequency, suggesting that the GC3 and relative frequency values for these codons are correlated due to phylogeny (i.e., closely related species tend to have more similar GC3 and relative frequency values due to shared ancestry).
Fig 5
Fig 5. Comparison of the silent third position GC composition of the third codon position (GC3) suggests that individual codons vary in their fit to the neutral expectation (i.e., that codon usage is solely driven by GC mutational bias and genetic drift).
The neutral expectations for the different codons were obtained from the models developed by Palidwor et al. (2010). A) Observed relative frequency of the alanine codon GCC (shown on the Y axis) plotted against GC3 (shown on the X axis) for each of the 327 budding yeast species analyzed in this study. The codon GCC had a good fit to the neutral expectation (black line, R-squared value = 0.671). B) Observed relative frequency of the arginine codon CGU plotted against GC3 composition for each species. The codon CGU had a poor fit to the neutral expectation (black line, R-squared value = -0.165); the same trend was also observed in the other Group-2 arginine codons (CGA and AGG). C) R-squared values for each of the codons (first column) and the sum of all codons for an amino acid (second column) compared to their neutral expectations. Boxes colored towards the red spectrum indicate a better fit to the neutral model, while boxes colored towards the blue spectrum indicate a poorer fit (i.e., worse than the mean) to the neutral model. Grey-colored boxes in the first column indicate non-degenerate amino acids or stop codons; grey boxes in the second column indicate codons that either have their own models (e.g., ATC) or have values that stem from the same model (e.g., all amino acids encoded by two codons, such as tyrosine (Y), which is encoded by TAT and TAC). Asterisks indicate codons with a Blomberg’s K variance over 1 when comparing GC3 and relative frequency, suggesting that the GC3 and relative frequency values for these codons are correlated due to phylogeny (i.e., closely related species tend to have more similar GC3 and relative frequency values due to shared ancestry).
Fig 6
Fig 6. Most genomes in the budding yeast subphylum exhibit moderate to high levels of translational selection on codon bias.
Translational selection on codon bias was measured using the S-test, which examines the correlation between the stAI value and the selective pressure (estimated by f(GC3)-ENC where f(GC3) is a modified function of Wright’s neutral relationship between the silent GC content of a gene and the effective number of codons) on all coding sequences in a genome. Each point in the comparison between stAI and selective pressure is a single coding sequence in one genome. Higher S-values indicate higher levels of translational selection on codon bias. A) Distribution of the significant S-values (p<0.05 in permutation test; 293 species out of 327) and non-significant S-values (p>0.05 in permutation test; 34 / 327 species). B) Pichia membranifaciens, an example of a species that exhibits low translational selection on codon bias (p<0.05 in permutation test; n = 10,000). C) Saccharomyces cerevisiae, an example of a species that exhibits high translational selection on codon bias (p < 0.01 in permutation test; n = 10,000).
Fig 7
Fig 7. Maximum translational selection occurs at an intermediate number of total tRNA genes in the genome.
This plot shows the relationship between the total number of tRNA genes in a genome (tRNAome size) and S-value for each the 327 budding yeast species analyzed in this study. The best fitting model (blue) was a Gaussian distribution with a maximum S-value at 336 tRNA genes. This suggests that species with either low or high numbers of total tRNA genes exhibit lower levels of translational selection.

Similar articles

Cited by

References

    1. Fiers W, Contreras R, Duerinck F, Haegeman G, Iserentant D, Merregaert J, et al. Complete nucleotide sequence of bacteriophage MS2 RNA: primary and secondary structure of the replicase gene. Nature. 1976;260(5551):500–7. Epub 1976/04/08. 10.1038/260500a0 . - DOI - PubMed
    1. Air GM, Blackburn EH, Coulson AR, Galibert F, Sanger F, Sedat JW, et al. Gene F of bacteriophage phiX174. Correlation of nucleotide sequences from the DNA and amino acid sequences from the gene product. J Mol Biol. 1976;107(4):445–58. Epub 1976/11/15. 10.1016/s0022-2836(76)80077-0 . - DOI - PubMed
    1. Grantham R, Gautier C, Gouy M, Jacobzone M, Mercier R. Codon catalog usage is a genome strategy modulated for gene expressivity. Nucleic Acids Res. 1981;9(1):r43–74. Epub 1981/01/10. 10.1093/nar/9.1.213-b . - DOI - PMC - PubMed
    1. Ikemura T. Correlation between the abundance of Escherichia coli transfer RNAs and the occurrence of the respective codons in its protein genes. J Mol Biol. 1981;146(1):1–21. Epub 1981/02/15. 10.1016/0022-2836(81)90363-6 . - DOI - PubMed
    1. Ikemura T. Correlation between the abundance of Escherichia coli transfer RNAs and the occurrence of the respective codons in its protein genes: a proposal for a synonymous codon choice that is optimal for the E. coli translational system. J Mol Biol. 1981;151(3):389–409. 10.1016/0022-2836(81)90003-6 . - DOI - PubMed

Publication types

LinkOut - more resources