. 2019 Jul 30;8(8):791.
doi: 10.3390/cells8080791.

Differential Inhibition of Target Gene Expression by Human microRNAs

Affiliations

Differential Inhibition of Target Gene Expression by Human microRNAs

Peng Li et al. Cells. .

Abstract

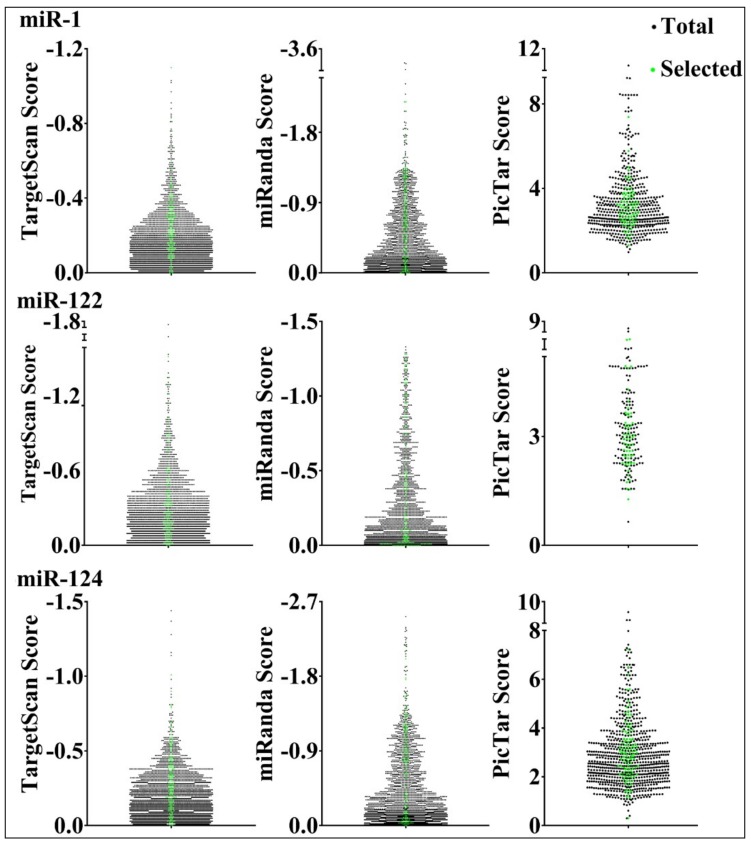
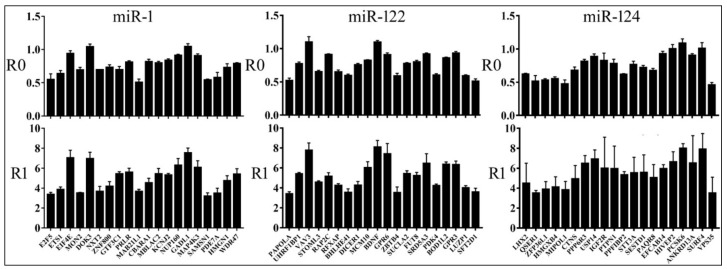
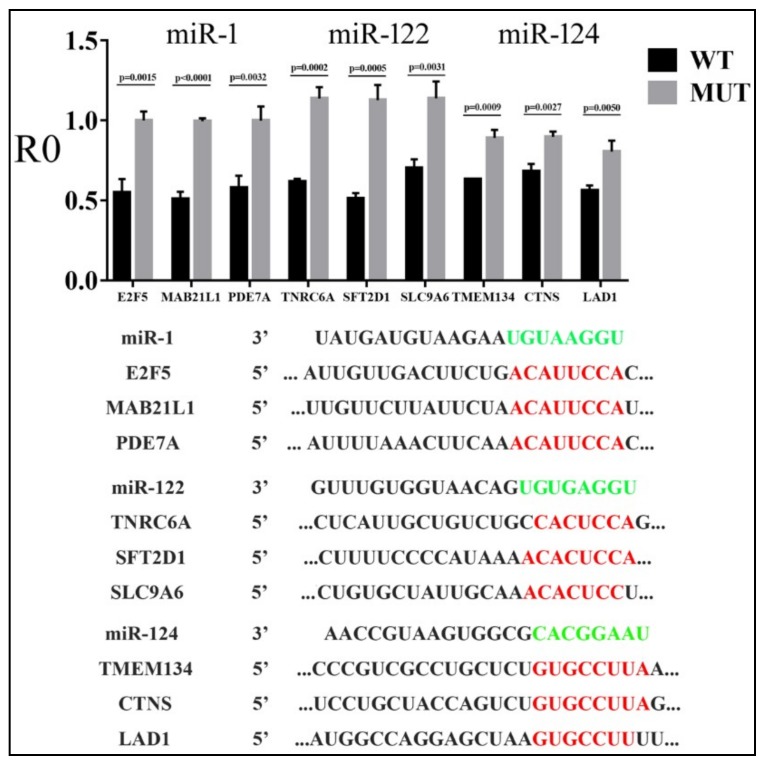
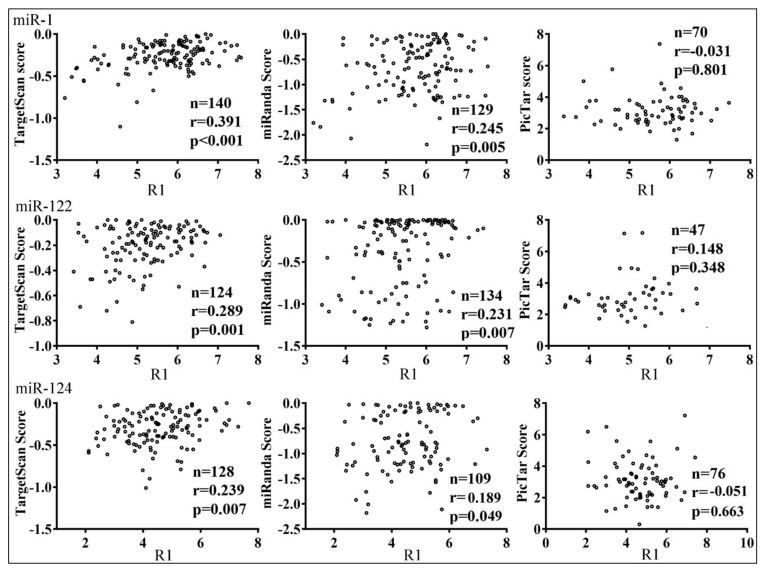
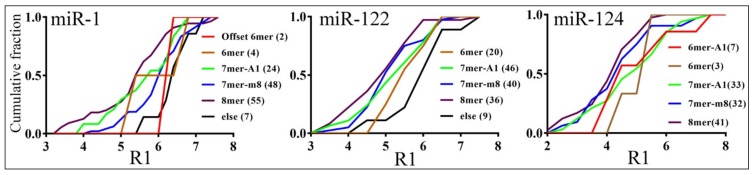
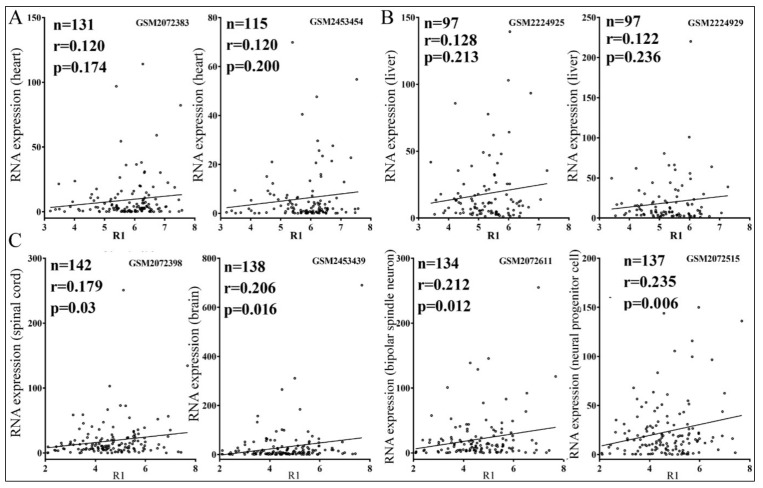
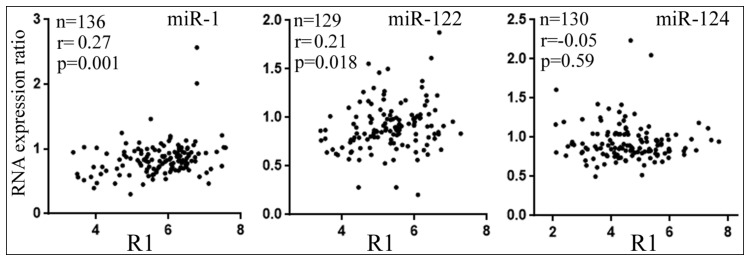
microRNAs (miRNAs) exert their functions by repressing the expression of their target genes, but most miRNA target genes are unknown, and the degree to which a miRNA differentially inhibits the expression of its targets is underappreciated. We selected human miR-1, miR-122, and miR-124 as representatives to investigate the reliability of miRNA target predictions and examine how miRNAs suppress their targets. We constructed miRNA target gene reporter libraries based on prediction programs TargetScan, miRanda, and PicTar, and performed large-scale reporter assays to directly evaluate whether and how strongly a predicted target gene is repressed by its miRNA. We then performed statistical analyses to examine parameters that contributed to the miRNA inhibition of target genes. We found that the three programs have approximately 72-85% success rates in predicting genuine targets and that the miRNA inhibition of different targets varies in extent. We also identified parameters that could predict the degrees of miRNA repression, and further showed that differential miR-124 repression might contribute to differential gene expression in vivo. Our studies systematically investigated hundreds of miRNA target genes, shed light on factors influencing miRNA functions, and suggested a new mechanism by which differential target repression by miRNAs regulates endogenous gene expression.

Keywords: differential gene expression; differential gene suppression; miRNA; miRNA target gene; target gene prediction.


Conflict of interest statement

The authors declare no conflicts of interest.

Figures

Figure 1
Figure 1
Selection of predicted miRNA target genes. Ranking scores provided by TargetScan, miRanda, and PicTar are shown in the y-axes. Black dots denote all the predicted genes, and green dots the ones chosen for testing.
Figure 2
Figure 2
Results of reporter assays in 293T cells. Averages and standard deviations of R0 and R1 values (y-axes) are shown for the individual genes listed at the bottom (x-axes).
Figure 3
Figure 3
Effects of miRNAs on the expression of wildtype (WT) and mutant (MUT) target reporters in 293T cells. Y-axis is the R0 value, and x-axis represents individual genes. Averages, standard deviations, and p-values between the WT and MUT are indicated on the graph. Sequences of the miRNAs and WT targets are shown below the graph, with miRNA seed regions in green, and the complementary WT sequences deleted in MUT constructs in red.
Figure 4
Figure 4
Reporter assay results in 293T cells and HeLa cells. Y-axes are the R0 values, and x-axes are the potential miR-1 and miR-124 targets. Averages and standard deviations are shown.
Figure 5
Figure 5
Correlations between miRNA reporter inhibition indexes (R1, x-axes) and the scores of TargetScan, miRanda, and PicTar (y-axes). Little circles represent individual confirmed targets. The sample size (n), correlation coefficients (r), and p-values are listed.
Figure 6
Figure 6
Effects of seed types on the degrees of reporter inhibition by miRNAs. X-axes show the R1 values, and y-axes the cumulative fraction. Color lines represent different seed types in the confirmed, single MRE-containing targets, with each sample size in parentheses. Seed types were categorized according to Bartel [2], and “else” contained targets not belonging to all the other types.
Figure 7
Figure 7
Pearson correlations between human endogenous gene expression and target reporter inhibition. (A) Correlations between RNA expression in the heart (y-axes) and miR-1 target R1 values (x-axes). (B) Correlations between RNA expression in the liver (y-axes) and miR-122 target R1 values (x-axes). (C) Correlations between RNA expression in the nervous system and neurons (y-axes) and miR-124 target R1 values (x-axes). Little circles represent individual confirmed targets. The sample size (n), correlation coefficients (r), p-values, and the corresponding Gene Expression Omnibus dataset accession numbers are indicated.
Figure 8
Figure 8
Correlations between R1 values and changes in target mRNA levels upon miRNA transfection in 293T cells. Y-axes show RNA levels under miRNA transfection condition divided by those under the control RNA transfection condition. Dots represent individual confirmed targets. The sample size (n), correlation coefficients (r), and p-values are indicated.

References

    1. Ambros V. MicroRNAs and developmental timing. Curr. Opin. Genet. Dev. 2011;21:511–517. doi: 10.1016/j.gde.2011.04.003. - DOI - PMC - PubMed
    1. Bartel D.P. Metazoan microRNAs. Cell. 2018;173:20–50. doi: 10.1016/j.cell.2018.03.006. - DOI - PMC - PubMed
    1. Jonas S., Izaurralde E. Towards a molecular understanding of microRNA-mediated gene silencing. Nat. Rev. Genet. 2015;16:421–433. doi: 10.1038/nrg3965. - DOI - PubMed
    1. Guo H., Ingolia N.T., Weissman J.S., Bartel D.P. Mammalian microRNAs predominantly act to decrease target mRNA levels. Nature. 2010;466:835–840. doi: 10.1038/nature09267. - DOI - PMC - PubMed
    1. Reinhart B.J., Slack F.J., Basson M., Pasquinelli A.E., Bettinger J.C., Rougvie A.E., Horvitz H.R., Ruvkun G. The 21-nucleotide let-7 RNA regulates developmental timing in Caenorhabditis elegans. Nature. 2000;403:901–906. doi: 10.1038/35002607. - DOI - PubMed

Publication types