. 2019 Sep 12;134(11):867-879.
doi: 10.1182/blood.2019000611. Epub 2019 Jul 31.

Genomic landscape of neutrophilic leukemias of ambiguous diagnosis

Affiliations

Genomic landscape of neutrophilic leukemias of ambiguous diagnosis

Haijiao Zhang et al. Blood. .

Abstract

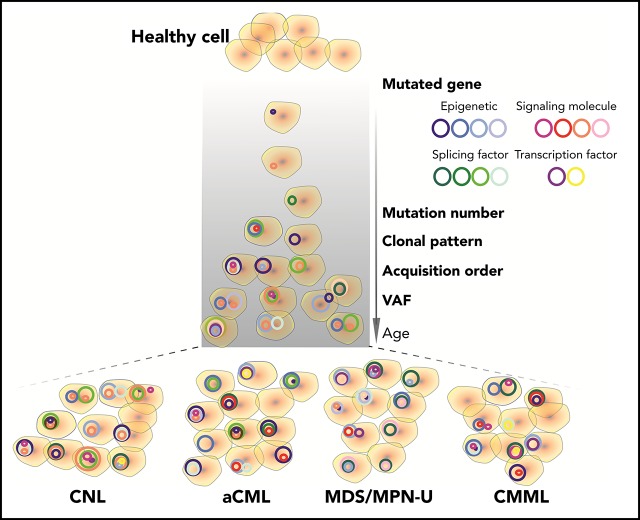
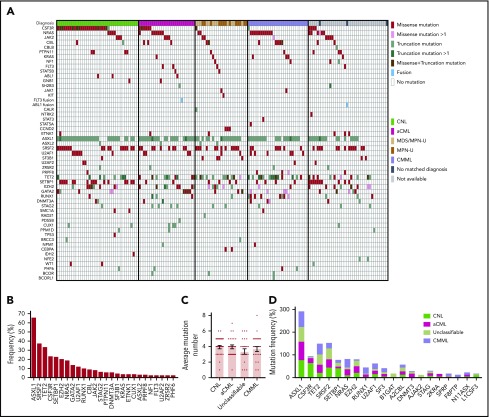
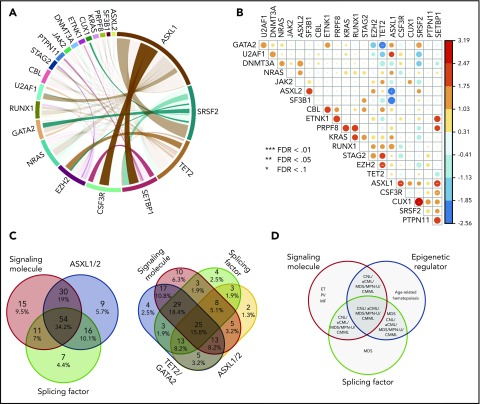
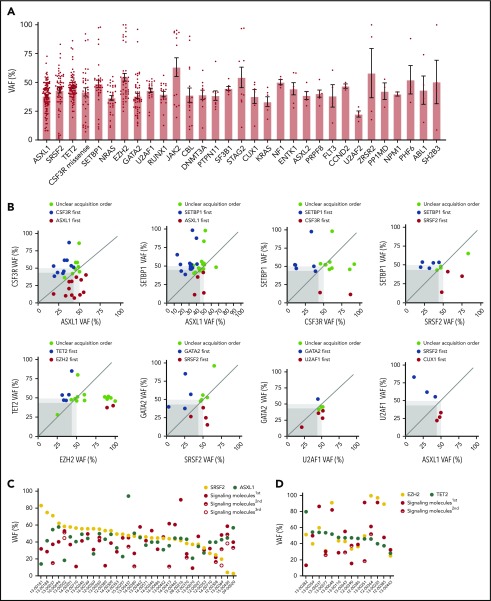
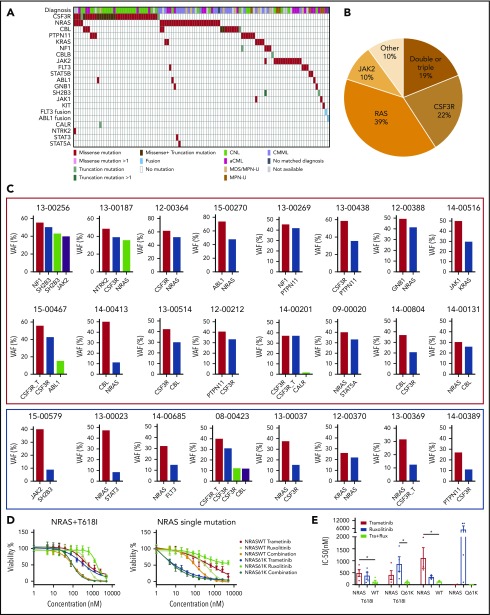
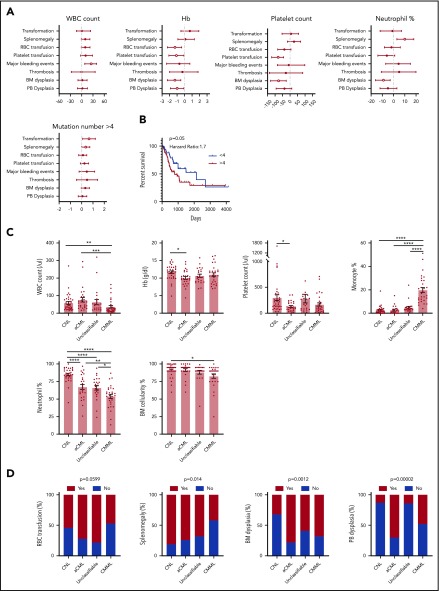
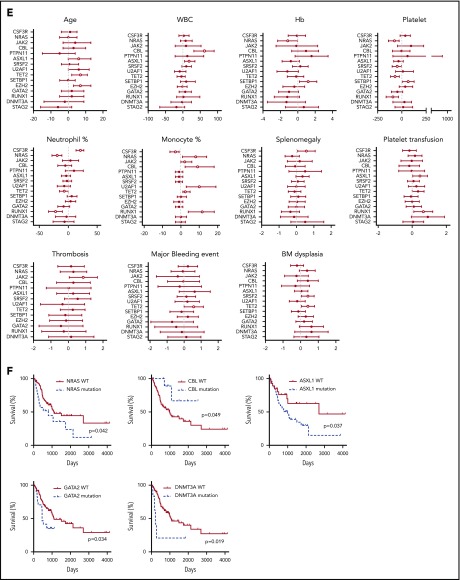
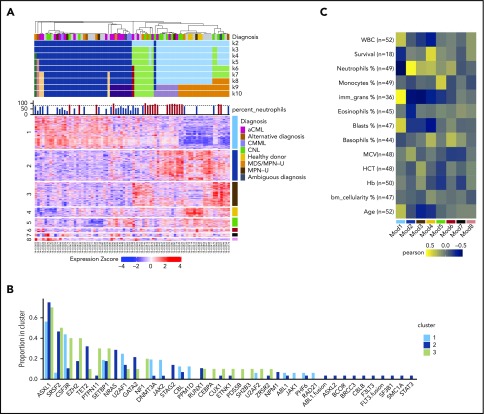
Chronic neutrophilic leukemia (CNL), atypical chronic myeloid leukemia (aCML), and myelodysplastic/myeloproliferative neoplasms, unclassifiable (MDS/MPN-U) are a group of rare and heterogeneous myeloid disorders. There is strong morphologic resemblance among these distinct diagnostic entities as well as a lack of specific molecular markers and limited understanding of disease pathogenesis, which has made diagnosis challenging in certain cases. The treatment has remained empirical, resulting in dismal outcomes. We, therefore, performed whole-exome and RNA sequencing of these rare hematologic malignancies and present the most complete survey of the genomic landscape of these diseases to date. We observed a diversity of combinatorial mutational patterns that generally do not cluster within any one diagnosis. Gene expression analysis reveals enrichment, but not cosegregation, of clinical and genetic disease features with transcriptional clusters. In conclusion, these groups of diseases represent a continuum of related diseases rather than discrete diagnostic entities.


Conflict of interest statement

Conflict-of-interest disclosure: J.W.T. has received research support from Aptose, Array, AstraZeneca, Constellation, Genentech, Gilead, Incyte, Janssen, Seattle Genetics, Syros, and Takeda and is co-founder of Vivid Biosciences. B.J.D. is on the scientific advisory board of Aileron Therapeutics, ALLCRON, Cepheid, Gilead Sciences, Vivid Biosciences, Celgene, and Baxalta (inactive); is on the scientific advisory board of and owns stock in Aptose Biosciences, Blueprint Medicines, Beta Cat, GRAIL, Third Coast Therapeutics, and CTI BioPharma (inactive); is a scientific founder of and owns stock in MolecularMD; is on the board of directors and owns stock in Amgen; is on the board of directors of Burroughs Wellcome Fund and CureOne; is on the Joint Steering Committee of Beat AML LLS; and receives clinical trial funding from Novartis, Bristol-Myers Squibb, and Pfizer and royalties from patent 6958335 (Novartis exclusive license), Oregon Health & Science University, and Dana-Farber Cancer Institute (1 Merck exclusive license). K.-H.T.D. is a member of the advisory board of Incyte and received funding from Incyte for research study. The remaining authors declare no competing financial interests.

Figures

None
Graphical abstract
Figure 1.
Figure 1.
Genomic landscape of CNL/aCML/unclassifiable/CMML. (A) The mosaic plot depicts distributions of recurrent gene mutations in 158 patients. Each column displays each patient, and each row denotes a specific gene. Variant types are color coded as indicated. (B) The graph depicts frequencies of recurrent gene mutations in this cohort of CNL/aCML/unclassifiable/CMML patients. (C) The graph depicts the mean ± SEM of the number of mutations in different diagnostic groups. Statistical analysis was performed using a 1-way ANOVA. (D) The graph depicts the frequencies of recurrently mutated genes in different diagnostic groups. Statistical analysis was performed using a contingency table χ2 test followed by the Bonferroni correction and expressed as P < .0001.
Figure 2.
Figure 2.
Mutations in signaling molecules, epigenetic regulators, and splicing factors are frequently co-occurring in CNL/aCML/unclassifiable/CMML. (A) The circos plot depicts the relative frequency and pairwise co-occurrence of molecular mutations. Outer segments indicate a particular subcohort being positive for the given gene mutations. Relative frequencies of pairwise co-occurrences are indicated by ribbon widths. The transparency of the lines is tied to their significance in panel B (no transparency indicates the co-occurrence is significant). (B) Exclusivity and co-occurrence between different gene mutations. The circles were sized and colored according to their log(odds) from a Fisher’s exact test (red color series represent co-occurrence and blue series represent exclusivity). (C) Venn diagrams depict distribution and co-occurrence frequencies of mutations of ASXL1/2, signaling molecules, and splicing factors (left panel) or mutations of ASXL1, signaling molecules, splicing factors, and TET2/GATA2 mutations (right panel). (D) Venn diagram showing potential association and distribution of different pathway mutations with different disease diagnosis. ET, essential thrombocythemia; MF, myelofibrosis; PV, polycythemia vera.
Figure 3.
Figure 3.
Clonal architecture of different pathway mutations. (A) Mean ± SEM of VAFs of common driver mutations in the cohort. (B) Dot plots depict VAFs of pairwise co-occurring mutations. Gene mutations with higher VAFs are considered to occur earlier then variants with lower VAFs. Dark gray square highlights 45% VAF. Dots appearing in the dark gray square are possibly acquired as subclones. Dot plot shows different mutation acquisition orders of SRSF2, ASXL1, and signaling molecules (C) and TET2, EZH2, and signaling molecules (D).
Figure 4.
Figure 4.
Diverse signaling molecule mutations are identified in CNL/aCML/unclassifiable/CMML. (A) The mosaic plot depicts the spectrum of different signaling molecule mutations in the cohort. (B) The pie chart depicts the frequencies of different signaling pathway mutations. (C) The graph depicts the VAFs of coexisting signaling pathway mutations showing co-occurrence pattern (red rectangle) and potential subclone pattern (blue rectangle). (D) Mean ± SEM of cell viability of Ba/F3 cells expressing CSF3R T618I with NRAS wild-type or mutant treated with gradient concentrations of indicated drugs for 72 hours (left). Mean ± SEM of cell viability of Ba/F3 cells expressing NRAS wild-type or mutant treated with a gradient concentration of indicated drugs for 72 hours (right). (E) Mean ± SEM of drug IC50 of Ba/F3 cells expressing single or compound mutation treated with indicated drugs. Statistical significance was assessed using 1-way ANOVA and Kruskal-Wallis tests (*P < .05; **P < .01).
Figure 5.
Figure 5.
Disease diagnosis and the presence of certain mutations predict clinical outcomes. (A) The graph depicts 95% confidence interval and Hodges-Lehmann median differences of odds ratios of different clinical parameters for indicated clinic outcomes. (B) The graph depict the Kaplan-Meier survival curve of patients with ≥4 mutations or patients with <4 mutations. Statistical significance of the Kaplan-Meier survival curve was analyzed by the log-rank test (C) Graphs depict the mean ± SEM of indicated clinic parameters in different disease subgroups. Statistical significance was assessed using 1-way ANOVA and Kruskal-Wallis tests. (D) Graphs depict the comparison of frequencies of indicated clinic outcomes in different disease groups. Statistical significance was analyzed using contingency table χ2 tests. (E) The graph depicts 95% confidence interval and Hodges-Lehmann median differences for different clinical parameters in the presence or absence of mutations in a given gene. Statistical significance of continual variables was calculated using Mann-Whitney U tests, whereas for bilinear variables, significance was calculated by Fisher's exact test, and the log10-transformed odds ratios are shown. (F) Graphs depict Kaplan-Meier survival curves of patients in the presence or absence of given gene mutations. Statistical significance of the Kaplan-Meier survival curve was analyzed by the log-rank test. WT, wild-type.
Figure 5.
Figure 5.
Disease diagnosis and the presence of certain mutations predict clinical outcomes. (A) The graph depicts 95% confidence interval and Hodges-Lehmann median differences of odds ratios of different clinical parameters for indicated clinic outcomes. (B) The graph depict the Kaplan-Meier survival curve of patients with ≥4 mutations or patients with <4 mutations. Statistical significance of the Kaplan-Meier survival curve was analyzed by the log-rank test (C) Graphs depict the mean ± SEM of indicated clinic parameters in different disease subgroups. Statistical significance was assessed using 1-way ANOVA and Kruskal-Wallis tests. (D) Graphs depict the comparison of frequencies of indicated clinic outcomes in different disease groups. Statistical significance was analyzed using contingency table χ2 tests. (E) The graph depicts 95% confidence interval and Hodges-Lehmann median differences for different clinical parameters in the presence or absence of mutations in a given gene. Statistical significance of continual variables was calculated using Mann-Whitney U tests, whereas for bilinear variables, significance was calculated by Fisher's exact test, and the log10-transformed odds ratios are shown. (F) Graphs depict Kaplan-Meier survival curves of patients in the presence or absence of given gene mutations. Statistical significance of the Kaplan-Meier survival curve was analyzed by the log-rank test. WT, wild-type.
Figure 6.
Figure 6.
Differential gene expression may guide clinical diagnosis. (A) Consensus clustering heatmap of expression values (Z score; mean centered and divided by standard deviation) (k = 2 through k = 10). Rows are first split by their WGCNA module membership and then clustered by expression values. The module number is on the left, and the corresponding color is on the right. Heatmap columns were clustered by consensus clustering (k = 7). (B) The barplot demonstrates the gene mutation frequencies colored by the consensus clustering result. (C) Heatmap summary of Pearson correlations of the WGCNA module eigengenes and the numeric clinical variables. The y-axis indicates the clinical variables with the number of samples used in the correlation shown as n. The x-axis indicates the module name/color. Note that the survival data are only limited to samples with noncensored data. HCT, hematocrit; MCV, mean corpuscular volume.

Comment in

References

    1. Bupathi M, Tiu RV, Maciejewski JP. Myelodysplastic/Myeloproliferative Neoplasms, 2nd ed Myelodysplastic Syndr; 2013:111-126
    1. Maxson JE, Tyner JW. Genomics of chronic neutrophilic leukemia. Blood. 2017;129(6):715-722. - PMC - PubMed
    1. Gotlib J, Maxson JE, George TI, Tyner JW. The new genetics of chronic neutrophilic leukemia and atypical CML: implications for diagnosis and treatment. Blood. 2013;122(10):1707-1711. - PMC - PubMed
    1. Deininger MWN, Tyner JW, Solary E. Turning the tide in myelodysplastic/myeloproliferative neoplasms. Nat Rev Cancer. 2017;17(7):425-440. - PubMed
    1. Arber DA, Orazi A, Hasserjian R, et al. . The 2016 revision to the World Health Organization classification of myeloid neoplasms and acute leukemia. Blood. 2016;127(20):2391-2405. - PubMed

Publication types

MeSH terms