The Transcription Factor PLZF Is Necessary for the Development and Function of Mouse Basophils
- PMID: 31366712
- PMCID: PMC9710206
- DOI: 10.4049/jimmunol.1900068
The Transcription Factor PLZF Is Necessary for the Development and Function of Mouse Basophils
Abstract
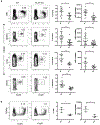
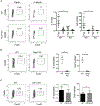
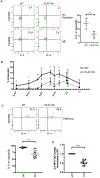
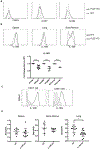
Basophils are innate immune cells associated with type 2 immunity, allergic reactions, and host defense against parasite infections. In this study, we show that the transcription factor PLZF, which is known for its essential role in the function and development of several innate lymphocyte subsets, is also important for the myeloid-derived basophil lineage. PLZF-deficient mice had decreased numbers of basophil progenitors in the bone marrow and mature basophils in multiple peripheral tissues. Functionally, PLZF-deficient basophils were less responsive to IgE activation and produced reduced amounts of IL-4. The altered function of basophils resulted in a blunted Th2 T cell response to a protein allergen. Additionally, PLZF-deficient basophils had reduced expression of the IL-18 receptor, which impacted migration to lungs. PLZF, therefore, is a major player in controlling type 2 immune responses mediated not only by innate lymphocytes but also by myeloid-derived cells.
Copyright © 2019 by The American Association of Immunologists, Inc.
Figures


Similar articles
-
Intrinsic functional defects of type 2 innate lymphoid cells impair innate allergic inflammation in promyelocytic leukemia zinc finger (PLZF)-deficient mice.J Allergy Clin Immunol. 2016 Feb;137(2):591-600.e1. doi: 10.1016/j.jaci.2015.07.050. Epub 2015 Oct 23. J Allergy Clin Immunol. 2016. PMID: 26602165 Free PMC article.
-
Basophil-derived IL-4 promotes epicutaneous antigen sensitization concomitant with the development of food allergy.J Allergy Clin Immunol. 2018 Jan;141(1):223-234.e5. doi: 10.1016/j.jaci.2017.02.035. Epub 2017 Apr 6. J Allergy Clin Immunol. 2018. PMID: 28390860
-
Basophil-mediated protection against gastrointestinal helminths requires IgE-induced cytokine secretion.Proc Natl Acad Sci U S A. 2014 Dec 2;111(48):E5169-77. doi: 10.1073/pnas.1412663111. Epub 2014 Nov 17. Proc Natl Acad Sci U S A. 2014. PMID: 25404305 Free PMC article.
-
Regulation of type 2 immunity by basophils.Adv Exp Med Biol. 2013;785:37-41. doi: 10.1007/978-1-4614-6217-0_4. Adv Exp Med Biol. 2013. PMID: 23456835 Review.
-
Promyelocytic leukemia zinc finger controls type 2 immune responses in the lungs by regulating lineage commitment and the function of innate and adaptive immune cells.Int Immunopharmacol. 2024 Mar 30;130:111670. doi: 10.1016/j.intimp.2024.111670. Epub 2024 Feb 18. Int Immunopharmacol. 2024. PMID: 38373386 Review.
Cited by
-
Embryonic mast cells arise from the Cpa3-expressing precursors but not granulocyte-monocyte progenitors.Sci China Life Sci. 2025 Aug;68(8):2363-2378. doi: 10.1007/s11427-024-2891-1. Epub 2025 May 22. Sci China Life Sci. 2025. PMID: 40419842
-
The ontogenesis and heterogeneity of basophils.Discov Immunol. 2024 Feb 2;3(1):kyae003. doi: 10.1093/discim/kyae003. eCollection 2024. Discov Immunol. 2024. PMID: 38567293 Free PMC article. Review.
-
The Role of Promyelocytic Leukemia Zinc Finger (PLZF) and Glial-Derived Neurotrophic Factor Family Receptor Alpha 1 (GFRα1) in the Cryopreservation of Spermatogonia Stem Cells.Int J Mol Sci. 2023 Jan 18;24(3):1945. doi: 10.3390/ijms24031945. Int J Mol Sci. 2023. PMID: 36768269 Free PMC article. Review.
-
Zbtb20 identifies and controls a thymus-derived population of regulatory T cells that play a role in intestinal homeostasis.Sci Immunol. 2022 May 6;7(71):eabf3717. doi: 10.1126/sciimmunol.abf3717. Epub 2022 May 6. Sci Immunol. 2022. PMID: 35522722 Free PMC article.
-
Transcriptional Regulation of Mouse Mast Cell Differentiation and the Role of Human Lung Mast Cells in Airway Inflammation.Immunol Rev. 2025 May;331(1):e70026. doi: 10.1111/imr.70026. Immunol Rev. 2025. PMID: 40211768 Review.
References
-
- Schroeder JT 2009. Basophils beyond effector cells of allergic inflammation. Adv Immunol 101: 123–161. - PubMed
-
- Mack M, Schneider MA, Moll C, Cihak J, Bruhl H, Ellwart JW, Hogarth MP, Stangassinger M, and Schlondorff D. 2005. Identification of antigen-capturing cells as basophils. J Immunol 174: 735–741. - PubMed
-
- Kubo M 2018. Mast cells and basophils in allergic inflammation. Curr Opin Immunol 54: 74–79. - PubMed
-
- Rigoni A, Colombo MP, and Pucillo C. 2018. Mast cells, basophils and eosinophils: From allergy to cancer. Semin Immunol 35: 29–34. - PubMed
Publication types
MeSH terms
Substances
Grants and funding
LinkOut - more resources
Full Text Sources
Molecular Biology Databases
Miscellaneous

