. 2019 Sep 20;294(38):14055-14067.
doi: 10.1074/jbc.RA119.008825. Epub 2019 Jul 30.

The bicarbonate/carbon dioxide pair increases hydrogen peroxide-mediated hyperoxidation of human peroxiredoxin 1

Affiliations

The bicarbonate/carbon dioxide pair increases hydrogen peroxide-mediated hyperoxidation of human peroxiredoxin 1

Daniela R Truzzi et al. J Biol Chem. .

Abstract

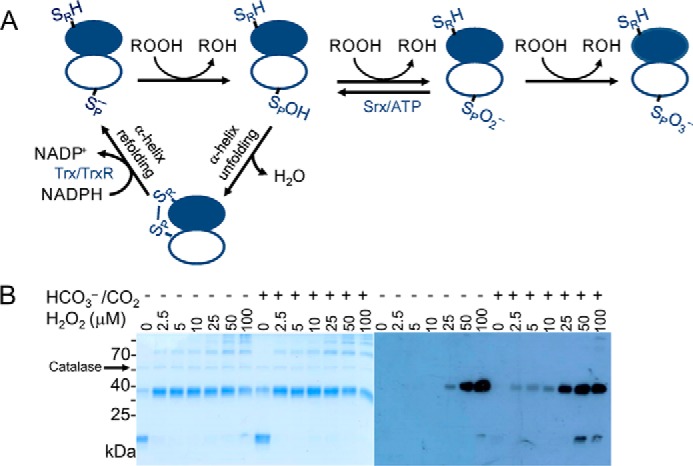
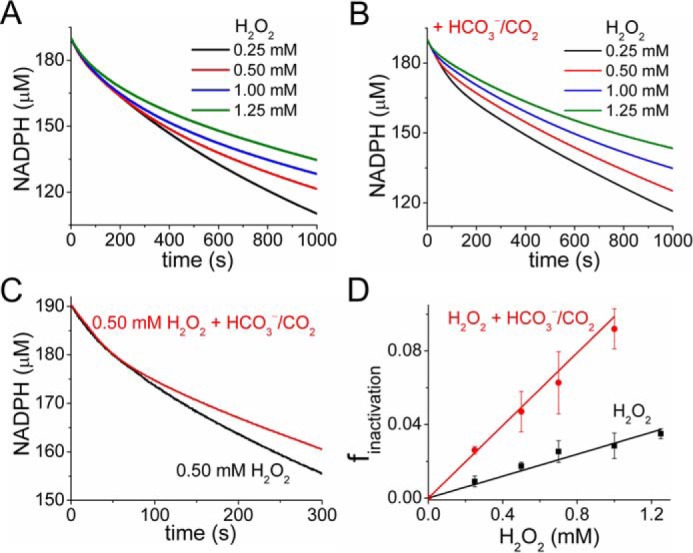
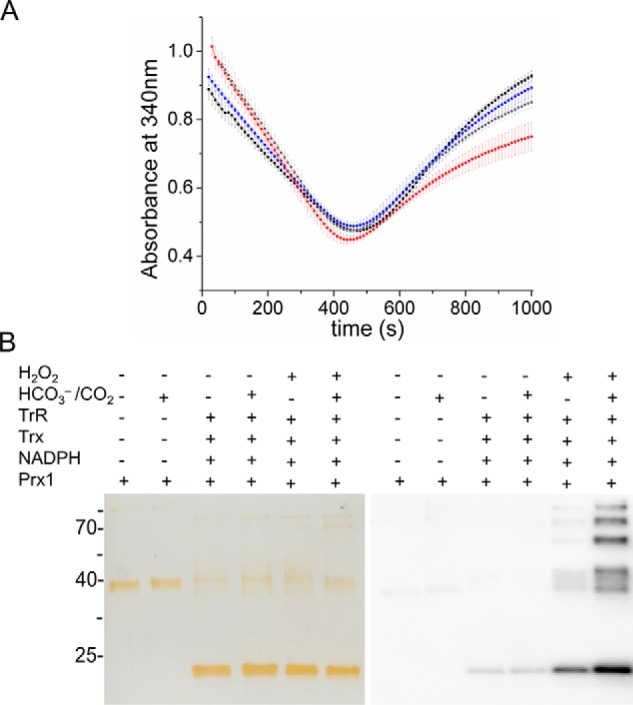
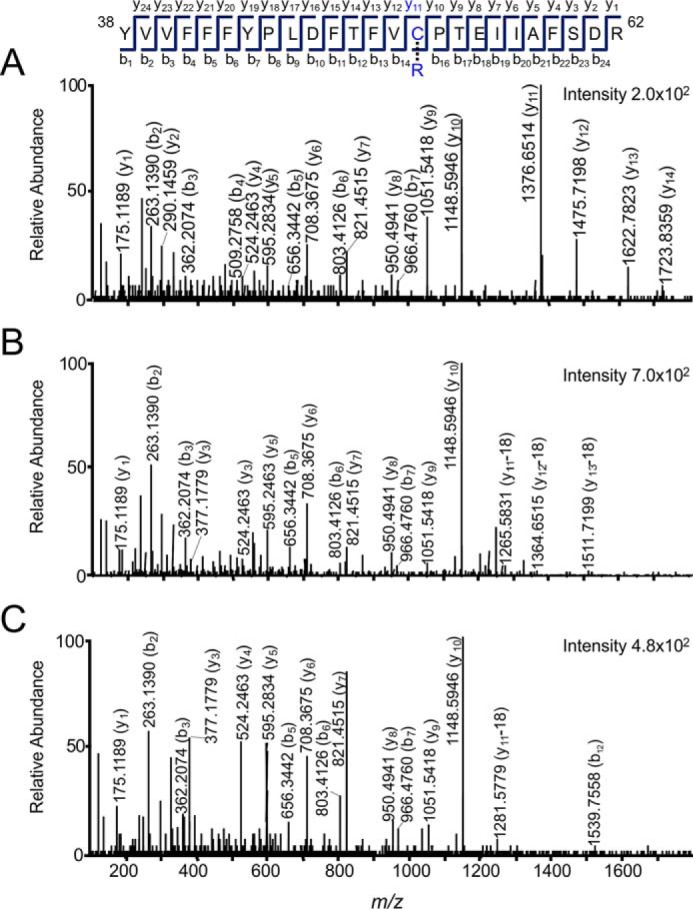
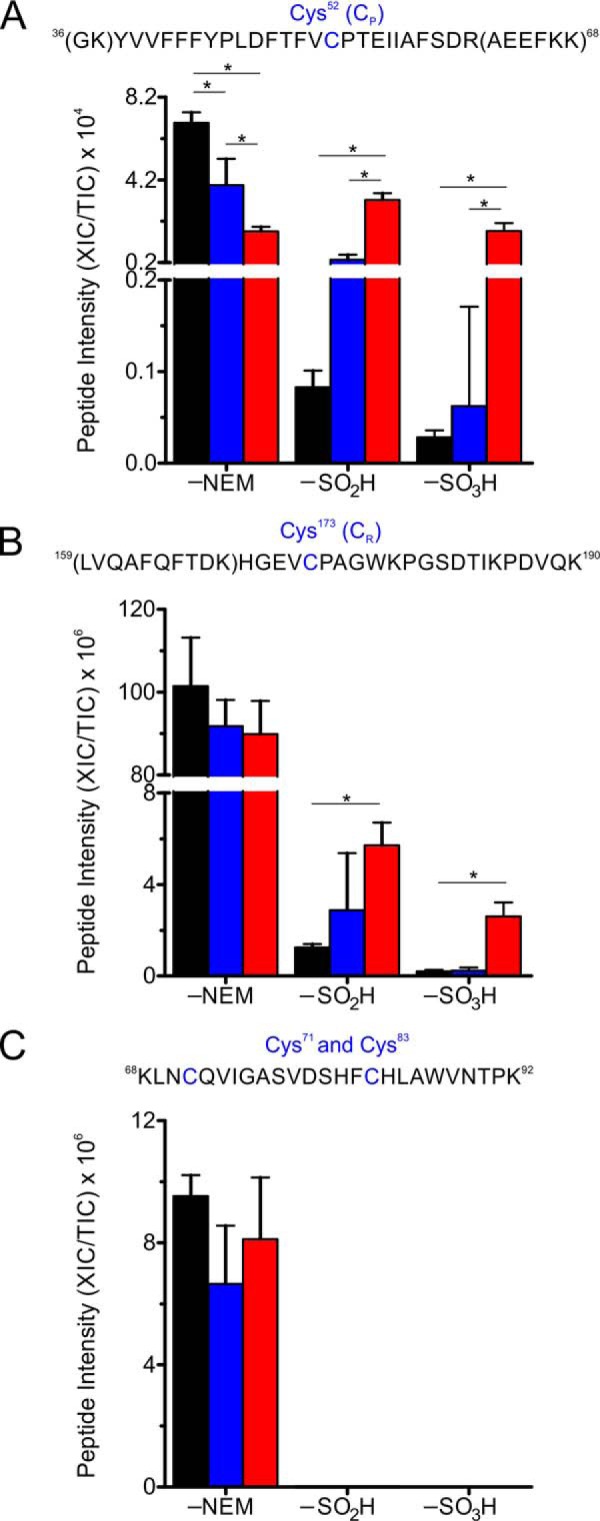
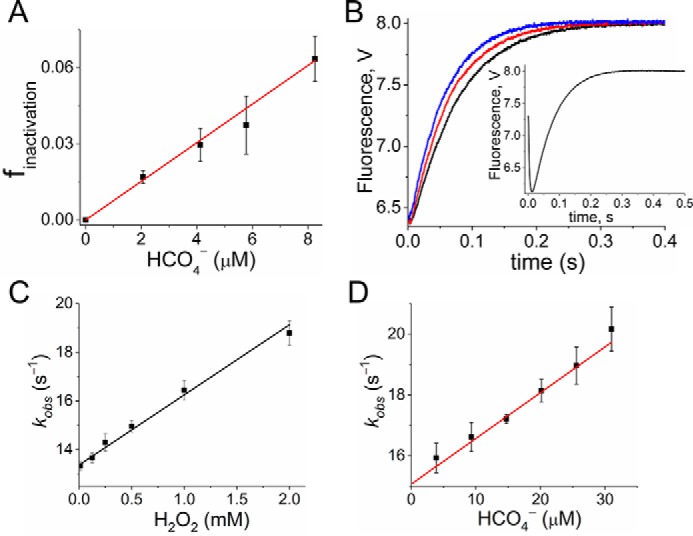
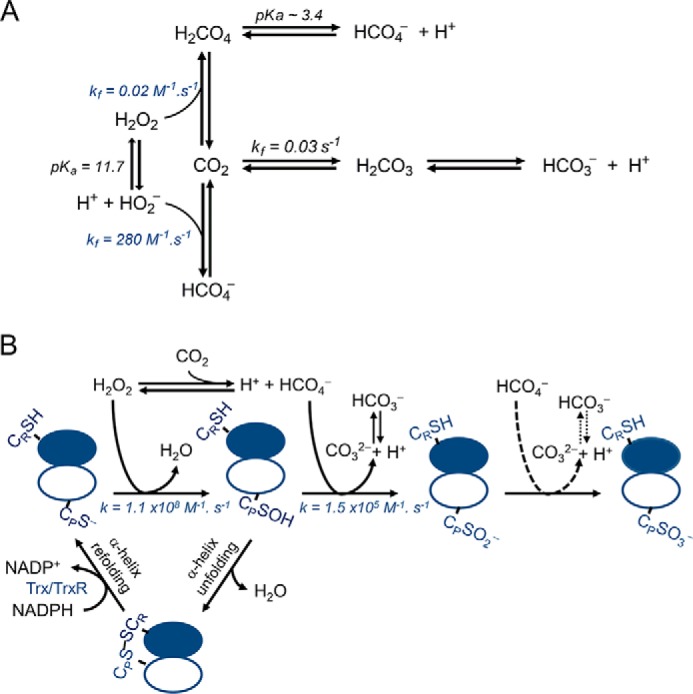
2-Cys peroxiredoxins (Prxs) rapidly reduce H2O2, thereby acting as antioxidants and also as sensors and transmitters of H2O2 signals in cells. Interestingly, eukaryotic 2-Cys Prxs lose their peroxidase activity at high H2O2 levels. Under these conditions, H2O2 oxidizes the sulfenic acid derivative of the Prx peroxidatic Cys (CPSOH) to the sulfinate (CPSO2-) and sulfonated (CPSO3-) forms, redirecting the CPSOH intermediate from the catalytic cycle to the hyperoxidation/inactivation pathway. The susceptibility of 2-Cys Prxs to hyperoxidation varies greatly and depends on structural features that affect the lifetime of the CPSOH intermediate. Among the human Prxs, Prx1 has an intermediate susceptibility to H2O2 and was selected here to investigate the effect of a physiological concentration of HCO3-/CO2 (25 mm) on its hyperoxidation. Immunoblotting and kinetic and MS/MS experiments revealed that HCO3-/CO2 increases Prx1 hyperoxidation and inactivation both in the presence of excess H2O2 and during enzymatic (NADPH/thioredoxin reductase/thioredoxin) and chemical (DTT) turnover. We hypothesized that the stimulating effect of HCO3-/CO2 was due to HCO4-, a peroxide present in equilibrated solutions of H2O2 and HCO3-/CO2 Indeed, additional experiments and calculations uncovered that HCO4- oxidizes CPSOH to CPSO2- with a second-order rate constant 2 orders of magnitude higher than that of H2O2 ((1.5 ± 0.1) × 105 and (2.9 ± 0.2) × 103 m-1·s-1, respectively) and that HCO4- is 250 times more efficient than H2O2 at inactivating 1% Prx1 per turnover. The fact that the biologically ubiquitous HCO3-/CO2 pair stimulates Prx1 hyperoxidation and inactivation bears relevance to Prx1 functions beyond its antioxidant activity.

Keywords: antioxidant defense; bicarbonate; carbon dioxide; hydrogen peroxide; hyperoxidation; inactivation; peroxiredoxin; peroxymonocarbonate; redox signaling; thiol; thiol oxidation.


Conflict of interest statement

The authors declare that they have no conflicts of interest with the contents of this article

Figures

Figure 1.
Figure 1.
Catalytic cycle and the hyperoxidation pathway of 2-Cys peroxiredoxins (A) and effects of HCO3/CO2 on Prx1 hyperoxidation (B). A, 2-Cys Prx is represented by its minimal functional unit, which is a homodimer, with one of the peroxidatic (CPS) and one of the resolving Cys (CRSH) shown. The catalytic cycle starts with the rapid reaction of the peroxidatic cysteine with hydroperoxides to reduce them, while being oxidized to the sulfenic acid form (CPSOH). Next, the resolving Cys reacts with CPSOH of the adjacent monomer forming a head–to–tail disulfide (CPS–SCR). This oxidized form of Prx is reduced by the NADPH/Trx/TrxR system, completing the peroxidase cycle. Because a partial unfolding of the α-helix containing CP is required for the formation of the disulfide, CPSOH can be further oxidized to the sulfinate (CPSO2) and, subsequently, to the sulfonated (CPSO3) forms if the oxidant concentration is sufficiently high. These processes are called hyperoxidation and lead to inactivation of the peroxidase activity of the enzyme. B, representative effects of HCO3/CO2 on H2O2-mediated Prx1 hyperoxidation revealed by nonreducing SDS-PAGE (lower panel) and Western blot analysis using an anti-PrxSO2H/PrxSO3H antibody (upper panel). The incubations contained Prx1 (2.5 μm), H2O2 (2.5–100 μm) in the absence and presence of HCO3/CO2 (25 mm) in phosphate buffer (50 mm) containing DTPA (0.1 mm), pH 7.4. After a 5-min incubation at room temperature, the samples were treated and analyzed as described under “Experimental procedures.” The shown experiment is representative of three independent experiments.
Figure 2.
Figure 2.
Stimulatory effect of HCO3/CO2 (25 mm) on H2O2-mediated Prx1 hyperoxidation during enzymatic turnover. A, representative kinetics of NADPH consumption coupled to the reduction of the specified concentrations of H2O2 by Prx1 (0.6 μm) turnover by NADPH (200 μm), Trx1 (2.5 μm), TrxR1 (80 nm) in Hepes-NaOH (50 mm) containing 1 mm EDTA, pH 7.0, at 30 °C. B, same as A in the presence of HCO3/CO2 (25 mm). C, comparison of the kinetics of NADPH consumption coupled to the reduction of H2O2 (0.5 mm) in the absence (black line) or presence of HCO3/CO2 (25 mm) (red line). Experimental conditions are the same as A and B. D, plots of finactivation versus H2O2 concentration in the absence and presence of HCO3/CO2 (25 mm) yielded straight lines, and the slope was used to calculate C1%hyperoxidation for H2O2 in the absence ((335 ± 18) μm) and presence of HCO3/CO2 (25 mm) ((101 ± 4) μm). The values of finactivation were obtained by treatment of the kinetic data obtained in experiments similar to A and B as described previously (8) and under “Experimental procedures”; the values plotted in D are the mean ± S.D. obtained from three independent kinetic experiments.
Figure 3.
Figure 3.
Effect of H2O2, HCO3/CO2, or H2O2 plus HCO3/CO2 (25 mm) on the insulin reductase activity of NADPH/TrxR/Trx (A) and on Prx1 hyperoxidation during enzymatic turnover (B). A, kinetics of NADPH consumption and insulin precipitation during the insulin reductase activity of the TrxR/Trx system. The incubation contained NADPH (200 μm), Trx1 (2.5 μm), TrxR1 (80 nm), and insulin (0.16 mm) in Hepes-NaOH (50 mm) containing 1 mm EDTA, pH 7.0, at 30 °C (black curve); the same plus H2O2 (0.5 mm) (blue curve); the same plus HCO3/CO2 (25 mm) (gray curve); and the same plus H2O2 (0.5 mm) and HCO3/CO2 (25 mm) (red curve). The absorbance values shown are the mean ± S.D. obtained from three independent experiments. B, representative nonreducing SDS-PAGE (left panel) and Western blot analysis using an anti-PrxSO2H/PrxSO3H antibody (right panel) of Prx1 hyperoxidation during enzymatic turnover. The incubations contained Prx1 (0.6 μm), NADPH (200 μm), Trx1 (2.5 μm), TrxR1 (80 nm), and the specified concentrations of H2O2 in Hepes-NaOH (50 mm) containing 1 mm EDTA in the absence or presence of HCO3/CO2 (25 mm), pH 7.0; the controls with HCO3/CO2 (25 mm) are also shown. After 15 min at 30 °C, the samples were treated and analyzed as described under “Experimental procedures.” The shown experiment is representative of several similar experiments, including some performed with an antibody from a different commercial source (Fig. S1).
Figure 4.
Figure 4.
Nano-ESI–Q-TOF–MS/MS analysis of the alkylated, sulfinated, and sulfonated peptides 38YVVFFFYPLDFTFVCPTEIIAFSDR62 from tryptic digests of Prx1 after chemical turnover. Prx1 (5 μm) was treated with 1 mm H2O2 plus HCO3/CO2 (25 mm) in the presence of DTT (10 mm) for 16 h at 30 °C. The incubations were performed in phosphate buffer (50 mm) containing DTPA (0.1 mm), pH 7.4, and the samples were treated and analyzed as described under “Experimental procedures.” A, MS/MS sequencing of the peak at m/z value of 1054.5171, which corresponds to the alkylated peptide (monoisotopic mass 3160.5290) with three charges, found in the tryptic digests of treated Prx1. R represents the NEM (–C6H8NO2) group. B, MS/MS sequencing of the peak at m/z value of 1023.4979, which corresponds to the sulfinated (–SO2H) peptide (monoisotopic mass 3067.4711) with three charges, found in the tryptic digests of treated Prx1. R represents the –SO2H group. C, MS/MS sequencing of the peak at m/z value of 1028.8295, which corresponds to the sulfonated (–SO3H) peptide (monoisotopic mass 3083.4661) with three charges, found in the tryptic digests of treated Prx1. R represents the –SO3H group. The spectra shown are representative of three independent experiments.
Figure 5.
Figure 5.
Relative yields of alkylated, sulfinated, and sulfonated peptides obtained from tryptic digests of Prx1 after chemical turnover. Prx1 (5 μm) was untreated (black bars) or treated with 1 mm H2O2 (blue bars) or with 1 mm H2O2 plus HCO3/CO2 (25 mm) (red bars) in the presence of DTT (10 mm) for 16 h at 30 °C. The incubations were performed in phosphate buffer (50 mm) containing DTPA (0.1 mm), pH 7.4, and the samples were treated and analyzed as described under “Experimental procedures.” A, sum of the specified peptides containing Cys52 (CP). B, sum of the specified peptides containing Cys173 (CR). C, sum of the specified peptides containing Cys71 and Cys83. The values shown are the mean ± S.D. obtained from three independent experiments; the calculations were performed as described in the text.
Figure 6.
Figure 6.
Evaluating the role of HCO4 in the stimulatory effect of HCO3/CO2 on H2O2-mediated Prx1 hyperoxidation. A, determination of C1% hyperoxidation for HCO4 based on the kinetic data of Fig. 2D and the calculations described in the text. As in Fig. 2D, the finactivation values plotted are the mean ± S.D. obtained from three independent experiments. B, representative increase in the intrinsic fluorescence of oxidized Prx1 (Prx1 CPSOH) over time following the addition of 25 μm (black trace), 1 mm (red trace), and 2 mm (blue trace) H2O2; the initial concentration of reduced Prx1 was 2.5 μm. The inset shows the changes in the intrinsic fluorescence of reduced Prx1 (2.5 μm) over time following the addition of 2.5 μm H2O2. C, determination of the second-order rate constant of the reaction between Prx1 CPSOH and H2O2 to produce Prx1 CPSO2. The values of kobs were obtained by fitting the traces, similar to those shown in B, to a single exponential equation. Plotting the values of kobs versus H2O2 concentration yielded a straight line, with the slope providing the apparent second-order rate constant of 2.9 ± 0.2 × 10³ m−1 ·s−1. The kobs values plotted in C are the mean ± S.D. obtained from three independent experiments. D, determination of the second-order rate constant of the reaction between Prx1 CPSOH and HCO4 to produce Prx1 CPSO2. The values of kobs were obtained by fitting the traces obtained in experiments similar to those shown in B but with H2O2 (0.5 mm) and variable concentrations of HCO3/CO2 (25–100 mm) to a single exponential equation. Plotting the values of kobs against HCO4 concentrations calculated from Equation 1 yielded a straight line, the slop of which provided the apparent second-order rate constant of (1.5 ± 0.1) × 105 m−1·s−1. The kobs values plotted in D are the mean ± S.D. obtained from three independent experiments. The reactions in B–D were performed in phosphate buffer (50 mm) containing 0.1 mm DTPA, pH 7.4, at 25 °C as described under “Experimental procedures.”
Figure 7.
Figure 7.
Schematic representation of the equilibria involved in HCO4 formation from H2O2 and HCO3/CO2 (A) and of the mechanism proposed for the stimulatory effect of HCO3/CO2 on H2O2-mediated Prx1 hyperoxidation and inactivation is shown. A, mechanism of HCO4 formation from H2O2/HOO was from Richardson and co-workers (43); the rate constants of all proposed reactions (Table S1) were used to perform the computer simulation HCO4 formation from H2O2 (0.5 mm) and HCO3/CO2 (25 mm) displayed in Fig. S4. B, stimulatory effect of HCO3/CO2 on H2O2-mediated Prx1 hyperoxidation is attributed to HCO4. 2-Cys Prx is represented by its minimal functional unit, which is a homodimer, with one of the peroxidatic (CPS) and one of the resolving Cys (CRSH) shown. HCO4 coexists in H2O2 solutions containing HCO3/CO2 (Fig. 6A) and oxidizes CPSOH to CPSO2 with a second-order rate constant 2 orders of magnitude higher than that of H2O2. HCO4 should not influence the first step of the Prx1 catalytic cycle, because the reduction of H2O2 and concomitant oxidation of CPS to CPSOH is extremely rapid. Prx1 hyperoxidation is an inactivation pathway that depends on specific Prx1 structural features that determine the lifetime of the CPSOH intermediate. Because HCO4 is considerably more reactive toward the CPSOH intermediate than H2O2, it will redirect higher levels of CPSOH from the catalytic cycle to the hyperoxidation and inactivation pathway. Our data suggested but did not prove that HCO4 oxidizes CPSO2H to CPSO3H more rapidly than H2O2 justifying the use of broken lines in the second step of the hyperoxidation pathway (see text).

Similar articles

Cited by

References

    1. Rhee S. G., Woo H. A., Kil I. S., and Bae S. H. (2012) Peroxiredoxin functions as a peroxidase and a regulator and sensor of local peroxides. J. Biol. Chem. 287, 4403–4410 10.1074/jbc.R111.283432 - DOI - PMC - PubMed
    1. Perkins A., Nelson K. J., Parsonage D., Poole L. B., and Karplus P. A. (2015) Peroxiredoxins: guardians against oxidative stress and modulators of peroxide signaling. Trends Biochem. Sci. 40, 435–445 10.1016/j.tibs.2015.05.001 - DOI - PMC - PubMed
    1. Sobotta M. C., Liou W., Stöcker S., Talwar D., Oehler M., Ruppert T., Scharf A. N., and Dick T. P. (2015) Peroxiredoxin-2 and STAT3 form a redox relay for H2O2 signaling. Nat. Chem. Biol. 11, 64–70 10.1038/nchembio.1695 - DOI - PubMed
    1. Netto L. E., and Antunes F. (2016) The roles of peroxiredoxin and thioredoxin in hydrogen peroxide sensing and in signal transduction. Mol. Cells 39, 65–71 10.14348/molcells.2016.2349 - DOI - PMC - PubMed
    1. Wood Z. A., Schröder E., Robin Harris J., and Poole L. B. (2003) Structure, mechanism and regulation of peroxiredoxins. Trends Biochem. Sci. 28, 32–40 10.1016/S0968-0004(02)00003-8 - DOI - PubMed

Publication types

MeSH terms

LinkOut - more resources