. 2019 Jul 31;10(1):3359.
doi: 10.1038/s41467-019-11272-z.

A comprehensive examination of Nanopore native RNA sequencing for characterization of complex transcriptomes

Affiliations

A comprehensive examination of Nanopore native RNA sequencing for characterization of complex transcriptomes

Charlotte Soneson et al. Nat Commun. .

Abstract

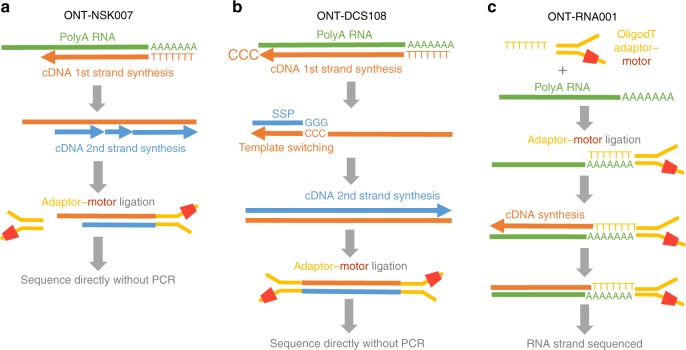
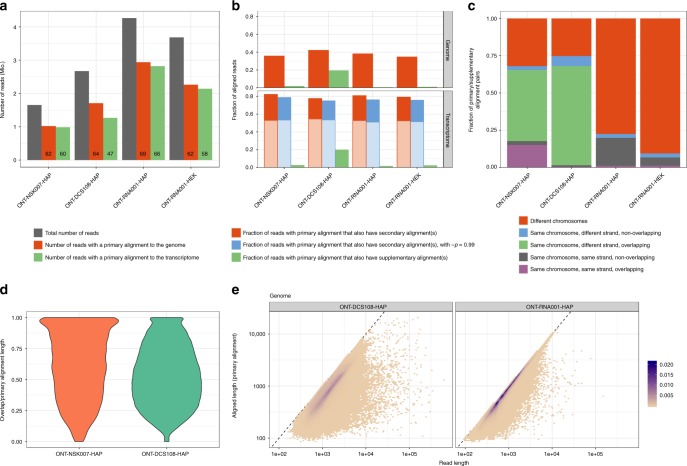
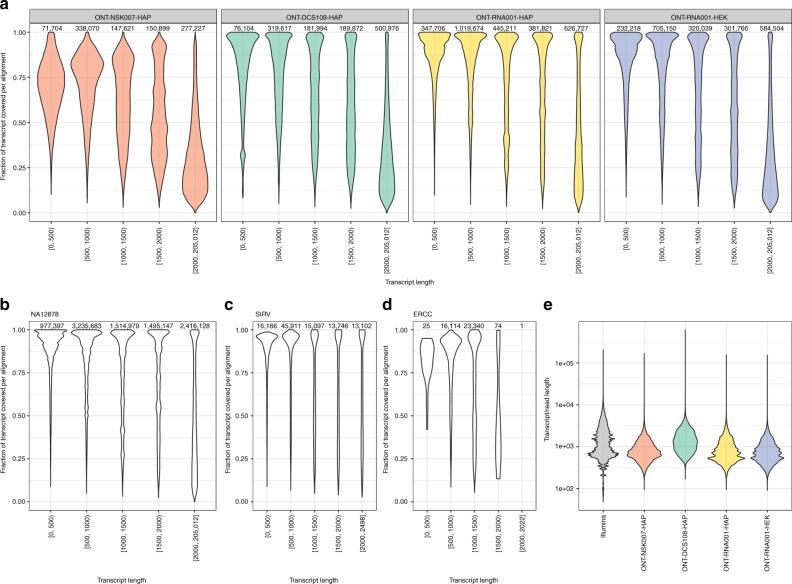
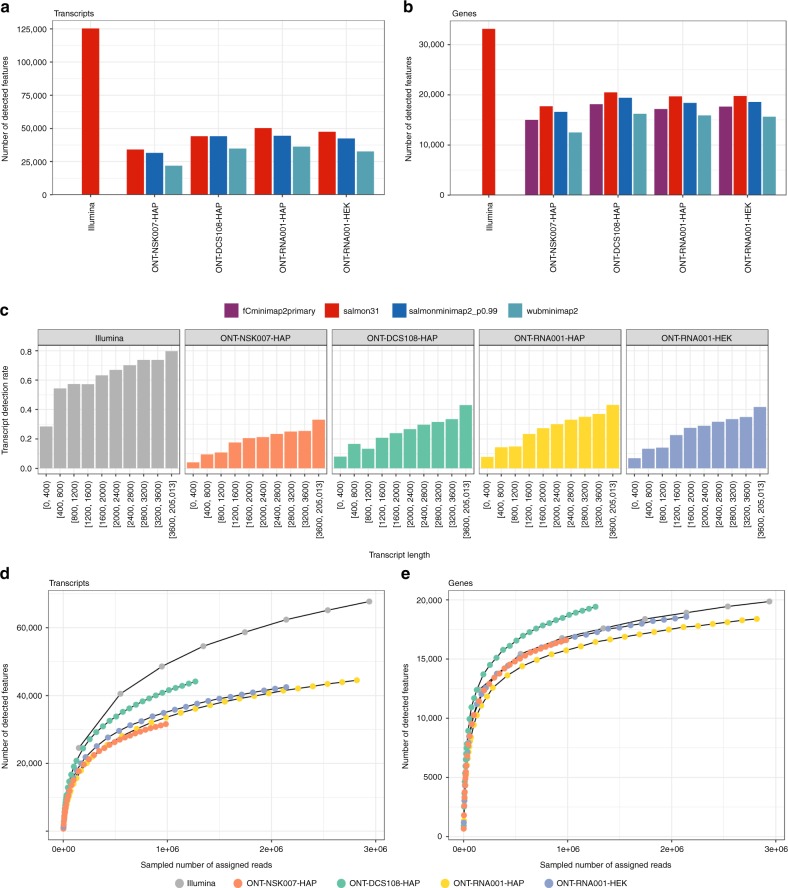
A platform for highly parallel direct sequencing of native RNA strands was recently described by Oxford Nanopore Technologies, but despite initial efforts it remains crucial to further investigate the technology for quantification of complex transcriptomes. Here we undertake native RNA sequencing of polyA + RNA from two human cell lines, analysing ~5.2 million aligned native RNA reads. To enable informative comparisons, we also perform relevant ONT direct cDNA- and Illumina-sequencing. We find that while native RNA sequencing does enable some of the anticipated advantages, key unexpected aspects currently hamper its performance, most notably the quite frequent inability to obtain full-length transcripts from single reads, as well as difficulties to unambiguously infer their true transcript of origin. While characterising issues that need to be addressed when investigating more complex transcriptomes, our study highlights that with some defined improvements, native RNA sequencing could be an important addition to the mammalian transcriptomics toolbox.


Conflict of interest statement

The authors declare no competing interests.

Figures

Fig. 1
Fig. 1
Overview of library preparation workflows used in this study. a In the ONT-NSK007 cDNA library preparation method, polyA RNA is used as a template for first strand cDNA synthesis which is initiated from an oligodT primer. The NEB second strand cDNA synthesis module (E6111) is then used to generate double-stranded cDNAs; here random primers are used to initiate cDNA synthesis, the products of which are then stitched together by DNA ligase. Note that since priming of second strand synthesis occurs randomly, this may not always begin from the very end of the first strand template, as depicted in the example here. Adaptor–motor complexes are then ligated to the double-stranded cDNA ends, although in instances where the first strand overhang might be particularly long, as in the example here, it is unlikely that the adaptor–motor complex will ligate efficiently to enable sequencing of the second strand. b To better enrich for full-length cDNAs, the ONT-DCS108 direct cDNA sequencing kit, which leverages template-switching, was used. When the first strand cDNA synthesis reaches the end of the RNA molecule, the reverse transcriptase will add a few non-templated Cs to the end of the cDNA. A strand-switching primer (SSP) present in the reaction binds to these non-templated Cs, and the reverse transcriptase then switches template from the RNA to the SSP. The second cDNA strand, presuming its synthesis continues to the end of the first strand template as in the example here, will also span the full length of the primary polyA RNA template; note, however, that in many instances a non-full-length second cDNA strand will likely be sequenced. c The ONT-RNA001 workflow enables sequencing of native RNA strands. Here an oligodT-adaptor-motor complex is ligated to the polyA end of the RNA. In order to relax the secondary structure of the RNA (and thus help ensure efficient translocation of the RNA strand through the nanopore), a cDNA synthesis step is performed. Since only the RNA strand has a motor ligated, the RNA molecule, but not the cDNA strand, is sequenced
Fig. 2
Fig. 2
Characterization of aligned reads. a Total number of reads and number of reads with a primary alignment to the genome and transcriptome, respectively, in each of the ONT data sets. The number displayed in each bar represents the alignment rate in % (the fraction of the total number of reads for which minimap2 reports an alignment). b Fraction of the reads with a primary alignment to the genome or transcriptome, respectively, that also have at least one reported secondary or supplementary alignment. The lighter shaded parts of the secondary transcriptome alignment bars correspond to reads where all primary and secondary alignments are to isoforms of the same gene, while the darker shaded parts correspond to reads with reported alignments to transcripts from different genes. c Investigation of supplementary genome alignments. Each supplementary alignment is categorized based on whether it is on the same chromosome and strand as the primary alignment, and if the alignment positions of the primary and supplementary alignments overlap. d Length of the overlap between the primary and supplementary alignments, divided by the primary alignment length (number of M and D characters in the CIGAR string), for supplementary alignments falling on the same chromosome, but different strand, and overlapping, the primary alignment (light green fractions in panel c). e Total read length (x) vs aligned length (y, the sum of the number of M and I characters in the CIGAR string) for the primary genome alignment of each read, summarized across the replicates in the ONT-DCS108-HAP and ONT-RNA001-HAP data sets. The color indicates point density. Source data for panels ac are provided as a Source Data file
Fig. 3
Fig. 3
Transcript coverage fraction by individual reads. a Distribution of coverage fractions of transcripts by individual reads, for each of the four ONT data sets, stratified by the length of the target transcript. The target transcript was selected to maximize the coverage fraction, among all reported long enough alignments (see Methods), and thus the reported coverage fractions represent upper bounds of the true ones. The number above each violin indicates the number of processed alignments to transcripts in the corresponding length category. bd Distribution of coverage fractions of transcripts by individual reads for the NA12878, SIRV, and ERCC data sets. e Observed distribution of raw read lengths for reads with at least one genome alignment (for ONT data sets) and expected distribution of transcript molecule lengths based on annotated transcript lengths and estimated abundances in the Illumina samples
Fig. 4
Fig. 4
Detection of annotated transcripts and genes. a, b Number of detected transcripts and genes with the applied abundance estimation methods. Here, a feature is considered detected if the estimated read count is ≥1. c Fraction of transcripts detected (with estimated count ≥ 1), stratified by transcript length, in the respective data sets. d, e Saturation of transcript and gene detection in ONT and Illumina data sets. For each data set, we aggregated reads across all replicates, subsampled the reads and recorded the number of transcripts and genes detected with an estimated salmonminimap2 count (ONT libraries) or Salmon count (Illumina libraries) ≥1. The Illumina curves are truncated to the range of read numbers observed in the ONT data sets. Source data are provided as a Source Data file
Fig. 5
Fig. 5
Investigation of transcript identifiability. a, b Annotation status of junctions observed in each ONT and Illumina data set. A junction is considered observed if it is supported by at least 1 (a) or 5 (b) reads. For each observed junction, the distance to each annotated junction was defined as the absolute difference between their start positions plus the absolute difference between their end positions. This distance was used to find the closest annotated junction. c Distribution of the number of transcripts contained in the Salmon equivalence class that a read is assigned to, across all reads, for each ONT and Illumina data set. The center line represents the median; hinges represent first and third quartiles; whiskers the most extreme values within 1.5 interquartile range from the box. d As (c), but zoomed in to the range [0, 15]. The black diamond shape indicates the mean. Source data for panels a, b are provided as a Source Data file
Fig. 6
Fig. 6
Characterization of transcripts identified by FLAIR. a Structural category distribution for de novo identified transcripts from FLAIR (for ONT libraries) or StringTie (for Illumina libraries), compared with the set of annotated transcripts using SQANTI. The number above each bar represents the number of assembled transcripts. The structural category for a transcript indicates its relation to the closest annotated transcript. The _ILMNjunc suffix indicates that junctions identified in the Illumina libraries were supplied when running FLAIR. b Number of exons in each transcript identified by FLAIR/StringTie, stratified by the relation to the annotated transcripts (represented by the assigned structural category). c Length distribution of transcripts identified by FLAIR/StringTie, stratified by the relation to the annotated transcripts (represented by the assigned structural category). The center line represents the median; hinges represent first and third quartiles; whiskers the most extreme values within 1.5 interquartile range from the box. Source data for panels a, b are provided as a Source Data file
Fig. 7
Fig. 7
Comparison of annotated transcripts identified by FLAIR in the four ONT data sets. a UpSet plot representing overlaps between the annotated transcripts that are identified by FLAIR in the different ONT data sets. An annotated transcript is considered to be identified if at least one FLAIR transcript is assigned to it with a structural category annotation of either ‘full-splice_match’ or ‘incomplete-splice_match’. These sets of annotated transcripts are then compared between data sets. Horizontal bars indicate the total number of identified annotated transcripts in the respective data sets, and vertical bars represent the size of each intersection of one or more sets of identified transcripts. b Average abundance across the Illumina samples, for annotated transcripts that are considered identified or not by FLAIR. An annotated transcript is considered to be identified if at least one FLAIR transcript from at least one data set is assigned to it with a structural category annotation of either ‘full-splice_match’ or ‘incomplete-splice_match’. The center line represents the median; hinges represent first and third quartiles; whiskers the most extreme values within 1.5 interquartile range from the box
Fig. 8
Fig. 8
Evaluation of polyA tail length estimates. a Overall distribution of polyA tail length estimates from Nanopolish and tailfindr. b Agreement between polyA tail length estimates from Nanopolish (x) and tailfindr (y). c Distribution of estimated polyA tail lengths for reads assigned to transcripts of different biotypes. Only biotypes with at least 10 assigned reads are shown. For boxplots, the center line represents the median; hinges represent first and third quartiles; whiskers the most extreme values within 1.5 interquartile range from the box. In these plots, a single outlier read with a polyA tail length estimate from Nanopolish exceeding 3 kb was excluded

References

    1. Keren H, Lev-Maor G, Ast G. Alternative splicing and evolution: diversification, exon definition and function. Nat. Rev. Genet. 2010;11:345–355. doi: 10.1038/nrg2776. - DOI - PubMed
    1. Pan Q, Shai O, Lee LJ, Frey BJ, Blencowe BJ. Deep surveying of alternative splicing complexity in the human transcriptome by high-throughput sequencing. Nat. Genet. 2008;40:1413–1415. doi: 10.1038/ng.259. - DOI - PubMed
    1. Wang ET, et al. Alternative isoform regulation in human tissue transcriptomes. Nature. 2008;456:470–476. doi: 10.1038/nature07509. - DOI - PMC - PubMed
    1. Mercer TR, et al. Targeted RNA sequencing reveals the deep complexity of the human transcriptome. Nat. Biotechnol. 2011;30:99–104. doi: 10.1038/nbt.2024. - DOI - PMC - PubMed
    1. Vaquero-Garcia J, et al. A new view of transcriptome complexity and regulation through the lens of local splicing variations. Elife. 2016;5:e11752. doi: 10.7554/eLife.11752. - DOI - PMC - PubMed

Publication types