

A clinically applicable approach to continuous prediction of future acute kidney injury
- PMID: 31367026
- PMCID: PMC6722431
- DOI: 10.1038/s41586-019-1390-1
A clinically applicable approach to continuous prediction of future acute kidney injury
Abstract
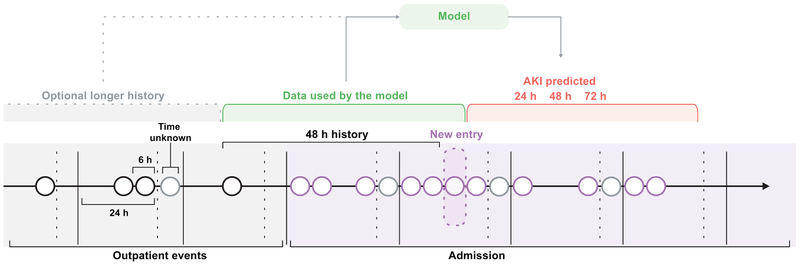
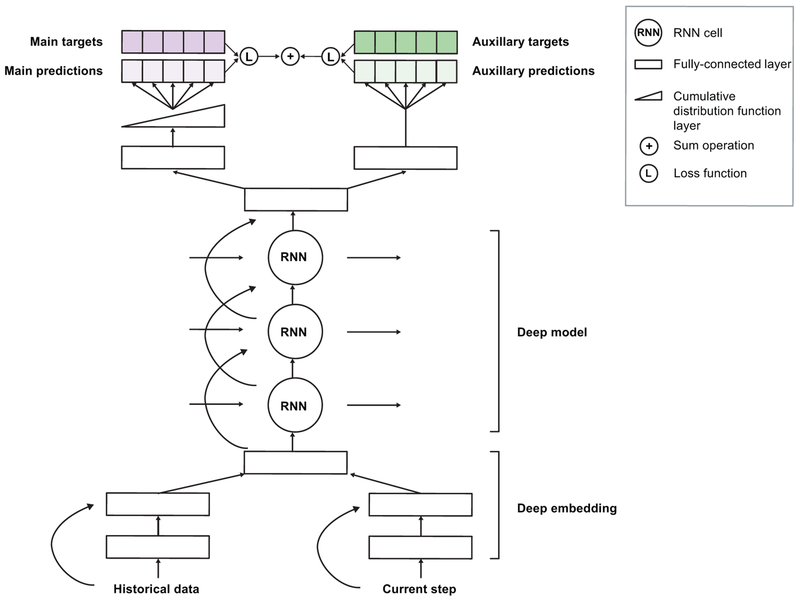
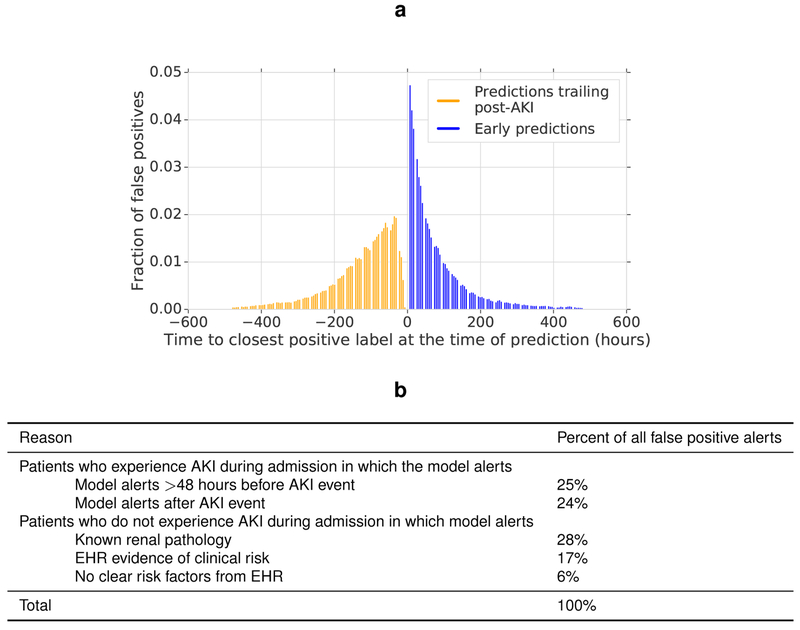
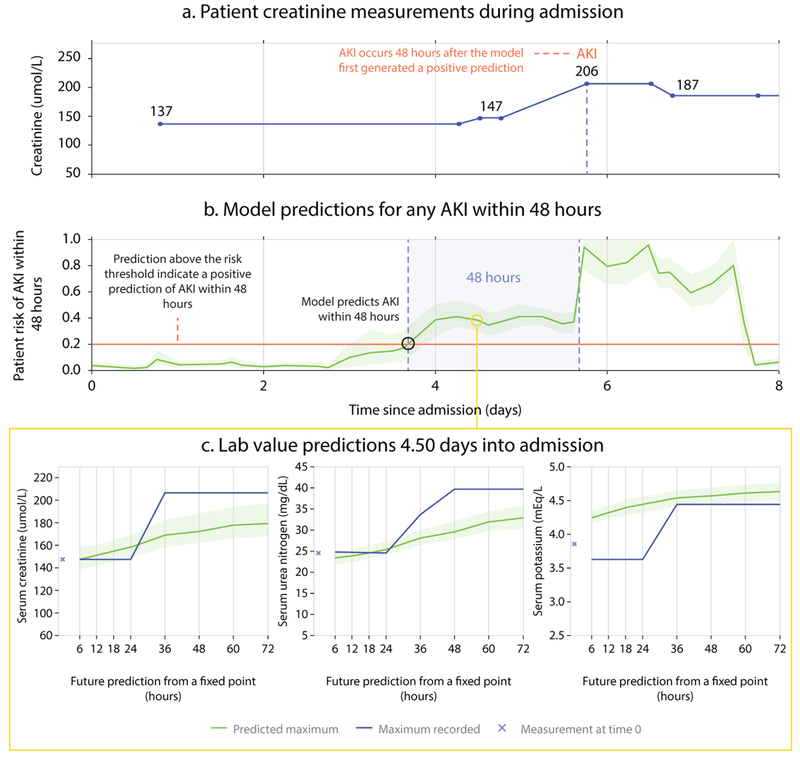
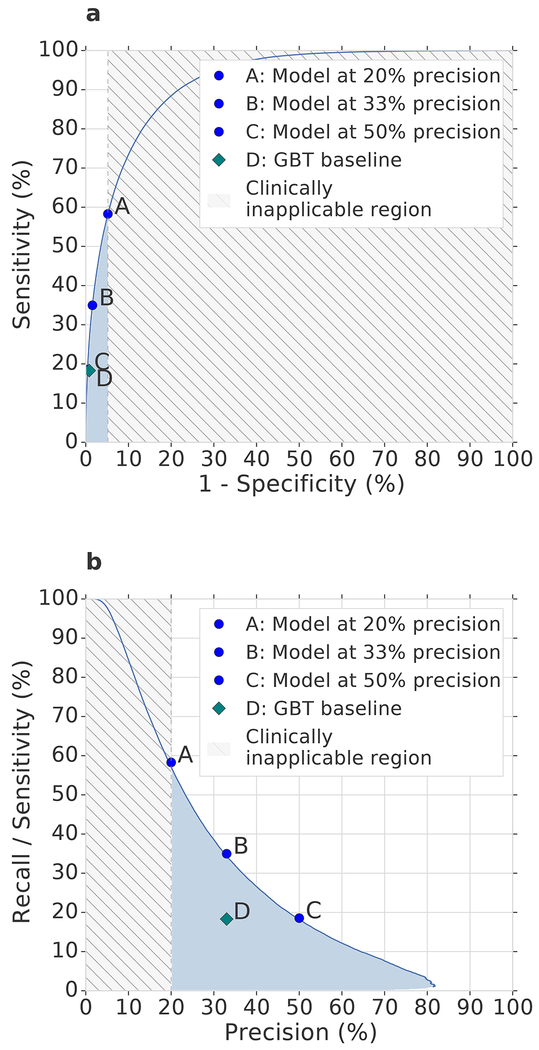
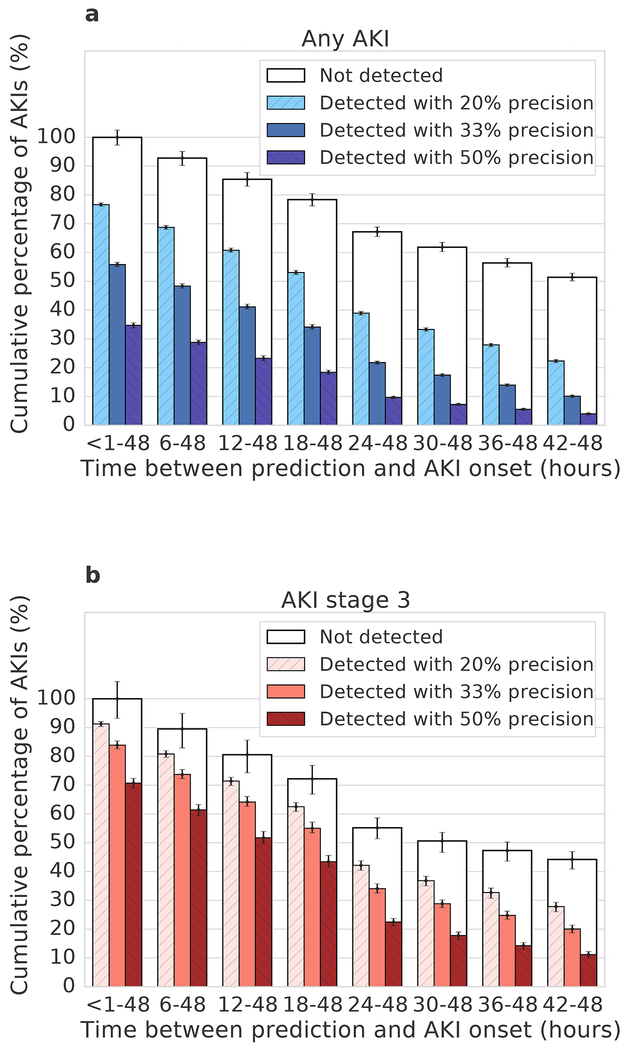
The early prediction of deterioration could have an important role in supporting healthcare professionals, as an estimated 11% of deaths in hospital follow a failure to promptly recognize and treat deteriorating patients1. To achieve this goal requires predictions of patient risk that are continuously updated and accurate, and delivered at an individual level with sufficient context and enough time to act. Here we develop a deep learning approach for the continuous risk prediction of future deterioration in patients, building on recent work that models adverse events from electronic health records2-17 and using acute kidney injury-a common and potentially life-threatening condition18-as an exemplar. Our model was developed on a large, longitudinal dataset of electronic health records that cover diverse clinical environments, comprising 703,782 adult patients across 172 inpatient and 1,062 outpatient sites. Our model predicts 55.8% of all inpatient episodes of acute kidney injury, and 90.2% of all acute kidney injuries that required subsequent administration of dialysis, with a lead time of up to 48 h and a ratio of 2 false alerts for every true alert. In addition to predicting future acute kidney injury, our model provides confidence assessments and a list of the clinical features that are most salient to each prediction, alongside predicted future trajectories for clinically relevant blood tests9. Although the recognition and prompt treatment of acute kidney injury is known to be challenging, our approach may offer opportunities for identifying patients at risk within a time window that enables early treatment.
Conflict of interest statement
G.R., H.M. and C.L. are paid contractors of DeepMind. The authors have no other competing interests to disclose.
Figures
Comment in
-
Deep learning detects impending organ injury in the clinic.Nature. 2019 Aug;572(7767):36-37. doi: 10.1038/d41586-019-02308-x. Nature. 2019. PMID: 31367025 No abstract available.
-
Artificial intelligence to predict AKI: is it a breakthrough?Nat Rev Nephrol. 2019 Nov;15(11):663-664. doi: 10.1038/s41581-019-0203-y. Nat Rev Nephrol. 2019. PMID: 31506607 Free PMC article.
-
Machine Learning to Predict Acute Kidney Injury.Am J Kidney Dis. 2020 Jun;75(6):965-967. doi: 10.1053/j.ajkd.2019.08.010. Epub 2019 Oct 31. Am J Kidney Dis. 2020. PMID: 31677894 Free PMC article. No abstract available.
-
Forecasting the development of acute kidney injury using a recurrent neural network.Cardiovasc Res. 2019 Dec 1;115(14):e155-e157. doi: 10.1093/cvr/cvz279. Cardiovasc Res. 2019. PMID: 31697360 No abstract available.
-
Continuous prediction of future acute kidney injury: a step forward.Kidney Int. 2020 Jun;97(6):1094-1096. doi: 10.1016/j.kint.2020.02.013. Kidney Int. 2020. PMID: 32444087 No abstract available.
References
-
- Thomson R, Luettel D, Healey F, and Scobie S, “Safer care for the acutely ill patient: Learning from serious incidents”, National Patient Safety Agency, 2007.
-
- Henry KE, Hager DN, Pronovost PJ, and Saria S, “A targeted real-time early warning score (trewscore) for septic shock”, Science Translational Medicine, vol. 7, no. 299, pp. 299ra122–299ra122, 2015. - PubMed
-
- Rajkomar A, Oren E, Chen K, Dai AM, Hajaj N, Hardt M, Liu PJ, Liu X, Marcus J, Sun M, Sundberg P, Yee H, Zhang K, Zhang Y, Flores G, Duggan GE, Irvine J, Le Q, Litsch K, Mossin A, Tansuwan J, Wang D, Wexler J, Wilson J, Ludwig D, Volchenboum SL, Chou K, Pearson M, Madabushi S, Shah NH, Butte AJ, Howell M, Cui C, Corrado G, and Dean J, “Scalable and accurate deep learning with electronic health records”, NPJ Digital Medicine, vol. 1, no. 1, 2018. - PMC - PubMed
Methods-only References
-
- Department of Veterans Affairs, “Veterans Health Administration: Providing health care for Veterans.” https://www.va.gov/health/, 2018. (Accessed November 9, 2018).
-
- Razavian N and Sontag D, “Temporal convolutional neural networks for diagnosis from lab tests,” arXiv Preprint, arXiv:1511.07938, 2015.
-
- Zadrozny B and Elkan C, “Transforming classifier scores into accurate multiclass prob-ability estimates,” in Proceedings of the 8th ACM SIGKDD International Conference on Knowledge Discovery and Data Mining, pp. 694–699, ACM, 2002.
-
- Zilly JG, Srivastava RK, Koutník J, and Schmidhuber J, “Recurrent highway net-works,” in Proceedings of the International Conference on Machine Learning (Precupand D Teh YW, eds.), vol. 70, pp. 4189–4198, 2017.
-
- Hochreiter S and Schmidhuber J, “Long short-term memory,” Neural Computation, vol. 9, no. 8, pp. 1735–1780, 1997. - PubMed
MeSH terms
Grants and funding
LinkOut - more resources
Full Text Sources
Other Literature Sources
Medical
