. 2019 Aug;572(7769):329-334.
doi: 10.1038/s41586-019-1451-5. Epub 2019 Jul 31.

Human placenta has no microbiome but can contain potential pathogens

Affiliations

Human placenta has no microbiome but can contain potential pathogens

Marcus C de Goffau et al. Nature. 2019 Aug.

Erratum in

Abstract

We sought to determine whether pre-eclampsia, spontaneous preterm birth or the delivery of infants who are small for gestational age were associated with the presence of bacterial DNA in the human placenta. Here we show that there was no evidence for the presence of bacteria in the large majority of placental samples, from both complicated and uncomplicated pregnancies. Almost all signals were related either to the acquisition of bacteria during labour and delivery, or to contamination of laboratory reagents with bacterial DNA. The exception was Streptococcus agalactiae (group B Streptococcus), for which non-contaminant signals were detected in approximately 5% of samples collected before the onset of labour. We conclude that bacterial infection of the placenta is not a common cause of adverse pregnancy outcome and that the human placenta does not have a microbiome, but it does represent a potential site of perinatal acquisition of S. agalactiae, a major cause of neonatal sepsis.


Conflict of interest statement

Competing interests

JP reports grants from Pfizer, personal fees from Next Gen Diagnostics Llc, outside the submitted work; SJP reports personal fees from Specific, personal fees from Next Gen Diagnostics, outside the submitted work; DSC-J reports grants from GlaxoSmithKline Research and Development Limited, outside the submitted work and non-financial support from Roche Diagnostics Ltd, outside the submitted work; GCSS reports grants and personal fees from GlaxoSmithKline Research and Development Limited, personal fees and non-financial support from Roche Diagnostics Ltd, outside the submitted work; DSC-J and GCSS report grants from Sera Prognostics Inc, non-financial support from Illumina inc, outside the submitted work. MCG, SL, US, FG and EC have nothing to disclose.

Figures
Extended Data Fig. 1
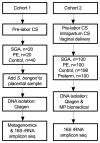
Extended Data Fig. 1. Two cohorts of placental samples were analysed.
Cohort 1 (n=80) contained only samples from pre-labour CS and S. bongori was added to the samples before DNA isolation as a positive control. The samples in cohort 1 was analysed by both metagenomics as well as by 16S rRNA amplicon sequencing. Cohort 2 (n=498) contained placental samples from CS and vaginal deliveries. DNA was isolated twice from each placental sample with two different DNA extraction kits. The samples were analysed by 16S rRNA amplicon sequencing. CS = Caesarean section, SGA = small for gestational age (birth weight <5th percentile) using a customized reference, PE = preeclampsia using the ACOG 2013 definition, Preterm= birth at <37 week’s gestation.
Extended Data Fig. 2
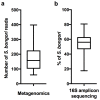
Extended Data Fig. 2. Positive control experiment comparison between metagenomics and 16S amplicon sequencing.
Adding approximately 1,100 CFU of S. bongori to the placental tissue before DNA isolation resulted in a) an average of 180 reads (SD: 90 reads) by metagenomic sequencing (n=80) or b) on average 54% of all 16S rRNA amplicon sequencing reads (~33,000 reads) being identified as S. bongori (SD: 13%; n=79). Box represents the interquartile range. Whiskers represent Max/Min in both figures.
Extended Data Fig. 3
Extended Data Fig. 3. Strain analysis of E. coli reads found by metagenomics.
All reads identified in all 80 samples by Kraken as E. coli were extracted and mapped together against the closest E. coli reference genome (Genbank: CP02409.1). Single Nucleotide Polymorphisms (SNPs), shown in red, were consistent for all samples across the genome. SNPs were rare, except in the fimbrial chaperone protein gene (EcpD) indicated in light red. Sequence differences which appear as short sporadic red lines represent sequencing errors. Strain variation would have resulted in dashed vertical lines.
Extended Data Fig. 4
Extended Data Fig. 4. Detailed heatmap metagenomic data.
Heatmap showing the abundance of all non-human reads as detected by metagenomics. Human reads remaining after filtering (89.8%, SD: 1.5%) are not shown for scaling purposes. The majority of taxa (shown on the right) are found in higher abundance within groups 1 and/or 2 (indicated on the left with light blue and purple, respectively). The purple box highlights the samples and species associated with group 2. The lane ID of each sample is represented by the first number (x-axis). All samples from lanes 4 and 5 form Group 2 and all samples from lanes 8 and 9 form Group 3 (see Figs. 1a-b).
Extended Data Fig. 5
Extended Data Fig. 5. Species associated with batch effects visualized by PCA also do not show signal reproducibility.
a) Principal component analyses of selections of samples from Cohort 2 (16S), or of all Cohort 2 samples as shown here, allows for the identification of batch effects and allows for the identification of contaminating species associated with the use of specific DNA isolation methods/kits and/or other reagents. An analysis of all samples shows that principal components 3 (x-axis) and 4 (y-axis) are strongly correlated with the use of Qiagen or specific Mpbio DNA isolation kits. b) Examples of bacteria detected in high abundance and frequency when processed with the Qiagen (x-axis) and/or Mpbio (y-axis) DNA isolation kit. Patterns lacking positive correlation (compare with Fig. 2a) demonstrate that signals are not sample but batch associated.
Extended Data Fig. 6
Extended Data Fig. 6. Scatterplot representations of the abundance of a) Bradyrhizobium and b) Burkholderia in respect to sequencing run batch effects and c) vaginal lactobacilli and d) vaginosis bacteria in respect to the mode of delivery found during 16S amplicon sequencing.
In a & b Numbers in brackets indicate the number of samples sequenced in a given run. Values of zero are not shown on the logarithmic axis. c,d) Comparisons between modes of delivery were performed by Mann-Whitney U tests, where values below 1% are regarded as 0% (not biologically relevant). * P < 0.05, *** P < 0.001.
Extended Data Fig. 7
Extended Data Fig. 7. Mode of delivery and the detection of bacterial signals.
a, b) The association of vaginal lactobacilli with the mode of delivery, as determined by the analysis of 466 samples by 16S amplicon sequencing which were successfully sequenced twice using Mpbio (a) and Qiagen (b) DNA isolation. Comparisons of the Mpbio and Qiagen DNA isolations highlight that the same patterns are observed in the associations with mode of delivery. Comparisons also show that the Qiagen DNA isolation was more sensitive, resulting in twice as many signals above the 1% threshold. Figures c-h were generated using all 498 placental samples using the highest value of either DNA isolation method for each bacterial group per sample. c, d) S. agalactiae was not associated with the mode of delivery irrespective of whether a 0.1% threshold was used (the 16S detection limit, relevant for detecting traces of contamination during delivery) or whether a 1% threshold was used (the minimum percentage considered to be potentially ecologically relevant). e, f) The Ureaplasma genus was associated with the mode of delivery, comparable to Figure 2c which describes the combination of all vaginosis associated bacteria. g, h) F. nucleatum was not associated with the mode of delivery, irrespective of threshold. Comparisons between modes of delivery were performed by Mann-Whitney U tests. * P < 0.05, ** P < 0.01, *** P < 0.001.
Extended Data Fig. 8
Extended Data Fig. 8. Heatmap of Spearman’s rho correlation coefficients of bacterial signals as found by 16S rRNA amplicon sequencing.
Sample-associated signals (red bar), are typically identified by elevated kappa scores as shown in Supplementary Table 4. Reagent contaminants are indicated with a blue bar. Vaginosis associated bacteria (purple bar) show positive correlations (purple square) with each other, Lactobacillus iners and fecal bacteria (brown bar). Lactobacilli (yellow bar) show limited positive correlation with fecal bacteria. Reagent contaminants mainly associated with the Qiagen (light blue) or the Mpbio kit (green) form distinct clusters. Species which are strongly associated with sample collection contamination in 2012-2013 are indicated in orange. For each species the highest value (%) found using either the Qiagen or the Mpbio DNA isolation kit, was used as input (using all 498 samples).
Extended Data Fig. 9
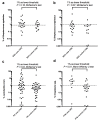
Extended Data Fig. 9. Bacterial signals and adverse pregnancy outcome.
Scatterplot representations of the association of a) S. agalactiae with SGA, b) S. anginosus with SGA, c) L. iners with preeclampsia, and d) Ureaplasma with PTB. Samples with 0% signal are not shown. Signals above 1% (dotted line) are regarded as positive for the McNemar’s test (a-c) and signals below 1% are considered 0% (d).
Fig. 1
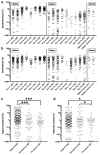
Fig. 1. Batch effect detection in metagenomic and 16S rRNA amplicon sequencing data, Cohort 1 samples.
a-c) Summary of metagenomics data. a) PCA of summarized genus level Kraken output. b) MiSeq sequencing runs (n=8 per run). c) Heatmap of all non-human read abundance (see Extended Data Figure 4). d,e) Read abundance by run and DNA isolation method (Mpbio or Qiagen) in chronological order, (d) Bradyrhizobium, and (e) Burkholderia. Scatterplots are shown in Extended Data Fig. 6. f) Associations between Thiohalocapsa halophila and Q5 Buffer or Taq polymerase. Interquartile range is shown. * P < 0.001. g) D. geothermalis detection (>0.1% reads) by year of delivery. Number of samples in each group (n).
Fig. 2
Fig. 2. Mode of delivery and detection of vaginal bacteria by 16S rRNA amplicon sequencing.
a) Concordant detection of vaginal lactobacilli and a combination of all vaginosis associated bacteria by both Qiagen (x-axis) and Mpbio (y-axis) results in Spearman’s rho correlation coefficients of 0.37 and 0.59, respectively when analysing the upper right quadrant only (>0.1%). b,c) Comparisons with vaginally associated bacteria and mode of delivery. Mann-Whitney U tests were used where values below 1% are regarded as 0%. * P < 0.05, *** P < 0.001. Scatterplots are in Extended Data Fig. 6. Percent read count based on the higher value for given species using Qiagen or Mpbio DNA isolation kit (using all 498 samples).
Fig. 3
Fig. 3. Bacterial signals and adverse pregnancy outcome.
a-d) Adjusted odds ratios for the association of S. agalactiae, L. iners, S. anginosus and Ureaplasma spp. with PTB, SGA and PE. PE and SGA both had 100 matched cases and controls. The PTB analysis included 56 preterm cases and 136 unmatched controls (all vaginally delivered). Odds ratios were adjusted for clinical characteristics by logistic regression. The odds ratio and its confidence interval cannot be calculated for S. anginosus and SGA because one of the discordant values is zero. Additional details are in Supplementary Table 5.
Fig. 4
Fig. 4. Sources of bacterial signals detected in human placental samples.
Bacteria may sometimes be present in utero, such as S. agalactiae. Bacteria or bacterial DNA also frequently contaminate the placenta during labour and delivery (e.g. Lactobacillus), during sample collection (e.g. D. geothermalis), and always during sample processing (e.g. B. silvatlantica and T. halophila). Contamination may also occur during library preparation or sequencing from other projects carried out at the facility (e.g. V. cholera in the metagenomic sequencing).

Comment in

Similar articles

Cited by

References

    1. Brosens I, Pijnenborg R, Vercruysse L, Romero R. The “Great Obstetrical Syndromes” are associated with disorders of deep placentation. Am J Obstet Gynecol. 2011;204:193–201. - PMC - PubMed
    1. Aagaard K, et al. The placenta harbors a unique microbiome. Sci Transl Med. 2014;6 237ra65. - PMC - PubMed
    1. Antony KM, et al. The preterm placental microbiome varies in association with excess maternal gestational weight gain. Am J Obstet Gynecol. 2015;212:653.e1–16. - PMC - PubMed
    1. Collado MC, Rautava S, Aakko J, Isolauri E, Salminen S. Human gut colonization may be initiated in utero by distinct microbial communities in the placenta and amniotic fluid. Sci Rep. 2016;6:23129. - PMC - PubMed
    1. Perez-Muñoz ME, Arrieta MC, Ramer-Tait AE, Walter J. A critical assessment of the “sterile womb” and “in utero colonization” hypotheses: implications for research on the pioneer infant microbiome. Microbiome. 2017;5:48. - PMC - PubMed

MeSH terms