. 2019 Aug;572(7768):244-248.
doi: 10.1038/s41586-019-1453-3. Epub 2019 Jul 31.

Cholera toxin promotes pathogen acquisition of host-derived nutrients

Affiliations

Cholera toxin promotes pathogen acquisition of host-derived nutrients

Fabian Rivera-Chávez et al. Nature. 2019 Aug.

Abstract

Vibrio cholerae is the causative agent of cholera, a potentially lethal enteric bacterial infection1. Cholera toxin (CTX), a protein complex that is secreted by V. cholerae, is required for V. cholerae to cause severe disease. CTX is also thought to promote transmission of the organism, as infected individuals shed many litres of diarrhoeal fluid that typically contains in excess of 1011 organisms per litre. How the pathogen is able to reach such high concentrations in the intestine during infection remains poorly understood. Here we show that CTX increases pathogen growth and induces a distinct V. cholerae transcriptomic signature that is indicative of an iron-depleted gut niche. During infection, bacterial pathogens need to acquire iron, which is an essential nutrient for growth2. Most iron in the mammalian host is found in a chelated form within the porphyrin structure of haem, and the ability to use haem as a source of iron is genetically encoded by V. cholerae3. We show that the genes that enable V. cholerae to obtain iron via haem and vibriobactin confer a growth advantage to the pathogen only when CTX is produced. Furthermore, we found that CTX-induced congestion of capillaries in the terminal ileum correlated with an increased bioavailability of luminal haem. CTX-induced disease in the ileum also led to increased concentrations of long-chain fatty acids and L-lactate metabolites in the lumen, as well as the upregulation of V. cholerae genes that encode enzymes of the tricarboxylic acid (TCA) cycle that contain iron-sulfur clusters. Genetic analysis of V. cholerae suggested that pathogen growth was dependent on the uptake of haem and long-chain fatty acids during infection, but only in a strain capable of producing CTX in vivo. We conclude that CTX-induced disease creates an iron-depleted metabolic niche in the gut, which selectively promotes the growth of V. cholerae through the acquisition of host-derived haem and fatty acids.


Figures

Extended Data Figure 1.
Extended Data Figure 1.. V. cholerae CT production rescues Δctx mutant growth (related to Figure 1).
(a) GM-1 cholera toxin ELISA assay from filtered supernatant of V. cholerae C6706 wild type (wt) (N = 5) or cholera toxin mutant (Δctx) (N = 3) grown in vitro under cholera toxin-inducing (AKI) conditions. Error bars represent means ± SD. (b) Groups of CD-1 mice (N = 4) were infected with a 1:1 mixture of the V. cholerae WT and the Δctx mutant. The competitive index (CI; the ratio of strains recovered) was determined one day after infection. Dotted red lines connect strains recovered from the same animal. Bacterial numbers were compared by unpaired two-sided student t-test. Each dot represents data from an individual animal or experiment. ns, not statistically significantly different.
Extended Data Figure 2.
Extended Data Figure 2.. RNA-seq analysis of V. cholerae in vivo gene expression (related to Figures 1-3).
(a-d) RNA-seq normalized expression (RPKM = reads mapping to gene)/(length of gene/1000)/(total reads mapped to V. cholerae genome/1000000) from wild type or Δctx mutant V. cholerae during infection of 3-day old infant rabbits. Total expression from chromosome I (Chr. I) or chromosome II (Chr. II) from wild type infecting the ileum (a) or cecum (b) or the Δctx mutant infecting the ileum (c) or cecum (d). Correlations (r) are shown between biological replicates (rabbit 1 and rabbit 2).
Extended Data Figure 3.
Extended Data Figure 3.. RNA-seq analysis of the wild type C6706 during colonization of the ileum and cecum (related to Figure 1).
(a-b) RNA-seq analysis of Vibrio cholerae in the ileum and cecum during infection of infant rabbits. (a) PCA plots for RNA-seq data from two biological replicates of V. cholerae wild type from the ileum (black circles) or cecum (red circles) of infant rabbits (N = 2). (b) Differential expression of all V. cholerae ORFs and genes involved in virulence. ToxT (VC0838), Cholera Toxin (VC1456-VC1457), Toxin-Coregulated Pilus (TCP) (VC0825-VC0837), TagA (VC0820), HlyA (VCA0219), and Accessory Colonization Factors (Acf) (VC0840-0844) in the wild type during colonization of the ileum relative to the cecum.
Extended Data Figure 4.
Extended Data Figure 4.. RNA-seq analysis of CT-dependent V. cholerae gene expression during colonization of the gut (related to Figures 1-2).
(a-e) RNA-seq analysis of Vibrio cholerae in the ileum and cecum during infection of infant rabbits. (a) Differential expression of all V. cholerae ORFs and genes involved in virulence. ToxT (VC0838), Cholera Toxin (VC1456-VC1457), Toxin-Coregulated Pilus (TCP) (VC0825-VC0837), TagA (VC0820), HlyA (VCA0219), and Accessory Colonization Factors (VC0840-0844) in the wild type relative to the cholera toxin mutant (Δctx) during infection of the ileum or cecum. (b) Transcript levels of tcpA were determined by quantitative real-time PCR in the wild type (N = 3) relative to the cholera toxin mutant (Δctx) (N = 4) colonizing the ileum (red circles), in LB (white circles) (N = 3) and in the ileum relative to LB in the wild type (grey circles) and cholera toxin mutant (Δctx) (light blue circles). Error bars represent means ± SD. (c) Percent abundance of raw RNA-seq reads aligned to chromosome I (Chr. I; purple) or chromosome II (Chr. II; yellow) from wild type or the cholera toxin mutant (Δctx) in the cecum. (d) Percent abundance of heme utilization genes (VCA0907-VCA0915, VCA0576; red) from raw RNA-seq reads aligned to chromosome II (Chr. II; yellow) from wild type or the cholera toxin mutant (Δctx) in the cecum. (e) DAVID bioinformatics pathway analysis from RNA-seq data of significantly upregulated pathways (positive log2 fold change and adjusted p-value of less than 0.0001) in the wild type relative to the cholera toxin mutant (Δctx) during colonization of the ileum of infant rabbits (N = 2). RNA-seq differential expression analysis p-values were determined and adjusted for multiple testing by the Benjamini-Hochberg method using the R package DESeq2.
Extended Data Figure 5.
Extended Data Figure 5.. RNA-seq analysis of the Vibrio cholerae fur regulon during infection of infant rabbits (related to Figures 1-2).
(a) Heat-map of RNA-seq data from normalized expression (RPKM) of Vibrio cholerae fur regulated genes (listed in Supplementary Table 3) in the wild type relative and the cholera toxin mutant (Δctx) during colonization of the ileum or cecum of infant rabbits. (b) Differential expression of hutA, viuA, and viuB was determined by quantitative real-time PCR analysis from V. cholerae wild type or the cholera toxin mutant (Δctx) in the ileum (N = 3 wild type hutA, viuA, and viuB; N = 6 for Δctx hutA and viuA, N = 4 for Δctx viuB) or in V. cholerae wild type or the cholera toxin mutant (Δctx) grown in LB (N = 3), in LB with 2,2 dipyridyl (N = 3), or in LB with 2,2 dipyridyl and hemin (N = 3). Error bars represent means of log2 transformed mRNA levels determined by quantitative real-time PCR from ileum relative to LB (red circles), LB with 2,2 dipyridyl relative to LB (white circles), and LB with 2,2 dipyridyl and hemin relative to LB (grey circles) ± SD. A two-way ANOVA (Supplementary Table 7) was used to compare normalized expression (ddCT) values between the strains (wt and Δctx mutant) for each treatment (Ileum, 2,2 dipyridyl, 2,2 dipyridyl + 5 μM hemin, and LB) followed by a post-hoc Sidak’s multiple comparisons test. Blue lines on red circles distinguish animals from different litters of Δctx infected infant rabbits. (c) Schematic representation of the genetic region for viuA, viuB, and viuF. ns, not statistically significantly different. (d) Luminal Lipocalin-2 levels determined by ELISA from the ileum and cecum of infant rabbits (N = 4) that were mock-infected or infected with the wild type (wt) or the cholera toxin mutant (Δctx). Error bars represent means ± SD.
Extended Data Figure 6.
Extended Data Figure 6.. Cholera toxin induces capillary congestion and enhances luminal growth of V. cholerae in a mouse model of infection (related to Figures 1-3).
(a-h) Groups of CD-1 mice were mock-infected or infected intragastrically with the wild type (wt), the cholera toxin mutant (Δctx), the Δctx mutant mixed with purified CT, or treated orally with purified cholera toxin (CT) and samples were collected one day after infection. (a) Representative images of H/E-stained ileum tissue sections showing capillary congestion (arrows) from mice infected with the indicated strains or treated orally with purified CT. All images were taken at 60X magnification. (b) Expression of CXCl1 and CXCl2 in the ileal mucosa of mice (N = 4) was determined by quantitative real-time PCR analysis. Error bars represent means of CXCl1 and CXCl2 mRNA levels as fold-change over mRNA levels in mock-infected mice ± SD. An unpaired two-sided Student’s t-test was used to compare the differences in fold-changes between the wt and Δctx mutant. (c) The fluid accumulation ratio (FA) ratio for mice (N = 8 for wild type, Δctx, and mock; N = 4 for CT, and Δctx + CT, N = 5 for wild type, and Δctx 6 h.p.i) treated with the indicated strains or treated orally with purified CT. The FA ratios between the groups were compared using one-way ANOVA (F (6, 35) = 66.03, p < 0.0001) followed by post-hoc Tukey’s multiple comparisons test. Black lines show median for individual animals (black circles). Different shapes indicate animals from different litters. (d) Luminal hemin measurements from the ileum of mice (N = 4) treated with the indicated strains or treated orally with purified CT. Hemin levels in the CT-treated group were compared to the Δctx mutant and mock treated using one-way ANOVA (F (3, 12) = 25.59, p < 0.0001) followed by post-hoc Sidak’s multiple comparisons test. Black lines show median for individual animals (black shapes). (e) The CFU/g and total CFU from the whole gastrointestinal tract (gut) from mice (N = 4) infected with wt or the Δctx mutant. An unpaired two-sided Student’s t-test was used to compare the bacterial concentrations from wt and Δctx mutant infected animals. Error bars represent means ± SD. (f) The CFU/g tissue (ileum) (N = 4) and total CFU from the lumen of the ileum (N = 11 for wild type, N = 9 for Δctx, and N = 4 for Δctx + CT) or lumen of the cecum (N = 8 for wild type, N = 7 for Δctx, and N = 4 for Δctx + CT) of mice infected with the indicated V. cholerae strains. Different shapes indicate animals from different litters. An unpaired two-sided Student’s t-test was used to compare the CFU/g tissue in wt and Δctx mutant infected animals. The wt CFU in the ileum or cecum were compared to the Δctx mutant or mock groups using one-way ANOVA (Ileum: F (2, 21) = 50.24, p < 0.0001; Cecum: F (2, 16) = 51.6, p < 0.0001) followed by post-hoc Sidak’s multiple comparisons test. Error bars represent means ± SD. (g) The CFU in the lumen of the ileum 6 hours post-infection mice infected with V. cholerae. An unpaired two-sided Student’s t-test was used to compare the CFU from wt and Δctx mutant infected animals. Error bars represent means ± SD (h) Luminal LCFA measurements (8 carbon chain or greater) from the ileum of mice (N = 3 for wild type, Δctx, and mock; N = 4 for CT) treated with the indicated strains or treated orally with purified CT. LCFA concentrations in the CT-treated group were compared to the Δctx mutant and mock groups treated using one-way ANOVA (F (3, 9) = 7.814, P = 0.0071) followed by post-hoc Sidak’s multiple comparisons test. Black lines show median for individual animals (black circles). ns, not statistically significantly different.
Extended Data Figure 7.
Extended Data Figure 7.. Differential expression of CT-dependent metabolism-related genes in V. cholerae (related to Figures 1-3).
(a) Groups of CD-1 mice (N = 4) were infected with a 1:1 mixture of the wild type and the indicated mutant (white bars) or with a 1:1 mixture of the mutant harboring a control vector (pWSK129) and the mutant harboring the complemented gene in pWSK29 (grey bars). The competitive index for the wild type versus the fadL mutant from the first experiment (N = 4) in Fig. 3f is shown for comparison. The competitive index (CI; the ratio of strains recovered) was determined one day after infection. Error bars represent means ± SD. (b) Transcript levels of fadL and lldD were determined by quantitative real-time PCR in the wild type (N = 3) and cholera toxin mutant (Δctx) (N = 4) during colonization of the ileum relative to LB (white bars) and in the wild type relative to the cholera toxin mutant (Δctx) in LB (grey bars) (N = 3). An unpaired two-sided Student’s t-test was used to compare the log2 fold-change in expression of fadL and lldD (ileum relative to LB) between wt and Δctx mutant. Error bars represent means ± SD. (c) Differential expression of V. cholerae Superoxide Dismutase (VC2694), and Nitric Oxide Dioxygenase (VCA0183) in the wild type relative to the cholera toxin mutant (Δctx) during colonization of the ileum or cecum. (d) Iron concentrations from the ileum of individual rabbits infected with the wild type V. cholerae for experiments shown in Figure 2b. (e) Fold-change of transcript levels of wild type V. cholerae genes: ctxA (VC1456), hutA (VCA0576), viuA (VC2211), viuB (VC2210), tcpA (VC0825), fadL (VC1043), and lldD (VCA0983) in the ileum relative to LB were determined by quantitative real-time PCR from individual rabbits in Extended Data Fig. 4b, 5b, and 7b. Dark red (rabbit 2) circle indicates data for sample collected with low expression of cholera toxin (ctxA) that was determined to be a statistical outlier using the ROUT method (Q = 0.5) from log transformed fold-change expression values.
Figure 1.
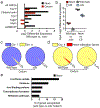
Figure 1.. CT induces a unique Vibrio cholerae transcriptome signature during infection.
(a-d) Groups of 3-day old New Zealand white rabbits (N = 4) were mock-infected or infected intragastrically with 1 × 10⁹ CFU per animal with V. cholerae C6706 wild type (wt) or the cholera toxin mutant (Δctx) and samples were collected one day after infection. (a) The fluid accumulation (FA) ratio in the cecum is expressed as percent of the response observed in animals infected by the wild type strain. The FA ratio of the wild type was compared to the Δctx mutant or mock using one-way ANOVA (F (2, 9) = 52.534, p < 0.0001) and post-hoc Sidak's multiple comparisons test. Bars represent percent fluid accumulation relative to wild type ± SE. The CFU/g was determined in the ileum tissue (b), and cecal fluid (c). The total CFU of V. cholerae wild type (black circles) or Δctx mutant (red circles) in the cecal fluid was determined by normalizing the CFU/g by the final weight of the fluid collected from the cecum (d). Error bars represent geometric means ± SD. Bacterial numbers were compared by unpaired two-sided student t-test. (e-h) RNA-seq analysis of Vibrio cholerae during colonization of the ileum and cecum of infant rabbits (e) PCA plots for RNA-seq data from two biological replicates of V. cholerae wild type (black circles) or Δctx mutant (red circles) collected from the ileum or cecum of infant rabbits (N = 2). (f) Venn diagram of genes significantly upregulated in the wild type relative to the Δctx mutant in the ileum (purple) and cecum (yellow). (g) Percent abundance of raw RNA-seq reads aligned to chromosome I (Chr. I; purple) or chromosome II (Chr. II; yellow) from wild type or the Δctx mutant in the ileum. (h) Percent abundance of heme utilization genes (VCA0907-VCA0915, VCA0576; red) from raw RNA-seq reads aligned to chromosome II (Chr. II; yellow) from wild type or the Δctx mutant in the ileum. ns, not statistically significantly different.
Figure 2.
Figure 2.. Heme utilization confers a CT-dependent fitness advantage to Vibrio cholerae.
(a) RNA-seq analysis of Vibrio cholerae heme utilization genes (VCA0907-VCA0915, VCA0576) and vibriobactin genes (VC0200-VC0201, VC2209-VC2211, VC0771-VC0780, VC0475, VCA0227-VCA0230) in the wild type relative to the cholera toxin mutant (Δctx) in the ileum or cecum. (b) Luminal iron concentrations from the ileum of infant rabbits (N = 4) that were mock-infected or infected with the wild type (wt) or the Δctx mutant. The iron concentrations between type (wt) and the Δctx mutant were compared by unpaired two-sided student t-test. Red dot represents sample from animal containing statistical outlier for V. cholerae cholera toxin (ctxA) expression. Error bars represent means ± SD. (c) Luminal hemin measurements from the ileum and cecum of infant rabbits (N = 4) that were mock-infected or infected with the wild type (wt) or the Δctx mutant. The wt heme levels in the ileum or cecum were compared to the Δctx mutant or mock using one-way ANOVA (Ileum: F (2, 9) = 55.88, p < 0.0001; Cecum: F (2, 9) = 16.61, p = 0.0010) followed by post-hoc Sidak's multiple comparisons test. The heme levels in the ileum and cecum between groups were compared using two-way ANOVA followed by post-hoc Sidak's multiple comparisons test (see Supplementary Table 7). Black lines show median for individual animals (black circles). (d) Groups of CD-1 mice were infected with a 1:1 mixture of the indicated V. cholerae strain mixtures (N = 8 for wild type vs hutA viuA; N = 4 for Δctx vs Δctx hutA viuA; N = 5 for Δctx vs Δctx hutA viuA + CT). Some mice received an oral dose of purified CT mixed into the inoculum. The competitive index (CI; the ratio of strains recovered) was determined one day after infection. Dotted lines connect strains recovered from the same animal. The CI was compared using one-way ANOVA (F (2, 14) = 7.634, p = 0.0057) followed by post-hoc Sidak's multiple comparisons test. Different colored lines distinguish animals from different litters. ns, not statistically significantly different.
Figure 3.
Figure 3.. Cholera toxin promotes Vibrio cholerae LCFA utilization during infection.
(a) DAVID bioinformatics pathway analysis of RNA-seq data of significantly upregulated pathways in the ileum relative to the cecum. (b) Differential expression of V. cholerae genes involved in TCA cycle (VC0432, VC1573, VC2084-VC2092, VC2738), LCFA utilization (VC1043, VC2758, VC2231), and L-Lactate utilization (VCA0983, VCA0984), and all open reading frames (ORFs) of wild type C6706 during colonization of the ileum relative to the cecum. (c) Differential expression of V. cholerae genes involved in TCA cycle, LCFA utilization, and L-Lactate utilization, and all ORFs in the wild type relative to the cholera toxin mutant (Δctx) during colonization of the ileum or cecum. (d) Luminal LCFA measurements (8 carbon chain or greater) from the ileum and cecum of infant rabbits (N = 4) that were mock-infected or infected with the wild type (wt) or the cholera toxin mutant (Δctx). Black lines show median for individual animals (black circles). The wt LCFA levels in the ileum or cecum were compared to the Δctx mutant or mock using one-way ANOVA (Ileum: F (2, 9) = 12.69, p = 0.0024; Cecum: F (2, 9) = 2.951, p = 0.1034) followed by post-hoc Sidak's multiple comparisons test. (e) Luminal L-lactate measurements from the ileum and cecum of infant rabbits (N = 4) that were mock-infected or infected with the wild type (wt) or the cholera toxin mutant (Δctx). Black lines show median for individual animals (black circles). The wt L-Lactate levels in the ileum or cecum were compared to the Δctx mutant or mock using one-way ANOVA (Ileum: F (2, 9) = 50.98, p < 0.0001; Cecum: F (2, 9) = 1.916, p = 0.2027) followed by post-hoc Sidak's multiple comparisons test. The L-Lactate levels in the ileum and cecum between groups were compared using two-way ANOVA (see Supplementary Table 7) followed by post-hoc Sidak's multiple comparisons test. (f) Groups of CD-1 mice were infected with a 1:1 mixture of the indicated V. cholerae strain mixtures (N = 8 for wild type vs fadL; N = 4 for Δctx vs Δctx fadL; N = 5 for Δctx vs Δctx fadL + CT). Some mice received an oral dose of purified CT mixed into the inoculum. The competitive index (CI; the ratio of strains recovered) was determined one day after infection. Dotted lines connect strains recovered from the same animal. The competitive indices between groups were compared using one-way ANOVA (F (2, 14) = 57.98, p < 0.0001) followed by post-hoc Sidak's multiple comparisons test. Different colored lines distinguish animals from different litters. ns, not statistically significantly different.

References

    1. Faruque SM, Albert MJ & Mekalanos JJ Epidemiology, genetics, and ecology of toxigenic Vibrio cholerae. Microbiol Mol Biol Rev 62, 1301–1314 (1998). - PMC - PubMed
    1. Cassat JE & Skaar EP Iron in infection and immunity. Cell Host Microbe 13, 509–519, doi:10.1016/j.chom.2013.04.010 (2013). - DOI - PMC - PubMed
    1. Henderson DP & Payne SM Cloning and characterization of the Vibrio cholerae genes encoding the utilization of iron from haemin and haemoglobin. Mol Microbiol 7, 461–469 (1993). - PubMed
    1. De SN Enterotoxicity of bacteria-free culture-filtrate of Vibrio cholerae. Nature 183, 1533–1534 (1959). - PubMed
    1. Cassel D & Pfeuffer T Mechanism of cholera toxin action: covalent modification of the guanyl nucleotide-binding protein of the adenylate cyclase system. Proc Natl Acad Sci U S A 75, 2669–2673 (1978). - PMC - PubMed

REFERENCES (Online-only)

    1. Fullner KJ & Mekalanos JJ Genetic characterization of a new type IV-A pilus gene cluster found in both classical and El Tor biotypes of Vibrio cholerae. Infect Immun 67, 1393–1404 (1999). - PMC - PubMed
    1. Angelichio MJ, Spector J, Waldor MK & Camilli A Vibrio cholerae intestinal population dynamics in the suckling mouse model of infection. Infect Immun 67, 3733–3739 (1999). - PMC - PubMed
    1. Baselski V, Briggs R & Parker C Intestinal fluid accumulation induced by oral challenge with Vibrio cholerae or cholera toxin in infant mice. Infect Immun 15, 704–712 (1977). - PMC - PubMed
    1. Langmead B & Salzberg SL Fast gapped-read alignment with Bowtie 2. Nat Methods 9, 357–359, doi:10.1038/nmeth.1923 (2012). - DOI - PMC - PubMed
    1. Kearse M et al. Geneious Basic: an integrated and extendable desktop software platform for the organization and analysis of sequence data. Bioinformatics 28, 1647–1649, doi:10.1093/bioinformatics/bts199 (2012). - DOI - PMC - PubMed

Publication types