. 2019 Aug;572(7770):538-542.
doi: 10.1038/s41586-019-1450-6. Epub 2019 Jul 31.

Loss of p53 triggers WNT-dependent systemic inflammation to drive breast cancer metastasis

Affiliations

Loss of p53 triggers WNT-dependent systemic inflammation to drive breast cancer metastasis

Max D Wellenstein et al. Nature. 2019 Aug.

Abstract

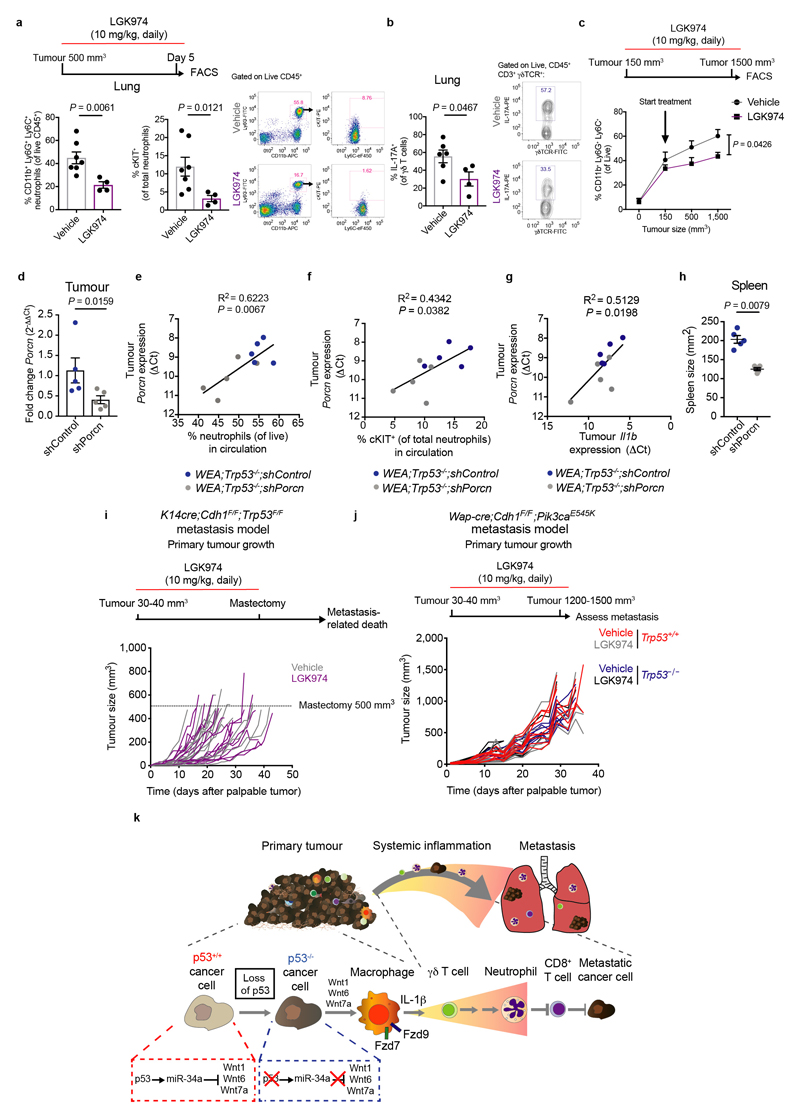
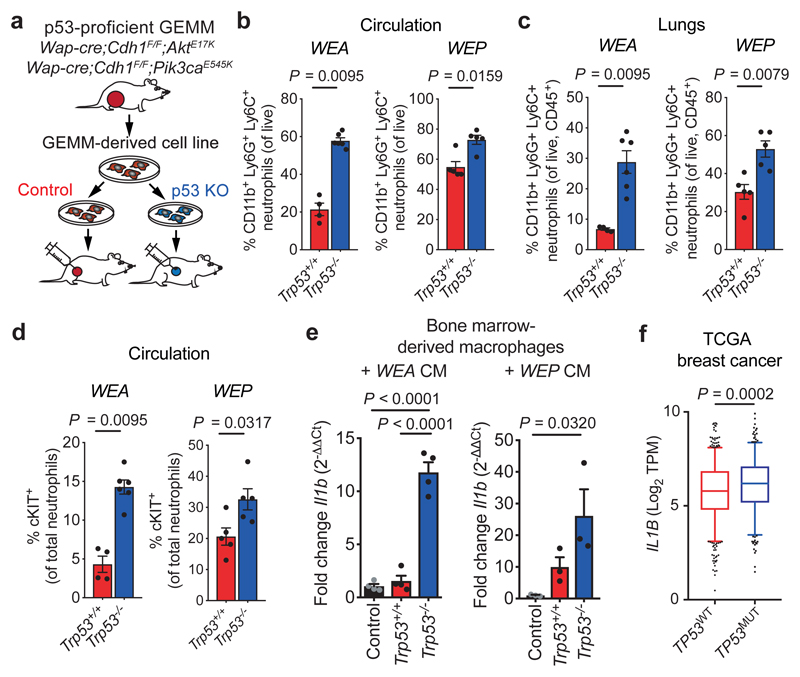
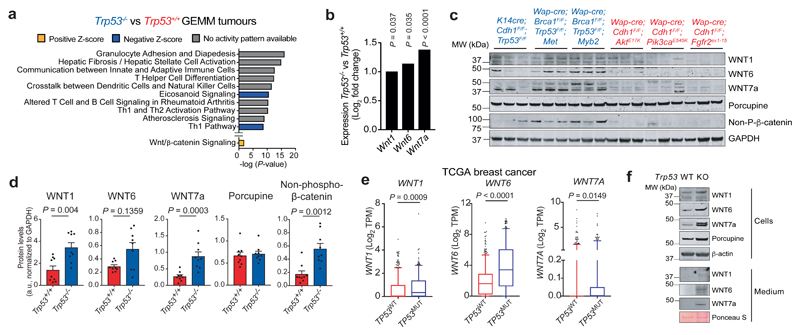
Cancer-associated systemic inflammation is strongly linked to poor disease outcome in patients with cancer1,2. For most human epithelial tumour types, high systemic neutrophil-to-lymphocyte ratios are associated with poor overall survival3, and experimental studies have demonstrated a causal relationship between neutrophils and metastasis4,5. However, the cancer-cell-intrinsic mechanisms that dictate the substantial heterogeneity in systemic neutrophilic inflammation between tumour-bearing hosts are largely unresolved. Here, using a panel of 16 distinct genetically engineered mouse models for breast cancer, we uncover a role for cancer-cell-intrinsic p53 as a key regulator of pro-metastatic neutrophils. Mechanistically, loss of p53 in cancer cells induced the secretion of WNT ligands that stimulate tumour-associated macrophages to produce IL-1β, thus driving systemic inflammation. Pharmacological and genetic blockade of WNT secretion in p53-null cancer cells reverses macrophage production of IL-1β and subsequent neutrophilic inflammation, resulting in reduced metastasis formation. Collectively, we demonstrate a mechanistic link between the loss of p53 in cancer cells, secretion of WNT ligands and systemic neutrophilia that potentiates metastatic progression. These insights illustrate the importance of the genetic makeup of breast tumours in dictating pro-metastatic systemic inflammation, and set the stage for personalized immune intervention strategies for patients with cancer.


Conflict of interest statement

Competing interests

M.D.W., S.B.C., D.E.M.D., M.H.v.M., M.S., I.d.R., L.H., S.M.K., S.P., C-S.H. K.V., A.P.D., R.d.K-G., E.S. I.v.d.H., W.Z. and J.J. report no competing interests. L.F.A.W. reports research funding from Genmab. T.N.S. is a consultant for Adaptive Biotechnologies, AIMM Therapeutics, Allogene Therapeutics, Amgen, Merus, Neon Therapeutics, Scenic Biotech, Third Rock Ventures, reports research support from Merck, Bristol-Myers Squibb, Merck KGaA, and is stockholder in AIMM Therapeutics, Allogene Therapeutics, Merus, Neogene Therapeutics, Neon Therapeutics, Scenic Biotech, all outside the scope of this work. K.E.d.V. reports research funding from Roche and is consultant for Third Rock Ventures, outside the scope of this work.

Figures

Extended Data Figure 1
Extended Data Figure 1. Neutrophil expansion in p53-deficient tumour-bearing GEMMs.
a. Representative plots of flow cytometry analysis on blood of end-stage (cumulative tumour size 1500 mm3) mammary tumour-bearing mice. Neutrophils were defined as CD11b+Ly6G+Ly6C+. cKIT expression on gated total neutrophils in blood is shown (gating was based on blood of WT mice). Quantification and statistical analysis of these data is found in Fig. 1a, b
Extended Data Figure 2
Extended Data Figure 2. CRISPR/Cas9-mediated gene disruption of Trp53 in Wap-cre;Cdh1F/F;AktE17K and Wap-cre;Cdh1F/F;Pik3caE545K cancer cell lines.
a. Insertion and deletion (indel) spectrum of bulk Wap-cre;Cdh1F/F;AktE17K (WEA) cancer cell lines after transfection with 2 individual sgRNAs against Trp53 and puromycin selection, as determined by the TIDE algorithm and compared to the sequence of target region of control cells. The P-value associated with the estimated abundance of each indel is calculated by a two-tailed t-test of the variance–covariance matrix of the standard errors. b. Western blot analysis showing p53 levels of control and p53-knockout (KO) WEA cell lines. Inactivation of the p53 pathway is shown by loss of p21 staining after 10 Gy irradiation. KO1 (sgRNA1) resulted in a truncated p53 protein and KO2 (sgRNA2) shows absence of p53 protein. For all subsequent experiments, KO2 was used. Representative of two independent experiments. For uncropped images, see Supplemental Fig. 1. c. In vitro growth kinetics of WEA control and p53-KO cells, as determined by IncuCyte (n=7 technical replicates/group). d. In vivo growth kinetics of orthotopically transplanted WEA;Trp53+/+ (n=4 mice) and WEA;Trp53–/– (n=6) cancer cell lines, with t = 0 being the first day tumours were palpable. e. Indel spectrum of bulk Wap-cre;Cdh1F/F;Pik3caE545K (WEP) cancer cell lines after transfection with sgRNA2 against Trp53 and puromycin selection, as determined by the TIDE algorithm. f. In vitro growth kinetics of WEP control and p53-KO cells, as determined by IncuCyte (n=7 technical replicates/group). g. In vivo growth kinetics of orthotopically transplanted WEP;Trp53+/+ (n=5) and WEP;Trp53–/– (n=5) cell lines, with t=0 being the first day tumours were palpable. h. Gating strategy to identify circulating neutrophils and their cKIT expression. i. Gating strategy to identify neutrophils in the lung. j. Representative images of spleens from mice bearing WEA;Trp53+/+ and WEA;Trp53–/– tumours and quantification of spleen area (length × width) at end-stage (tumour volume 1500 mm3) of mice bearing p53-proficient (n=4) and p53-deficient WEA (n=6) and WEP tumours (n=5/group). All data are means ± s.e.m. P-values are indicated as determined by Area Under the Curve followed by two-tailed Welch’s t-test (c, d, f , g) or two-tailed Mann-Whitney U-test (j), ns: not significant.
Extended Data Figure 3
Extended Data Figure 3. Haematopoiesis in p53-null tumour-bearing mice is skewed towards the development of neutrophils.
a. Schematic representation of neutrophil development in the bone marrow. b. Gating strategy of neutrophil progenitor populations in the bone marrow. Dot plot indicates the cKIT expression levels (median fluorescence intensity [MFI]) in promyelocytes compared to mature neutrophils (n=20 mice). c. Frequency of bone marrow progenitor populations in mice bearing end-stage Wap-cre;Cdh1F/F;AktE17K;Trp53+/+ (n=9) and Wap-cre;Cdh1F/F;AktE17K;Trp53–/– (n=11) tumours, as determined by flow cytometry. d. Total live cells and total live progenitor population numbers per hindleg of mice bearing WEA;Trp53+/+ and WEA;Trp53–/– tumours (n=5/group). All data are ± s.e.m. P-values are indicated as determined by two-tailed Mann-Whitney U-test. Abbreviations: LSK (LinSca1+cKIT+, which contain the LT-HSC (long-term haematopoietic stem cells), ST-HSC (short-term haematopoietic stem cells) and MPP (multipotent progenitors)), CMP (common myeloid progenitors), GMP (granulocytic and monocytic progenitors), MEP (megakaryocyte and erythrocyte progenitors).
Extended Data Figure 4
Extended Data Figure 4. Macrophages are differentially activated by Trp53–/– mouse and human breast cancer cell lines.
a. Expression (median fluorescence intensity [MFI]) of CCR2, CCR6, CD206, CSF-1R, CXCR4 and MHC-II on live CD11b+F4/80+ bone marrow-derived macrophages after exposure to control medium or conditioned medium (CM) of Wap-cre;Cdh1F/F;AktE17K;Trp53+/+ or Wap-cre;Cdh1F/F;AktE17K;Trp53–/– cell lines, as determined by flow cytometry (n=4 biological replicates/group). b. TIDE analysis of bulk MCF-7 cells after transfection with TP53-targeting sgRNAs and puromycin selection. For subsequent experiments, sgRNA1 was used. c. Expression (MFI) of CD206, CD163 and HLA-DR on human CD11b+CD14+CD68+ monocyte-derived macrophages (MDMs) after exposure to CM of MCF-7;TP53+/+ or MCF-7;TP53–/– (sgRNA1) cancer cells (n=3 biological replicates/group). d. RT-qPCR analysis showing IL1B expression in human CD11b+CD14+CD68+ MDMs after exposure to control medium (n=4 biological replicates) CM of MCF-7-TP53+/+ or MCF-7-TP53–/–cancer cells (n=5 biological replicates/group). Data are normalized to normal medium control. Plots shows representative data of 3 separate experiments and average with 2 technical replicates. All data are means ± s.e.m. P-values are indicated as determined by two-tailed one-way ANOVA, Tukey’s multiple-testing correction.
Extended Data Figure 5
Extended Data Figure 5. Transcriptome profile and composition of the local tumour immune landscape in breast cancer GEMMs.
a. Unsupervised clustering of top 200 most differentially expressed genes (P < 0.01, LFC > 3 or < –3) in mammary GEMM tumours as determined by RNA sequencing (n=145 tumours). Red bars indicate Trp53+/+ tumours, blue bars indicate Trp53–/– tumours. Full tumour genotype is displayed in legend and shown by indicated colours. b. Number of Ly6G+ neutrophils in the tumour (n=1, 4, 10, 2, 4, 3, 6, 13, 4, 22, 4 and 5 mice, top to bottom). c. Macrophage score as indicative of F4/80+ macrophage abundance in the tumour (n=2, 2, 4, 4, 4, 2, 3, 5, 4, 9, 5 and 4 mice, top to bottom). d. Number of CD8+ cytotoxic T cells in the tumour (n=3, 2, 5, 5, 7, 3, 7, 3, 5, 4, 4 and 5 mice, top to bottom). e. Number of CD4+ T cells in the tumour (n=3, 2, 5, 5, 7, 3, 7, 3, 5, 4, 4 and 5 mice, top to bottom). f. Number of Foxp3+ regulatory T cells in the tumour (n=3, 2, 5, 5, 7, 3, 7, 3, 5, 4, 4 and 5 mice, top to bottom). g. Ratio of CD8/Foxp3 cells in the tumour (n=3, 2, 5, 5, 7, 3, 7, 2, 5, 4, 4 and 5 mice, top to bottom). All data are means of 5 microscopic fields of view (FOV) per mouse as determined by IHC. Inserts show data combined according to p53 status of the tumour. Each symbol represents an individual mouse. All data are means ± s.e.m. P-values are indicated as determined by two-tailed one-way ANOVA, FDR multiple-testing correction (a) or two-tailed Mann-Whitney U-test (b – g).
Extended Data Figure 6
Extended Data Figure 6. WNT-related gene activation correlates with loss of p53 in mouse and human breast tumours.
a. Heatmap showing that Trp53–/– (KO) GEMM tumours (n=77) cluster away from Trp53+/+ (WT) tumours (n=68) based on analysis of the Hallmark p53 pathway (represents positive control) and b. analysis of the Hallmark Wnt/β-catenin pathway. Analysis was performed on all tumours of Extended Data Fig. 5a. c. Log2 fold change expression of genes involved in Wnt signalling (P < 0.05) in Trp53–/– (n=77) and Trp53+/+ (n=68) GEMM tumours depicted in Extended Data Fig. 5a. Black bars indicate genes that positively regulate, or are generally increased with active Wnt signalling. Red bars indicate genes that negatively regulate, or are down-regulated with active Wnt signalling. d. Gene set enrichment analysis (GSEA) for Hallmark pathways in TCGA TP53WT breast tumours (n=643) vs TP53MUT (n=351) human tumours (any TP53 mutation) or TP53 loss (based on the IARC TP53 database, see Materials and Methods). Normalized enrichment score is shown with False Discovery Rate (FDR) indicated. e. Correlation coefficient (R) of all genes involved in WNT signalling that correlate significantly (P < 0.05) with TP53MUT (n=351) vs TP53WT (n=643) in TCGA breast tumours. Black bars indicate genes that positively regulate, or are generally increased with active WNT signalling. Red bars indicate genes that negatively regulate, or are down-regulated with active WNT signalling. P-values were determined by two-tailed ANOVA with FDR multiple-testing correction (c, e).
Extended Data Figure 7
Extended Data Figure 7. p53 does not bind the regulatory regions of Wnt ligands directly.
a. Chromatin immunoprecipitation-sequencing (ChIP-seq) profile of p53 binding to DNA demonstrating enrichment on the Cdkn1a (p21) locus in Trp53+/+ Wap-cre;Cdh1F/F;AktE17K (WEA) and Wap-cre;Cdh1F/F;Pik3caE545K (WEP) cell lines (3 cell lines from 3 independent tumours per GEMM). b. Absence of p53 binding to Wnt1, Wnt6 or Wnt7a loci. c. Enrichment of p53 on microRNA-34a (miR-34a) locus. d. RT-qPCR analysis of Wnt ligand expression in WEA;Trp53+/+ and WEA;Trp53–/– cell lines after overexpression (OE) of miR-34a in WEA;Trp53–/–cells (n=3 technical replicates/group). Plots show representative data of 3 separate experiments with 3 technical replicates. All data are means ± s.e.m. P-values are indicated as determined by two-tailed one-way ANOVA, Tukey multiple-testing correction (d).
Extended Data Figure 8
Extended Data Figure 8. Macrophages are activated by Trp53–/– cancer cells via Fzd7 and Fzd9 receptors in vitro.
a. Log2 fold change in expression of Wnt receptors Fzd7 and Fzd9 in bulk tumours comparing Trp53–/– (n=77) and Trp53+/+ (n=68) GEMM tumours using RNA-sequencing. b. Expression of FZD7 and FZD9 in TP53 wild-type (WT, n=643) and TP53 mutant (MUT, n=351) human breast tumours of TCGA dataset. c. Silencing of Fzd7 and Fzd9 in bone marrow-derived macrophages (BMDMs) after transfection with siRNA pools against both receptors, as determined by RT-qPCR (n=6 biological replicates/group). d. Expression of Il1b in BMDMs after exposure to conditioned medium of Trp53+/+ and Trp53–/– Wap-cre;Cdh1F/F;AktE17K cell lines (n=6 biological replicates/group), as determined by RT-qPCR. Where indicated, BMDMs were transfected with control siRNA or Fzd7/9 siRNA pools. a, c, d show means ± s.e.m. b. shows 5 – 95 percentile boxplot with median and quartiles indicated. P-values are indicated as determined by two-tailed one-way ANOVA, FDR multiple-testing correction (a), two-tailed Mann-Whitney U-test (b) or two-tailed one-way ANOVA, Tukey multiple-testing correction (d).
Extended Data Figure 9
Extended Data Figure 9. Pharmacological and genetic targeting of Porcupine in p53-deficient tumours reduces systemic inflammation.
a. Total and cKIT+ neutrophil frequencies in lungs of vehicle (n=7) or LGK974 (n=4)-treated K14cre;Cdh1F/F;Trp53F/F (KEP) mice using indicated 5 day short-term treatment schedule. Representative flow cytometry plots are shown. b. Frequency of IL-17A-producing γδ T cells in lungs of vehicle (n=6) or LGK974 (n=4)-treated KEP mice. Representative flow cytometry plots are shown. c. Kinetics of circulating neutrophils in vehicle or LGK974-treated KEP mice using indicated long-term treatment schedule, shown as frequency at indicated tumour volumes (n=8/group). d. RT-qPCR analysis of Porcn expression in end-stage bulk tumour (n=5/group). Data are normalized to shControl and represents an average of 2 technical replicates. e. Correlation of total neutrophil levels in circulation with expression of Porcn in WEA;Trp53–/–;shControl and WEA;Trp53–/–;shPorcn whole tumour lysate (n=5/group). f. Correlation of cKIT+ neutrophil levels in circulation with expression of Porcn in WEA;Trp53–/–;shControl and WEA;Trp53–/–;shPorcn whole tumour lysate (n=5/group). g. Correlation of Porcn expression and Il1b expression in bulk WEA;Trp53–/–;shControl (blue) and WEA;Trp53–/–;shPorcn tumours (grey) (n=5/group). Data represent an average of 2 technical replicates. h. Spleen area in mice with WEA;Trp53–/–;shControl (blue) and WEA;Trp53–/–;shPorcn tumours (grey) tumours at end-stage (n=5/group). i. Growth kinetics of orthotopically transplanted KEP mammary tumours, treated with vehicle (n=12) or LGK974 (n=15). Each line represents an individual mouse. j. Growth kinetics of orthotopically injected Trp53+/+ and Trp53–/– Wap-cre;Cdh1F/F;Pik3caE545K (WEP) cells, treated with vehicle or LGK974. Each line represents an individual mouse (n=9/group). k. Schematic representation of the findings of this study: loss of p53 in breast cancer cells triggers secretion of Wnt ligands to activate tumour-associated macrophages. This stimulates systemic expansion and activation of neutrophils, which we have previously shown to be immunosuppressive, thus driving metastasis. All data are means ± s.e.m. P-values are indicated as determined by two-tailed Mann-Whitney U-test (a – d, h), linear regression analysis (e – g) and area under the curve of average growth curves, followed by two-tailed Welch’s t-test (i, j).
Figure 1
Figure 1. Loss of p53 in mammary cancer cells correlates with systemic neutrophilic inflammation.
a. Flow cytometry analysis of frequency of CD11b+Ly6G+Ly6C+ neutrophils and b. proportion of cKIT+ neutrophils as determined by flow cytometry analysis on blood of breast cancer GEMMs at end-stage (cumulative tumour volume 1500 mm3) and non-tumour-bearing (WT) controls (n=4, 3, 4, 7, 3, 4, 4, 3, 6, 7, 6, 9, 3, 5, 4, 7 and 7 mice, top to bottom). Asterisks indicate statistically significant differences compared to WT. * P < 0.05, ** P < 0.01, *** P < 0.001, **** P < 0.0001. c. Total neutrophil frequencies and d. cKIT+ neutrophil frequencies in circulation of all Trp53+/+ (n=28) and Trp53–/– (n=46) tumour-bearing mice, combined from a. and b. e. CCL2 levels (n=17 Trp53+/+, n=22 Trp53–/–), f. IL-1β levels (n=18 Trp53+/+, n=21 Trp53–/–), g. IL-17A levels (n=24 Trp53+/+, n=30 Trp53–/–) and h. G-CSF levels (n=22 Trp53+/+, n=33 Trp53–/–) in serum of GEMMs at end-stage based on p53 status. i. Principal component analysis of data depicted in ah (13 out of 16 GEMMs). Each symbol represents one mouse. Circles contour 40% of group-specific Gaussian probability distributions of sample scores. All data are means ± s.e.m., P-values are indicated as determined by two-tailed one-way ANOVA, Tukey’s multiple-testing correction (a, b) or two-tailed Mann-Whitney U-test (c – h).
Figure 2
Figure 2. p53 status in mammary tumours dictates immune activation.
a. Experimental setup: cell lines are derived from Trp53+/+ tumours (Wap-cre;Cdh1F/F;AktE17K (WEA) and Wap-cre;Cdh1F/F;Pik3caE545K (WEP)) and p53 is knocked out (KO) using CRISPR/Cas9. KO and control cell lines are orthotopically transplanted into syngeneic mice. b. Frequency of total CD11b+Ly6G+Ly6C+ neutrophils in circulation and c. in lungs, and d. frequency of cKIT+ neutrophils (% of total neutrophils) in circulation at end-stage (tumour volume 1500 mm3) of mice with Trp53+/+ and Trp53–/– WEA and WEP tumours, as determined by flow cytometry (n=4 WEA;Trp53+/+, n=6 WEA;Trp53–/–, n=5 WEP;Trp53+/+, n=5 WEP;Trp53–/–). e. RT-qPCR analysis of the expression of Il1b in bone marrow-derived macrophages (BMDM) after exposure to conditioned medium from Trp53+/+ and Trp53–/– WEA (n=4 biological replicates/group) or WEP cell lines (n=3 biological replicates/group). Plots show representative of 3 independent experiments with 2 technical replicates per biological replicate. f. IL1B expression in TP53 wild-type (WT, n=643) or TP53 mutant (MUT, n=351) human breast tumours of The Cancer Genome Atlas (TCGA) database. Data in be are means ± s.e.m., f. shows 5 – 95 percentile boxplot with median and quartiles indicated. P-values are indicated as determined by two-tailed Mann-Whitney U-test (b, c, d, f) or two-tailed one-way ANOVA, Tukey’s multiple-testing correction (e).
Figure 3
Figure 3. p53-null tumours display activated Wnt signalling.
a. Top 10 most significantly differentially activated pathways determined by Ingenuity Pathway Analysis, comparing Trp53–/– (n=77) with Trp53+/+ (n=68) GEMM tumours of 12 different models. Also indicated is the Wnt signalling pathway. b. Log2 fold change expression of Wnt1, Wnt6 and Wnt7a in Trp53–/– (n=77) GEMM tumours compared to Trp53+/+ (n=68) tumours. c. Western blot analysis of bulk tumours showing non-phospho(active)-β-catenin, Porcupine, WNT1, WNT6 and WNT7a (blue indicates Trp53–/– tumours and red indicates Trp53+/+ tumours). Representative of two independent experiments. For uncropped images, see Supplemental Fig. 1. d. Quantification of c (n=3/group). e. Expression of WNT1, WNT6 and WNT7A in TP53 wild-type (WT, n=643) and TP53 mutant (MUT, n=351) human breast tumours of TCGA breast cancer database. f. Western blot analysis on cell lysate and conditioned medium of Wap-cre;Cdh1F/F;AktE17K;Trp53+/+ (WT) and Wap-cre;Cdh1F/F;AktE17K;Trp53–/– (KO) cell lines for Wnt ligands. Representative of two independent experiments. d. shows mean ± s.e.m., e shows 5 – 95 percentile boxplot with median and quartiles indicated. P-values are indicated as determined by two-tailed one-way ANOVA, FDR multiple-testing correction (b) or two-tailed Mann-Whitney U-test (d, e).
Figure 4
Figure 4. Wnt-induced systemic inflammation promotes metastasis of p53-null tumours.
a. RT-qPCR analysis of bone marrow-derived macrophages (BMDM) after exposure to control medium or conditioned medium from Wap-cre;Cdh1F/F;AktE17K;Trp53+/+ (WT), Wap-cre;Cdh1F/F;AktE17K;Trp53–/– (KO) or Wap-cre;Cdh1F/F;AktE17K;Trp53–/– cells transduced with 2 independent shRNAs against Porcn (KO shPorcn-1 and KO shPorcn-4). Where indicated, cell lines were pre-treated with 1 µM LGK974 (KO + LGK974) (n=5 biological replicates/group for WT, WT + LGK974, KO and KO + LGK974, n=3 biological replicates for KO shPorcn-1 and KO shPorcn-4). Plots show representative data of 3 separate experiments with 2 technical replicates per biological replicate. b. Frequency of total CD11b+Ly6G+Ly6C+ neutrophils and cKIT+ neutrophils in circulation of K14cre;Cdh1F/F;Trp53F/F (KEP) mice after 5 day LGK974 (n=4) or vehicle (n=7) treatment starting at tumour volume 500 mm3. c. Number of pulmonary metastases after KEP tumour-bearing mice were treated with LGK974 (n=15) or vehicle (n=12). KEP tumour fragments were orthotopically transplanted in FVB/N mice and treatment was initiated when tumours were 30 – 40 mm3 and continued until primary tumour removal. d. Representative images of cytokeratin-8 staining of lungs of KEP tumour-bearing mice. Scale bars, 1.9 mm. e. Number of pulmonary metastases after orthotopic injection of Trp53+/+ and Trp53–/– Wap-cre;Cdh1F/F;Pik3caE545K (WEP) cells and treatment with LGK974 or vehicle (n=9/group). Treatment was initiated when tumours were 30 – 40 mm3 and continued until 1500 mm3. f. Representative images of cytokeratin-8 staining of lungs of WEP tumour-bearing mice, arrows indicate examples of metastatic nodules. Scale bars, 1.4 mm. All data are means ± s.e.m. P-values are indicated as determined by two-tailed one-way ANOVA, Tukey’s multiple-testing correction (a) or two-tailed Mann-Whitney U-test (b, c, e), ns: non-significant.

Similar articles

Cited by

References

    1. Diakos CI, Charles KA, McMillan DC, Clarke SJ. Cancer-related inflammation and treatment effectiveness. Lancet Oncol. 2014;15:e493–503. - PubMed
    1. McAllister SS, Weinberg RA. The tumour-induced systemic environment as a critical regulator of cancer progression and metastasis. Nat Cell Biol. 2014;16:717–27. - PMC - PubMed
    1. Templeton AJ, et al. Prognostic role of neutrophil-to-lymphocyte ratio in solid tumors: a systematic review and meta-analysis. J Natl Cancer Inst. 2014;106 dju124. - PubMed
    1. Coffelt SB, Wellenstein MD, de Visser KE. Neutrophils in cancer: neutral no more. Nat Rev Cancer. 2016;16:431–46. - PubMed
    1. Coffelt SB, et al. IL-17-producing gammadelta T cells and neutrophils conspire to promote breast cancer metastasis. Nature. 2015;522:345–48. - PMC - PubMed

Publication types