. 2019 Aug;572(7769):397-401.
doi: 10.1038/s41586-019-1437-3. Epub 2019 Jul 31.

Dietary methionine influences therapy in mouse cancer models and alters human metabolism

Affiliations

Dietary methionine influences therapy in mouse cancer models and alters human metabolism

Xia Gao et al. Nature. 2019 Aug.

Abstract

Nutrition exerts considerable effects on health, and dietary interventions are commonly used to treat diseases of metabolic aetiology. Although cancer has a substantial metabolic component1, the principles that define whether nutrition may be used to influence outcomes of cancer are unclear2. Nevertheless, it is established that targeting metabolic pathways with pharmacological agents or radiation can sometimes lead to controlled therapeutic outcomes. By contrast, whether specific dietary interventions can influence the metabolic pathways that are targeted in standard cancer therapies is not known. Here we show that dietary restriction of the essential amino acid methionine-the reduction of which has anti-ageing and anti-obesogenic properties-influences cancer outcome, through controlled and reproducible changes to one-carbon metabolism. This pathway metabolizes methionine and is the target of a variety of cancer interventions that involve chemotherapy and radiation. Methionine restriction produced therapeutic responses in two patient-derived xenograft models of chemotherapy-resistant RAS-driven colorectal cancer, and in a mouse model of autochthonous soft-tissue sarcoma driven by a G12D mutation in KRAS and knockout of p53 (KrasG12D/+;Trp53-/-) that is resistant to radiation. Metabolomics revealed that the therapeutic mechanisms operate via tumour-cell-autonomous effects on flux through one-carbon metabolism that affects redox and nucleotide metabolism-and thus interact with the antimetabolite or radiation intervention. In a controlled and tolerated feeding study in humans, methionine restriction resulted in effects on systemic metabolism that were similar to those obtained in mice. These findings provide evidence that a targeted dietary manipulation can specifically affect tumour-cell metabolism to mediate broad aspects of cancer outcome.


Conflict of interest statement

CONFLICT OF INTEREST

J.W.L and X.G. have patents related to targeting amino acid metabolism in cancer therapy. D.G.K. is a co-founder and has equity in XRAD therapeutics, a company developing radiosensitizing agents. He also has patents related to radiosensitizing agents.

Figures

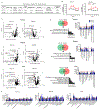
Extended Data Fig. 1.
Extended Data Fig. 1.. Dietary MR rapidly and specifically alters methionine and sulfur metabolism but maintains overall metabolism in healthy C57BL/6J mice
a, Dynamic patterns of top 3 modes. Standardized concentration (the values are normalized to have mean=0, standard deviation=1) in Mode 1, Mode 2 and Mode 3. b, Heatmap of metabolites in Mode 2 and Mode 3. c, Volcano plot of metabolites in plasma collected at the end point. FC, fold change. P values were determined by two-tailed Student’s t-test. d, Left: Pathway analysis of significantly changed (*p<0.05, two-tailed Student’s t-test) plasma metabolites by 21-day MR diet. Right: FC of altered metabolites in the top three most impacted pathways. Mean ± s.e.m., n=5 animals/group, *p<0.05, two-tailed Student’s t-test. e, Relative intensity of plasma amino acids and metabolites in one-carbon metabolism and redox balance at the end of study. Mean ± s.e.m., n=5 animals/group, *p<0.05, two-tailed Student’s t-test. f, Relative intensity of methionine metabolism related metabolite, 2-keto-4-methylthiobutyrate and hypotaurine. Mean ± s.d., n=5 animals/group, *p<0.05 by two-tailed Student’s t-test.
Extended Data Fig. 2.
Extended Data Fig. 2.. Dietary MR alters methionine metabolism in CRC PDX models
a, Information on original CRC patient tumours. b-e, data from the prevention study in Fig. 1f. N=8 animals/group, 4 females + 4 males. b, Food intake. Mean ± s.e.m., *p<0.05 by two-tailed Student’s t-test. c, Volcano plots of metabolites in tumours, plasma and liver. FC, fold changes. P values were determined by two-tailed Student’s t-test. d, Left: Venn diagram of significantly changed (*p<0.05, two-tailed Student’s t-test) metabolites in tumour, plasma and liver by MR and pathway analysis (false discovery rate < 0.5) of the commonly changed metabolites; right: MR-induced FC of intensity of tumour metabolites in cysteine and methionine metabolism, and taurine and hypotaurine metabolism. Mean ± s.d., *p<0.05 by two-tailed Student’s t-test. N=8 animals/group, 4 females + 4 males. e, Relative FC of intensity of amino acids. Mean ± s.e.m., *p<0.05, two-tailed Student’s t-test. N=8 animals/group, 4 females + 4 males.
Extended Data Fig. 3.
Extended Data Fig. 3.. MR leads to specific cell intrinsic metabolic alterations in tumours
To determine whether the effect of MR on tumour growth is systemic, cell autonomous, or both, we conducted an integrated analysis of global changes in the metabolic network across tumour, plasma and liver within each model from the prevention study in Fig. 1f. N=8 animals/group, 4 females + 4 males. a, Spearman’s rank correlation coefficients of MR-induced FC of metabolites in tumour, plasma and liver exhibited strong correlations between each tissue pair with the highest correlation between tumour and plasma in both CRC119 and CRC240. FC, fold changes. b, Multidimensional scaling analysis of metabolite FC in response to MR. In both models, the FC of metabolites in tumor showed a higher similarity with those in plasma than with those in liver. c-d, Liver was the most affected tissue in both models. (c) Effect of MR on metabolism in tumour, plasma and liver evaluated by the log10 (FC). Box limits are the 25th and 75th percentiles, center lines are medians, and the whiskers are the minimal and maximal values. (d) Numbers of metabolites significantly altered (*p<0.05, two-tailed Student’s t-test) by MR. N=8 animals/group, 4 females + 4 males. e, Schematic defining methionine related (metabolized from or to methionine within 4 reaction steps) metabolites and otherwise methionine unrelated metabolites. f-g, A higher proportion of altered metabolites was methionine-related in plasma and tumour compared to liver where MR-altered metabolites were nearly equally distributed between methionine-related and -unrelated groups. f, Fraction of significantly (*p<0.05, two-tailed Student’s t-test) altered metabolites for methionine-related and methionine-unrelated metabolites in tumour, liver and plasma. g, Numbers of total and significantly altered metabolites for methionine-related and methionine-unrelated metabolites in tumour, liver and plasma and p value by one-sided Fisher’s exact test.
Extended Data Fig. 4.
Extended Data Fig. 4.. MR inhibits cell proliferation and most significantly alters cysteine and methionine in CRC primary cells
a, Relative cell numbers in CRC119 and CRC240 primary tumour cells treated with different doses of methionine for 72 h. Mean ± s.d., n = 3 biologically independent samples, similar results were obtained from three independent experiments, *p<0.05, two-tailed Student’s t-test. b, Volcano plots of metabolites in cells cultured in 0 or 100 μM methionine for 24 h. FC, fold changes. P values were determined by two-tailed Student’s t-test. c, Left: Venn diagram of significantly changed (*p<0.05, two-tailed Student’s t-test) metabolites in CRC119 and CRC240 primary cells cultured with no methionine vs control (100 μM methionine), and pathway analysis of commonly changed metabolites. Right: FC of metabolites in the cysteine and methionine metabolism and pyrimidine metabolism in CRC119 and CRC240 primary cells treated with 0 or 100 μM methionine. Mean ± s.d., n = 3 biologically independent samples, *p<0.05, two-tailed Student’s t-test. d, Relative FC of intensity of amino acids by methionine deprivation in CRC119 and CRC240 primary cells. Mean ± s.d., n = 3 biologically independent samples, *p<0.05, two-tailed Student’s t-test.
Extended Data Fig. 5.
Extended Data Fig. 5.. Dietary MR sensitizes CRC PDX models to chemotherapy 5-Fluorouracil (5-FU)
a, Volcano plots of metabolites in plasma and liver altered by the combination of dietary MR and 5-FU. FC, fold change. P values were determined by two-tailed Student’s t-test. b, Effect of 5-FU alone and a combination of MR and 5-FU on metabolites in tumour, plasma and liver evaluated by the log10 (FC). Box limits are the 25th and 75th percentiles, center lines are medians, and the whiskers are the minimal and maximal values. The data represents metabolites in liver (337), plasma (282), and tumour (332) from n= 8 animals/group. c, Numbers of metabolites significantly changed by MR, 5-FU or a combination of MR and 5-FU in plasma, tumour and liver. *p<0.05, two-tailed Student’s t-test. d, Pathway analysis of metabolites significantly changed (*p<0.05, two-tailed Student’s t-test) by MR, 5-FU, or by the combination of dietary MR and 5-FU with false discovery rate < 0.5. e-g, Relative intensity of metabolites related to cysteine and methionine metabolism and nucleotide metabolism in tumour (e) and redox balance in liver (f) and plasma (g). GSH, glutathione; GSSG, the oxidized form of glutathione; α–KG, α–ketoglutarate. Mean ± s.e.m., n = 8 animals/group, *p<0.05, two-tailed Student’s t-test. h, Spearman’s rank correlation coefficients of MR and 5-FU-induced FC of metabolites in tumour, plasma and liver from mice on dietary MR and 5-FU.
Extended Data Fig. 6.
Extended Data Fig. 6.. MR-mediated inhibition of cell growth is largely due to interruptions to nucleosides production and redox balance
a, Synergic effect of MR and 5-FU in CRC119 primary cells and HCT116 cells were evaluated by cell counting. Mean ± s.e.m., n=3 biological replicates, * p<0.05 by two-tailed Student’s t-test. b, Rescue effect of choline, formate, sulfur-donor homocysteine (Hcy), Hcy+B12, nucleosides, and antioxidant N-acetylcysteine (NAC) alone or in combination on MR-mediated inhibition of HCT116 cell proliferation. Mean ± s.e.m., n=9 biologically independent samples from three independent experiments, * p<0.05 vs control, ^ p<0.05 vs MR, # p<0.05 vs 5-FU; $ p<0.05 vs MR+5-FU by two-tailed Student’s t-test. c, Mass intensity for M+1 dTTP and M+1 methionine in HCT116 cells from experiment described in Fig. 2h. Mean ± s.d., n=3 biologically independent samples, *p<0.05 vs control and #p<0.05 vs MR by two-tailed Student’s t-test.
Extended Data Fig. 7.
Extended Data Fig. 7.. Dietary MR sensitizes RAS-driven autochthonous sarcoma mouse models to radiation
a, Volcano plots of metabolites in tumour, plasma and liver, and pathway analysis of metabolites significantly changed (*p<0.05, two-tailed Student’s t-test) by dietary MR alone (false discovery rate < 1). FC, fold change. b, Spearman’s rank correlation coefficients of MR-induced FC of metabolites in tumour, plasma and liver. c, Volcano plots of metabolites in tumour, plasma and liver, and pathway analysis of metabolites significantly changed (*p<0.05, two-tailed Student’s t-test) by dietary MR and radiation (false discovery rate < 0.5). d, Spearman’s rank correlation coefficients of MR and radiation-induced FC of metabolites in tumour, plasma and liver. e, Relative intensity of metabolites related to cysteine and methionine metabolism and energy balance in tumours. Mean ± s.d., n= 7 animals/group except for MR group (n=6), *p<0.05 vs control by two-tailed Student’s t-test. f-g, The largest effects on metabolism occurred in the combination of diet and radiation. f, Effect of MR and radiation alone or in combination on metabolites in tumour, plasma and liver evaluated by the log10 (FC). Box limits are the 25th and 75th percentiles, center lines are medians, and the whiskers are the minimal and maximal values. The data represents metabolites in liver (319), plasma (308), and tumour (332) from n= 7 animals/group except for MR group (n=6). g, Numbers of metabolites significantly changed (*p<0.05, two-tailed Student’s t-test) by MR and radiation alone or in combination.
Extended Data Fig. 8.
Extended Data Fig. 8.. Dietary MR can be achieved in humans
a, Heatmap of significantly changed (*p<0.05, two-tailed Student’s t-test) plasma metabolites by dietary intervention in six human subjects. b, Volcano plot of plasma metabolites. FC, fold change. P values were determined by two-tailed Student’s t-test. c, Pathway analysis of altered (*p<0.05, two-tailed Student’s t-test) plasma metabolites. d, Relative intensity of amino acids in plasma. N= biologically independent humans, *p<0.05 by two-tailed Student’s t-test.
Extended Data Fig. 9.
Extended Data Fig. 9.. Comparative metabolic effects of MR across mouse models and humans
a, Spearman’s rank correlation coefficients of MR-induced fold changes of methionine-related metabolites (defined in Extended Data Fig. 3f) in plasma samples from non-tumour bearing C57BL/6J mice, PDX CRC119 and CRC240 mouse models, sarcoma mouse model, and healthy human subjects. b, Spearman’s rank correlation coefficients among different models in a ranked from the highest to the lowest.
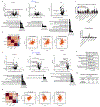
Fig. 1
Fig. 1. Dietary MR rapidly and specifically alters methionine and sulfur metabolism and inhibits tumour growth in colorectal patient-derived xenograft (PDX) models
a, Experimental design in C57BL/6J mice. n=5 animals/group. b, 90 sets of metabolic profiles from a were computed for singular values via singular value decomposition. Insertion: two-sided t-test p-values assessing difference between control and MR in the first three modes. n=5 animals/group. Box limits are the 25th and 75th percentiles, center lines are medians, and the whiskers are the minimal and maximal values. c, Contribution of modes 2 and 3 in b ranked across all measured metabolites. d, Relative intensity of methionine and methionine sulfoxide. Mean ± s.d., n=5 animals/group, *p<0.05 by two-tailed Student’s t-test. e, Schematic of experimental design using colorectal PDXs. Treatment: n=7/group, 4 females + 3 males, prevention: n=8/group, 4 females + 4 males. f, Tumour growth curve and images of tumours at the end point from e. Mean ± s.e.m., *p<0.05 by two-tailed Student’s t-test.
Fig. 2
Fig. 2. Dietary MR sensitizes CRC PDX models to chemotherapy 5-Fluorouracil (5-FU)
a, Experimental design. b, Tumour growth curves, quantitation, and images at the end point. Mean ± s.e.m., *p<0.05 by two-tailed Student’s t-test. n=8 animals/group, 4 females + 4 males. c, Relative intensity of metabolites related to nucleotide metabolism and redox balance in tumours. Mean ± s.e.m., *p<0.05 vs control by two-tailed Student’s t-test. n=8 animals/group. d, Volcano plots of metabolites in tumours. FC, fold change. P values were determined by two-tailed Student’s t-test. e, Schematic of supplementation experiments with added metabolites in blue. Hcy, homocysteine; NAC, N-acetylcysteine. f, Effect of nutrient supplements on MR alone or with 5-FU -inhibited cell proliferation in CRC119 primary cells. Mean ± s.e.m., n=9 biologically independent samples from three independent experiments, * p<0.05 vs control, ^ p<0.05 vs MR, # p<0.05 vs 5-FU; $ p<0.05 vs MR+5-FU by two-tailed Student’s t-test. g, U-13C-Serine tracing. h, Mass intensity for M+1 dTTP and M+1 methionine in CRC119 cells. Mean ± s.d., n=3 biologically independent samples, *p<0.05 vs control, #p<0.05 vs MR by two-tailed Student’s t-test.
Fig. 3
Fig. 3. Dietary MR sensitizes RAS-driven autochthonous sarcoma mouse models to radiation
a, Experimental design. b, Time to tumour tripling and tumour growth curve from mice on dietary treatment only. Mean ± s.d., Control: n=8 animals, MR: n=7 animals. c, Time to tumour tripling and tumour growth curve from mice on the combination of dietary treatment and radiation. Mean ± s.d., n=15 animals/group, *p<0.05 by two-tailed Student’s t-test. d-e, Relative intensity of nucleotides (d) and metabolites related to redox balance (e) in tumours. Mean ± s.e.m., n=7 animals/group except for MR (n=6), *p<0.05 compared to the control group by two-tailed Student’s t-test.
Fig. 4
Fig. 4. Dietary MR can be achieved in humans
a, Experimental design, including background information on participated in the dietary study and representative daily MR diet. b-c, Relative intensity of plasma metabolites related to cysteine and methionine metabolism, and purine and pyrimidine metabolism (b) and in the other top impacted pathways (c). N=6 humans, *p<0.05 by two-tailed Student’s t-test. d, MR-induced fold changes (FC) of plasma metabolites in cysteine and methionine metabolism, and pyrimidine and purine metabolism in C57BL/6J mice (n=5) and humans (n=6). Mean ± s.e.m., *p<0.05 by two-tailed Student’s t-test. e, Model

Comment in

References

    1. DeBerardinis RJ & Chandel NS Fundamentals of cancer metabolism. Sci Adv 2, e1600200, doi: 10.1126/sciadv.1600200 (2016). - DOI - PMC - PubMed
    1. Goncalves MD, Hopkins BD & Cantley LC Dietary Fat and Sugar in Promoting Cancer Development and Progression. Annual Review of Cancer Biology 3, 255–273, doi: 10.1146/annurev-cancerbio-030518-055855 (2019). - DOI
    1. Cantor JR et al. Physiologic Medium Rewires Cellular Metabolism and Reveals Uric Acid as an Endogenous Inhibitor of UMP Synthase. Cell 169, 258–272 e217, doi: 10.1016/j.cell.2017.03.023 (2017). - DOI - PMC - PubMed
    1. Tardito S et al. Glutamine synthetase activity fuels nucleotide biosynthesis and supports growth of glutamine-restricted glioblastoma. Nat Cell Biol 17, 1556–1568, doi: 10.1038/ncb3272 (2015). - DOI - PMC - PubMed
    1. Liu X, Romero IL, Litchfield LM, Lengyel E & Locasale JW Metformin Targets Central Carbon Metabolism and Reveals Mitochondrial Requirements in Human Cancers. Cell Metab 24, 728–739, doi: 10.1016/j.cmet.2016.09.005 (2016). - DOI - PMC - PubMed

Publication types

MeSH terms