. 2019 Aug;572(7769):323-328.
doi: 10.1038/s41586-019-1457-z. Epub 2019 Jul 31.

Exome sequencing of Finnish isolates enhances rare-variant association power

Affiliations

Exome sequencing of Finnish isolates enhances rare-variant association power

Adam E Locke et al. Nature. 2019 Aug.

Erratum in

  • Author Correction: Exome sequencing of Finnish isolates enhances rare-variant association power.
    Locke AE, Steinberg KM, Chiang CWK, Service SK, Havulinna AS, Stell L, Pirinen M, Abel HJ, Chiang CC, Fulton RS, Jackson AU, Kang CJ, Kanchi KL, Koboldt DC, Larson DE, Nelson J, Nicholas TJ, Pietilä A, Ramensky V, Ray D, Scott LJ, Stringham HM, Vangipurapu J, Welch R, Yajnik P, Yin X, Eriksson JG, Ala-Korpela M, Järvelin MR, Männikkö M, Laivuori H; FinnGen Project; Dutcher SK, Stitziel NO, Wilson RK, Hall IM, Sabatti C, Palotie A, Salomaa V, Laakso M, Ripatti S, Boehnke M, Freimer NB. Locke AE, et al. Nature. 2019 Nov;575(7783):E4. doi: 10.1038/s41586-019-1726-x. Nature. 2019. PMID: 31686056

Abstract

Exome-sequencing studies have generally been underpowered to identify deleterious alleles with a large effect on complex traits as such alleles are mostly rare. Because the population of northern and eastern Finland has expanded considerably and in isolation following a series of bottlenecks, individuals of these populations have numerous deleterious alleles at a relatively high frequency. Here, using exome sequencing of nearly 20,000 individuals from these regions, we investigate the role of rare coding variants in clinically relevant quantitative cardiometabolic traits. Exome-wide association studies for 64 quantitative traits identified 26 newly associated deleterious alleles. Of these 26 alleles, 19 are either unique to or more than 20 times more frequent in Finnish individuals than in other Europeans and show geographical clustering comparable to Mendelian disease mutations that are characteristic of the Finnish population. We estimate that sequencing studies of populations without this unique history would require hundreds of thousands to millions of participants to achieve comparable association power.


Conflict of interest statement

Competing interests statements:

VS has participated in a conference trip sponsored by Novo Nordisk and received a honorarium from the same source for participating in an advisory board meeting. He also has ongoing research collaboration with Bayer Ltd.

HL is a member of the Nordic Expert group unconditionally supported by Gedeon Richter Nordics and has received an honorarium from Orion.

Figures

Extended Data Fig. 1
Extended Data Fig. 1. Allele frequency comparisons between FinMetSeq and NFE from gnomAD.
A) Distribution of allelic frequencies between FinMetSeq and gnomAD NFE. The comparison of allele frequencies shows the excess of variants at higher frequency in Finland as a result of the multiple bottlenecks experienced in Finnish population history. B) Proportional site frequency spectra between FinMetSeq and gnomAD NFE by variant annotation class. In general, we find a depletion of the variants in the rarest frequency class, as well as enrichment of variants in the intermediate to common frequency range. The site frequency spectra were down-sampled to 18,000 chromosomes for each dataset. C) Comparison of MAFs for trait-associated variants in FinMetSeq and NFE gnomAD. Plotted in gray background is a 2-D histogram of variants with non-zero allele frequencies in both gnomAD and FinMetSeq but no trait associations. Variants associated with at least one trait are colored and scaled inversely proportional to the logarithm of the association p-value. Variants >10x enriched in FinMetSeq compared to NFE are pink, those <10x enriched are in blue. The dashed line is the line of equal frequency. Two-sided uncorrected P-values are from a regression of trait on the count of alternative allele at each variant. The number of independent individuals used in each point is listed in Supplementary Table 5.
Extended Data Figure 2
Extended Data Figure 2. Heritability of and correlations between traits.
Traits are in the same order, clockwise in A, and left to right and top to bottom in B, following the trait group color key. A) Heritability estimated in 13,342 unrelated individuals (for abbreviations see Supplementary Table 4), for details see Supplementary Table 6. B) Heatmap of: 1) absolute Pearson correlations of standardized trait values in upper triangle; 2) absolute values of estimated pairwise genetic correlations in lower triangle. Genetic correlations are estimated in 13,342 unrelated individuals. Values below the diagonal in gray had trait heritability less than 1.5 times the SE of heritability.
Extended Data Fig. 3
Extended Data Fig. 3. Properties of associations shared between traits.
A) Shared genomic associations by pairs of traits. For traits x and y, color in row x and column y reflects the number of loci associated with both traits divided by the number of loci associated with trait x. Traits are presented in the same order as in Extended Data Figure 2A, and the side and top color bars reflect trait groups. B) Relationship between estimated genetic correlation and extent of sharing of genetic associations. For each trait-pair, the extent of locus sharing is defined as the number of loci associated with both traits divided by the total number of loci associated with either trait. Analysis using the absolute value of the Pearson correlation of the residual series results in a very similar pattern. The number of trait pairs in each x-axis category are as follows: 0-1%: 819; 1-10%: 204, 11-20%: 102; 21-30%: 41; 31-40%: 29; 41-50%: 16, >50%: 13. The bar within each box is the median, the box represents the upper and lower quartiles, whiskers extend to 1.5x the interquartile range, and points represent outliers.
Extended Data Fig. 4
Extended Data Fig. 4. Gene-based association of extremely rare variants in APOB with serum total cholesterol.
The upper panel shows the distribution of the covariate adjusted and inverse-normal transformed phenotype. The lower panel displays the association statistics for each variant included in the gene-based test along with the trait value for minor allele carriers of each variant (orange triangles). SV.P is the P-value from the analysis of each variant in a single-variant analysis. The number of independent individuals in the analysis is 19,291.
Extended Data Fig. 5
Extended Data Fig. 5. Gene-based association of rare variants in SECTM1 with HDL2 cholesterol.
The upper panel shows the distribution of the covariate adjusted and inverse-normal transformed phenotype. The lower panel displays the association statistics for each variant included in the gene-based test, along with the trait value for minor allele carriers of each variant (orange triangles). SV.P is the P-value from the analysis of each variant in a single-variant analysis. The number of independent individuals in the analysis is 10,984.
Extended Data Fig. 6
Extended Data Fig. 6. Gene-based association of extremely rare variants in ALDH1L1 with glycine levels.
The upper panel shows the distribution of the covariate adjusted and inverse-normal transformed phenotype. The lower panel displays the association statistics for each variant included in the gene-based test, along with the trait value for minor allele carriers of each variant (orange triangles). SV.P is the P-value from the analysis of each variant in a single-variant analysis. The number of independent individuals in the analysis is 8,206.
Extended Data Fig. 7
Extended Data Fig. 7. Population structure of the FinMetSeq dataset, by region.
Population structure, by region, from principal components analysis of exome sequencing variant data (MAF > 1%), for 14,874 unrelated individuals known parental birthplaces. Color indicates individuals with both parents born in the same region; gray indicates individuals with different parental birth regions, or missing information for one parent. Abbreviations for the regions: Usm, Uusimaa; Swf, Southwest Finland; Stk, Satakunta; Khm, Kanta-Hame; Prk, Pirkanmaa; Phm, Paijat-Hame; Kyl, Kymenlaakso; SKa, Southern Karelia; Nka, Northern Karelia; SSv, Southern Savonia; NSv, Northern Savonia; Ctf, Central Finland; SOs, Southern Ostrobothnia; Osb, Ostrobothnia; COs, Central Ostrobothnia; NOs, Northern Ostrobothnia; Kai, Kainuu; Lap, Lapland; X, split parental birthplaces. Large solid circles represent the center of each region.
Extended Data Fig. 8
Extended Data Fig. 8. Hierarchical clustering tree produced by fineSTRUCTURE.
We identified 16 subpopulations within the FinMetSeq dataset by applying a haplotype-based clustering algorithm, fineSTRUCTURE, on 2,644 unrelated individuals born by 1955 whose parents were both born in the same municipality (Methods). Each subpopulation is named based on the most common parental birth location among its members, with the following abbreviations: NKa, North Karelia; NSv, North Savonia; SOs, South Ostrobothnia; NOs, North Ostrobothnia; Kai, Kainuu; Lap, Lapland; SuK, Surrendered Karelia. A map of Finland with regions labeled is supplied for reference. If multiple subpopulations share the same location label, the subpopulation is further distinguished with a numeral. NSv3 is used as an internal reference in enrichment analysis. See Supplementary Table 17 for more detailed demographic descriptions of each subpopulation.
Extended Data Fig. 9
Extended Data Fig. 9. Regional variation in allele frequencies by functional annotation.
Enrichment of variants by allelic class in regional sub-populations of late settlement Finland (defined in Supplementary Table 17). Each bin represents the ratio of variants in the subpopulation compared to the reference subpopulation (NSv3), after down-sampling the frequency spectra of all populations to 200 chromosomes. Pink cells represent an enrichment (ratio >1), blue cells represent a depletion (ratio <1). Sample sizes and confidence intervals on each enrichment ratios, and their P-values, are presented in Supplementary Table 18. The results are consistent with multiple bottlenecks in late settlement Finland, particularly for populations in Lapland and Northern Ostrobothnia.
Figure 1
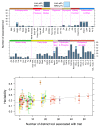
Figure 1. Characterization of associations.
A) Number of genomic loci associated with each trait. Bars are subdivided into common (MAF>1%, dark blue) and rare (MAF≤1%, light blue). B) Relationship between estimated heritability and number of loci detected per trait. Each trait is colored by trait group. Vertical bars indicate ±2 standard errors. The gray line shows the linear regression fit to indicate the general trend. The number of independent individuals used in each point is listed in Supplementary Table 5. Height is the notable outlier.
Figure 2
Figure 2. Allelic enrichment in the Finnish population and its effect on genetic discovery.
A) Relationship between MAF and estimated effect size for associations discovered in FinMetSeq. Each variant reaching significance in FinMetSeq is plotted, with associations in Table 1 represented by dark blue points (FinMetSeq MAF) and green points (NFE MAF). Purple lines indicate 80% power curves for sample sizes of 10,000 and 20,000 at α=5x10⁻⁷. B) Same plot as in A, highlighting the variants in Table 1 only reaching significance in the combined analysis.
Figure 3
Figure 3. Geographical clustering of associated variants.
A) Example of geographical clustering for a novel trait-associated variant (Table 1). The map shows birth locations of all 113 parents of carriers (orange) and 113 randomly selected parents of non-carriers (blue) of the minor allele for rs780671030 in ALDH1L1. B) FDH mutations (N=38) geographically cluster (by parental birthplace) similarly to trait-associated variants (Table 1) that are >10x more frequent in FMS than in NFE (N=12) and more than enriched variants from our combined analysis (N=7). For all variants, carriers clustered more than non-carriers (center line, median; box limits, upper and lower quartiles; whiskers, 1.5 interquartile range; points, outliers).

References

    1. Samocha KE, et al. Regional missense constraint improves variant deleteriousness prediction. bioRxiv. 2017 doi: 10.1101/148353. - DOI
    1. Marouli E, et al. Rare and low-frequency coding variants alter human adult height. Nature. 2017;542:186–190. doi: 10.1038/nature21039. - DOI - PMC - PubMed
    1. Flannick J, et al. Exome sequencing of 20,791 cases of type 2 diabetes and 24,440 controls. Nature. 2019;570:71–76. doi: 10.1038/s41586-019-1231-2. - DOI - PMC - PubMed
    1. Timpson NJ, Greenwood CMT, Soranzo N, Lawson DJ, Richards JB. Genetic architecture: the shape of the genetic contribution to human traits and disease. Nature reviews. Genetics. 2018;19:110–124. doi: 10.1038/nrg.2017.101. - DOI - PubMed
    1. Zuk O, et al. Searching for missing heritability: designing rare variant association studies. Proc Natl Acad Sci U S A. 2014;111:E455–464. doi: 10.1073/pnas.1322563111. - DOI - PMC - PubMed

Publication types

Substances