

3D Multi-Echo Dixon technique for simultaneous assessment of liver steatosis and iron overload in patients with chronic liver diseases: a feasibility study
- PMID: 31367555
- PMCID: PMC6629573
- DOI: 10.21037/qims.2019.05.20
3D Multi-Echo Dixon technique for simultaneous assessment of liver steatosis and iron overload in patients with chronic liver diseases: a feasibility study
Abstract
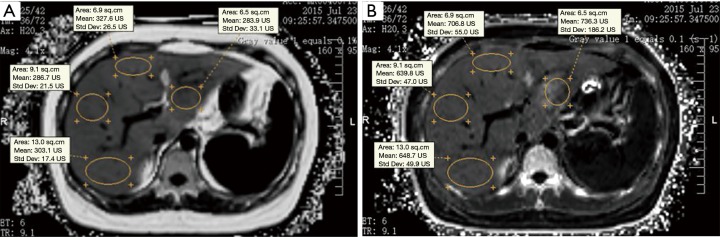
Background: Patients with chronic liver diseases (CLDs) often suffer from lipidosis or siderosis. Proton density fat fraction (PDFF) and R2* can be used as quantitative parameters to assess the fat/iron content of the liver. The aim of this study was to evaluate the influence of liver fibrosis and inflammation on the 3D Multi-echo Dixon (3D ME Dixon) parameters (MRI-PDFF and R2*) in patients with CLDs and to determine the feasibility of 3D ME Dixon technique for the simultaneous assessment of liver steatosis and iron overload using histopathologic findings as the reference standard.
Methods: Ninety-nine consecutive patients with CLDs underwent T1-independent, T2*-corrected 3D ME Dixon sequence with reconstruction using multipeak spectral modeling on a 3T MR scanner. Liver specimen was reviewed in all cases, grading liver steatosis, siderosis, fibrosis, and inflammation. Spearman correlation analysis was performed to determine the relationship between 3D ME Dixon parameters (MRI-PDFF and R2*) and histopathological and biochemical features [liver steatosis, iron overload, liver fibrosis, inflammation, alanine aminotransferase (ALT), aspartate aminotransferase (AST), total bilirubin (TBIL)]. Multiple regression analysis was applied to identify variables associated with 3D ME Dixon parameters. Receiver operating characteristic (ROC) analysis was performed to determine the diagnostic performance of these parameters to differentiate liver steatosis or iron overload.
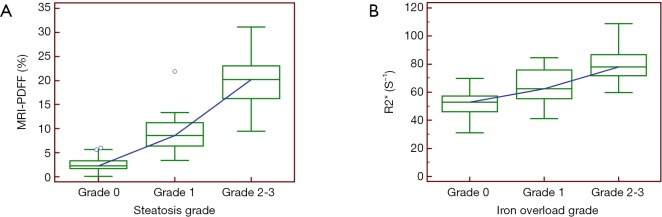
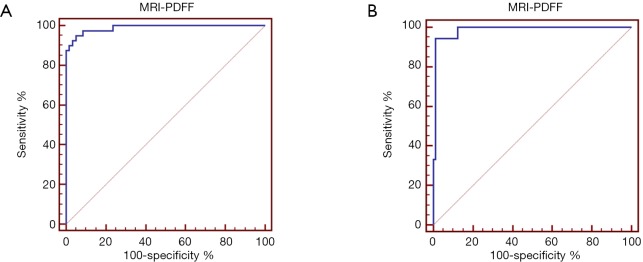
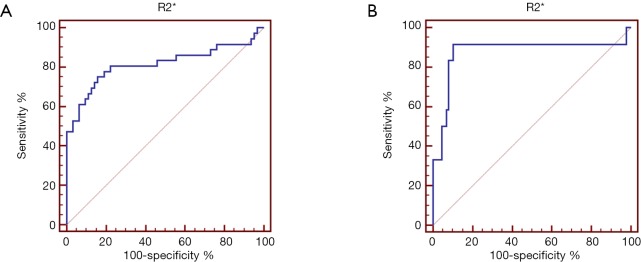
Results: In multivariate analysis, only liver steatosis independently influenced PDFF values (R2=0.803, P<0.001), liver iron overload and fibrosis influenced R2* values (R2=0.647, P<0.001). The Spearman analyses showed that R2* values were moderately correlated with fibrosis stages (r=0.542, P<0.001) in the subgroup with the absence of iron overload. The area under the ROC curve of PDFF was 0.989 for the diagnosis of steatosis grade 1 or greater, and 0.986 for steatosis grade 2 or greater. The area under the ROC curve of R2* was 0.815 for identifying iron overload grade 1 or greater, and 0.876 for iron overload grade 2 or greater.
Conclusions: 3D Multi-Echo Dixon can be used to simultaneously evaluate liver steatosis and iron overload in patients with CLDs, especially for quantification of liver steatosis. However, liver R2* value may be affected by the liver fibrosis in the setting of CLDs with absence of iron overload.
Keywords: Magnetic resonance imaging; chronic liver disease (CLD); iron overload; steatosis.
Conflict of interest statement
Conflicts of Interest: The authors have no conflicts of interest to declare.
Figures
References
LinkOut - more resources
Full Text Sources