

Validation of discrete time-to-event prediction models in the presence of competing risks
- PMID: 31368172
- PMCID: PMC7217187
- DOI: 10.1002/bimj.201800293
Validation of discrete time-to-event prediction models in the presence of competing risks
Abstract
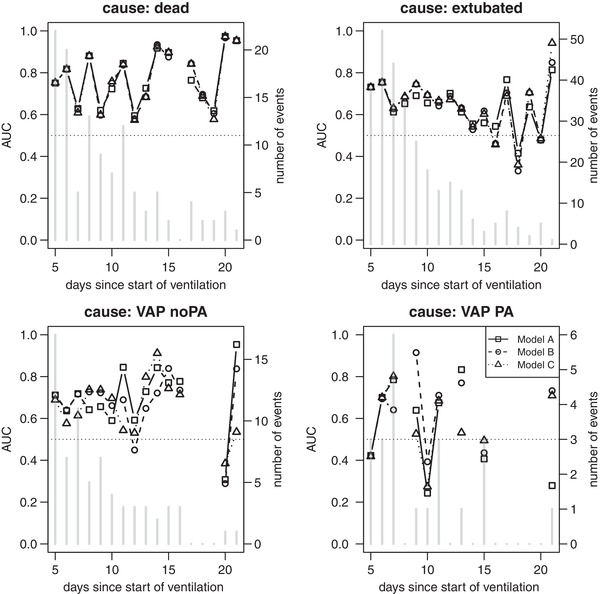
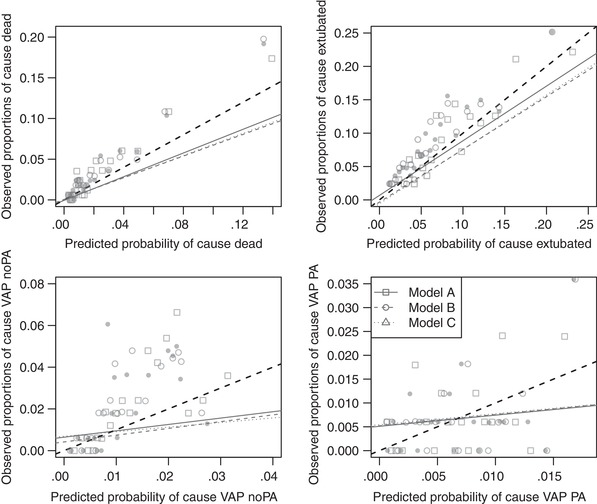
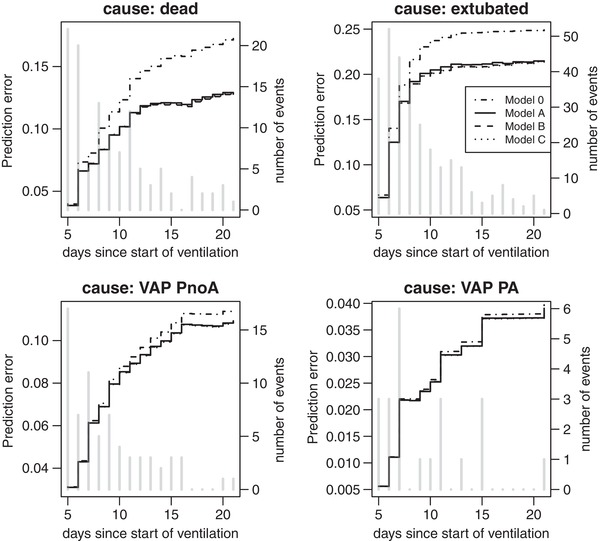
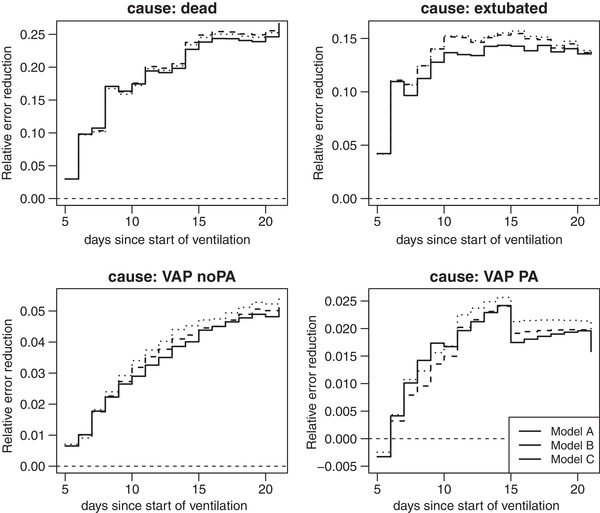
Clinical prediction models play a key role in risk stratification, therapy assignment and many other fields of medical decision making. Before they can enter clinical practice, their usefulness has to be demonstrated using systematic validation. Methods to assess their predictive performance have been proposed for continuous, binary, and time-to-event outcomes, but the literature on validation methods for discrete time-to-event models with competing risks is sparse. The present paper tries to fill this gap and proposes new methodology to quantify discrimination, calibration, and prediction error (PE) for discrete time-to-event outcomes in the presence of competing risks. In our case study, the goal was to predict the risk of ventilator-associated pneumonia (VAP) attributed to Pseudomonas aeruginosa in intensive care units (ICUs). Competing events are extubation, death, and VAP due to other bacteria. The aim of this application is to validate complex prediction models developed in previous work on more recently available validation data.
Keywords: area under the curve; calibration slope; competing events; discrete time-to-event model; dynamic prediction models; prediction error; validation.
© 2019 The Authors. Biometrical Journal published by WILEY-VCH Verlag GmbH & Co. KGaA, Weinheim.
Figures
References
-
- Antolini, L. , Boracchi, P. , & Biganzoli, E . (2005). A time‐dependent discrimination index for survival data. Statistics in Medicine, 24(24), 3927–3944. - PubMed
-
- Bekaert, M. , Timsit, J.‐F. , Vansteelandt, S. , Depuydt, P. , Vésin, A. , Garrouste‐Orgeas, M. , … Benoit, D . (2011). Attributable mortality of ventilator‐associated pneumonia: A reappraisal using causal analysis. American Journal of Respiratory and Critical Care Medicine, 184(10), 1133–1139. - PubMed
-
- Berger, M. , & Schmid, M . (2018). Semiparametric regression for discrete time‐to‐event data. Statistical Modelling, 18(3–4), 1–24.
-
- Beyersmann, J. , Allignol, A. , & Schumacher, M. (2012). Competing risks and multistate models with R. New York: Springer. - PubMed
-
- Blanche, P. , Dartigues, J.‐F. , & Jacqmin‐Gadda, H . (2013). Estimating and comparing time‐dependent areas under receiver operating characteristic curves for censored event times with competing risks. Statistics in Medicine, 32(30), 5381–5397. - PubMed
Publication types
MeSH terms
Grants and funding
LinkOut - more resources
Full Text Sources
Miscellaneous
