

Nuclear envelope deformation controls cell cycle progression in response to mechanical force
- PMID: 31368207
- PMCID: PMC6726894
- DOI: 10.15252/embr.201948084
Nuclear envelope deformation controls cell cycle progression in response to mechanical force
Abstract
The shape of the cell nucleus can vary considerably during developmental and pathological processes; however, the impact of nuclear morphology on cell behavior is not known. Here, we observed that the nuclear envelope flattens as cells transit from G1 to S phase and inhibition of myosin II prevents nuclear flattening and impedes progression to S phase. Strikingly, we show that applying compressive force on the nucleus in the absence of myosin II-mediated tension is sufficient to restore G1 to S transition. Using a combination of tools to manipulate nuclear morphology, we observed that nuclear flattening activates a subset of transcription factors, including TEAD and AP1, leading to transcriptional induction of target genes that promote G1 to S transition. In addition, we found that nuclear flattening mediates TEAD and AP1 activation in response to ROCK-generated contractility or cell spreading. Our results reveal that the nuclear envelope can operate as a mechanical sensor whose deformation controls cell growth in response to tension.
Keywords: TEAD; AP1; c-Jun; mechanotransduction; nuclear envelope.
© 2019 The Authors. Published under the terms of the CC BY 4.0 license.
Conflict of interest statement
The authors declare that they have no conflict of interest.
Figures
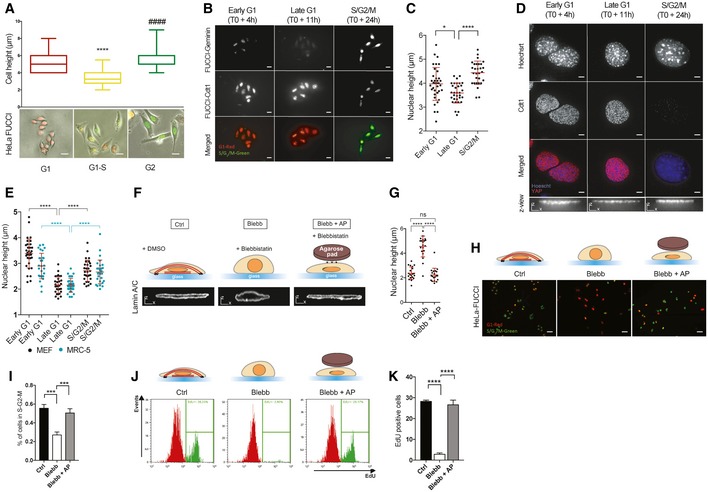
Cell height was measured using AFM for HeLa‐FUCCI in the indicated phase of mitosis. Below: representative images of synchronized HeLa‐FUCCI (box plot, median min/max, n = 20 minimum, ****, #### P < 0.001 one‐way ANOVA—Tukey's multiple comparisons post‐test, scale bar 15 μm).
Representative images of synchronized HeLa stained with an anti‐geminin to confirm the indicated phase of mitosis (scale bar 15 μm).
Nucleus height was measured by immunofluorescence using Hoechst staining (n = 29 minimum for nucleus height, *P < 0.5, ****P < 0.001 one‐way ANOVA—Tukey's multiple comparisons post‐test).
Representative images of synchronized MEFs stained with an anti‐Cdt1 to confirm the indicated phase of mitosis (scale bar 5 μm, bottom scale bar x = 5 μm z = 5 μm).
Nucleus height of synchronized MEFs (black dot) and synchronized MRC‐5 (blue dot) was measured by immunofluorescence using Hoechst staining. Data are presented as mean ± s.e.m. (n = 29 minimum for nucleus height, ****P < 0.001 one‐way ANOVA—Tukey's multiple comparisons post‐test).
Schematic representation of the method used to induce changes in nuclear shape independently of the actomyosin cytoskeleton. See Fig EV1 for more details. Briefly, cells are treated with DMSO (Control‐Ctrl), blebbistatin only (Blebb), and blebbistatin whereas an agarose pad (AP) is used to flatten their nuclei and restore a nuclear morphology similar to those of control cells (Blebb + AP). XZ view of representative nuclei (lamin A/C) is shown in these three conditions (scale bar x = 5 μm z = 5 μm).
Nucleus height was measured by immunofluorescence using lamin A/C staining. Data are presented as mean ± s.e.m. (n = 20 for nucleus height, ****P < 0.001 one‐way ANOVA—Tukey's multiple comparisons post‐test).
Representative HeLa‐FUCCI cells in S‐G2‐M (green) and G1 phase (red) in Ctrl, Blebb, and Blebb + AP conditions. Scale bar = 31 μm.
Corresponding percentage of HeLa‐FUCCI in mitosis. Data are presented as mean ± s.e.m. (n = 24 fields minimum from four independent experiments, ***P < 0.01 one‐way ANOVA—Tukey's multiple comparisons post‐test).
Representative flow cytometry histograms for EdU‐positive cells in Ctrl, Blebb, and Blebb + AP conditions.
Corresponding percentage of EdU‐positive cells. Data are presented as mean ± s.e.m. (n = 4 independent experiments with at least 60,000 events for each condition per experiment. ****P < 0.001 one‐way ANOVA—Tukey's multiple comparisons post‐test).
- A
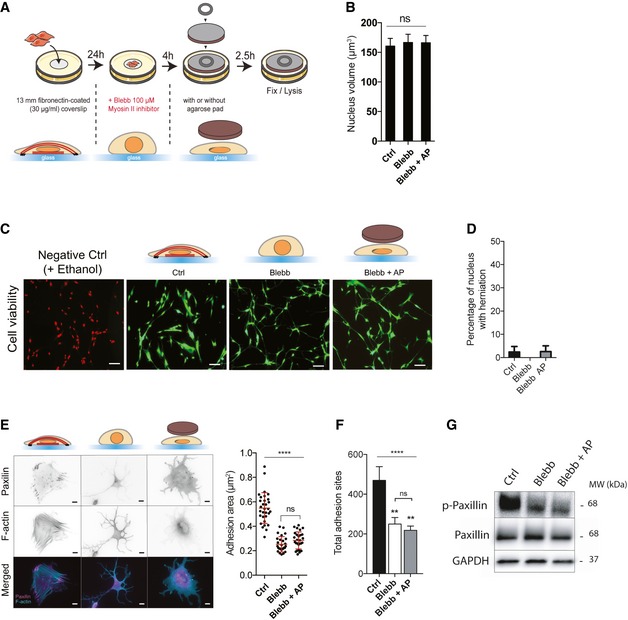
MRC5 cells were cultured on a 13‐mm fibronectin‐coated glass coverslip (for IF) or a 35‐mm fibronectin‐ coated dish (for biochemistry) during 24 h. The medium is replaced with a fresh medium containing blebbistatin (100 μM) for 4 h. Then, an agarose pad (AP) is gently applied on cells. A 32‐mm coverslip with a 425 mg washer is used to maintain the agarose pad. 2.5 h later, cells are fixed using 3.7% PFA (IF) or directly lysed with a Laemmli lysis buffer.
- B
DNA staining was used to quantify nuclear volume in the indicated conditions. Data are presented as mean ± s.e.m. (n = 37 minimum from two independent experiments, ns: not significant, one‐way ANOVA).
- C
Representative images of MRC5 cells assessed for cell viability using calcein/AM (green) and ethidium homodimer (Red) in Ctrl, Blebb, and Blebb + AP conditions. Ethanol was used to induce cell apoptosis (negative Ctrl).
- D
Percentage of cells with nuclear herniation. Data are presented as mean ± s.e.m. (n = 40 minimum from two independent experiments).
- E, F
Representative cells stained for actin‐F (cyan) and focal adhesions (paxillin—magenta) in Ctrl, Blebb, and Blebb + AP conditions. Scale bar = 10 μm. Quantifications of (e) adhesion areas using paxillin staining (n = 28 from three independent experiments, ****P < 0.001 one‐way ANOVA—Tukey's multiple comparisons post‐test) and (f) total adhesion sites using p‐Tyr antibody (n = 10, **P < 0.01, ****P < 0.001 one‐way ANOVA—Tukey's multiple comparisons post‐ test). Data are presented as mean ± s.e.m.
- G
Immunoblots of p‐paxillin (Y118), paxillin, and GAPDH for Ctrl, Blebb, and Blebb + AP conditions.
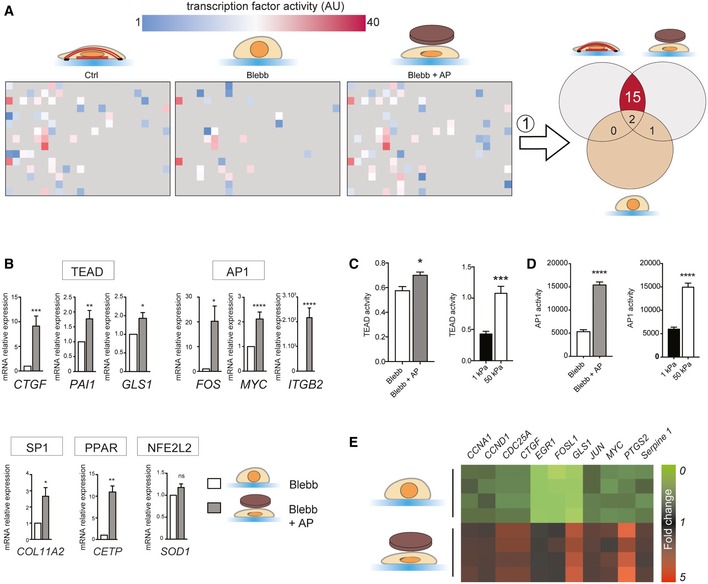
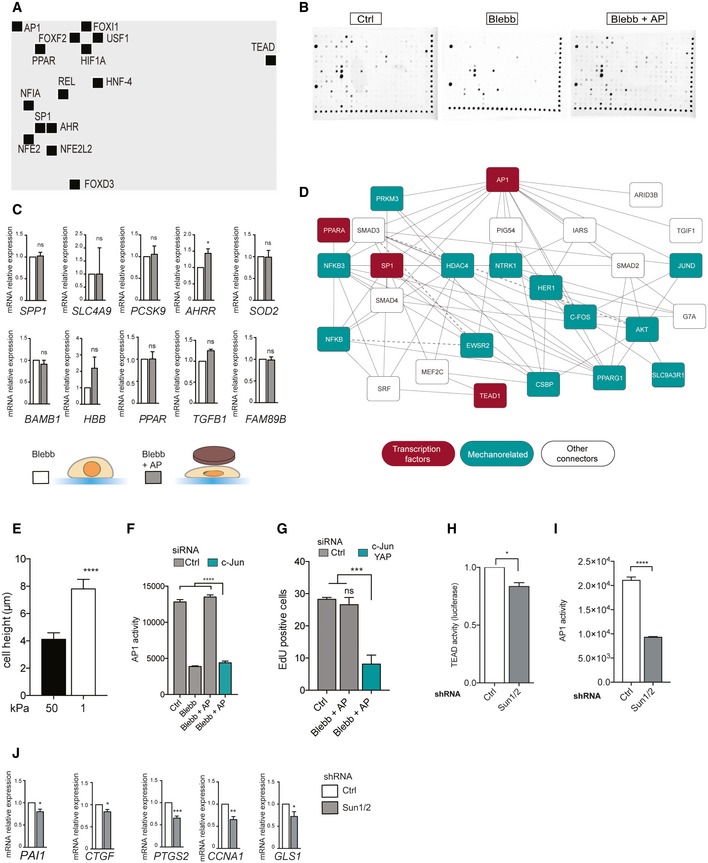
Analysis of transcription factor activity (Affymetrix combo protein–DNA array) for Ctrl, Blebb, and Blebb + AP conditions. Each square corresponds to a specific transcription factor (TF) activity and is color coded to show the relative activity. To identify TFs regulated by nuclear shape, we selected TFs that were more active in Ctrl and Blebb + AP compared to blebbistatin‐treated cells (Blebb).
TF's target genes and GAPDH mRNA levels were analyzed by real‐time‐qPCR. Results are expressed as relative mRNA expression levels. Data are presented as mean ± s.e.m. (n = 4 minimum, t‐test *P < 0.5, **P < 0.05, ***P < 0.01, ****P < 0.001).
TEAD activity was analyzed in HeLa cells co‐transfected with a Renilla plasmid as a luciferase reporter plasmid controlled by the TEAD‐responsive promoter, and with a Renilla plasmid as a gene reporter; HeLa cells were cultured on 1 and 50 kPa (n = 3, t‐test ***P < 0.01) or treated with blebbistatin and blebbistatin + AP (n = 6; t‐test *P < 0.5). Data are presented as mean ± s.e.m.
AP1 activity was assessed in the indicated conditions using AP1 reporter assay. Data are presented as mean ± s.e.m. (n = 5, t‐test ****P < 0.001).
Heatmap of mRNA expression profiles of genes regulated by TEAD and AP1.
- A–D
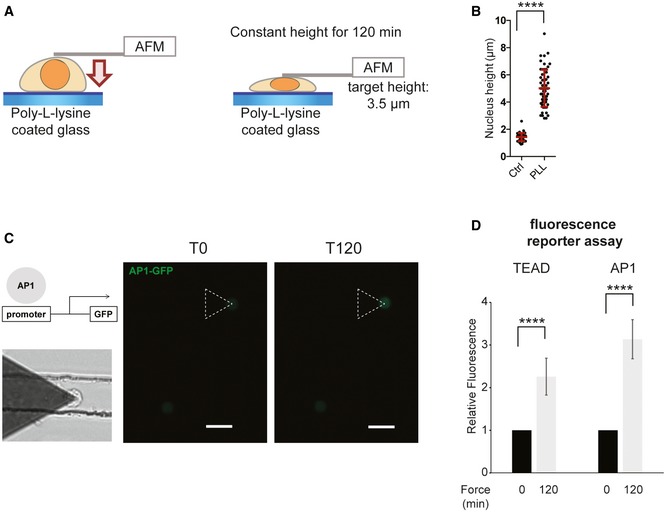
HeLa cells were transfected with AP1 GFP reporter or TEAD GFP reporter and plated on poly‐L‐lysine surface for 1 h. Then, atomic force microscopy was used to apply compressive force on the nucleus. After positioning the cantilever above the nucleus, constant height mode was used (target height of 3 μm below the surface) and maintained for 120 min. (c) Scale bar = 20 μm. Data are presented as mean ± s.e.m. (n = 12 minimum, ****P < 0.001 t‐test).
Membrane spot localization of the 15 TFs regulated by nuclear shape.
Raw membranes of Affymetrix protein–DNA combo array kit after exposition to the ChemiDoc (Abcam) apparatus.
mRNA expression for corresponding TF's target genes. Using the TRRUST database, we selected genes known to be positively regulated by these 15 TFs and we analyzed their mRNA expression: SPP1 gene for FOXD3; SLC4A9 gene for FOXI1; PCSK9 gene for HNF‐4; AHRR gene for AHR; SOD2 gene for NFE2L2; BAMB1 gene for FOXF2; HBB gene for NFE2L2; PPAR gene for HIF1A; TGFB1 gene for USF1; and FAM89B gene for NFIA. Only genes with increase in mRNA expression superior to 1.5‐fold change in response to nuclear flattening were selected. Data are presented as mean ± s.e.m. (n = 4 minimum, t‐test *P < 0.5; ns: not significant).
Protein–Protein Interaction Network reconstruction and analysis of the AP1, TEAD, SP1, and PPAR.
Cell height was measured using AFM in cells cultured on soft or stiff matrix. Data are presented as mean ± s.e.m. (n = 15 minimum, ****P < 0.001 t‐test).
AP1 activity was measured in cells depleted or not for c‐Jun in Ctrl, Blebb, and Blebb + AP conditions. Data are presented as mean ± s.e.m. (n = 5, ****P < 0.001 one‐way ANOVA—Tukey's multiple comparisons post‐test)
Percentage of EdU‐positive cells for cells depleted or not for c‐Jun and YAP. Data are presented as mean ± s.e.m. (n = 4 independent experiments with at least 60,000 events for each condition). Data have been generated from two independent experiments using two different siRNAs targeting c‐Jun and YAP. ***P < 0.01 one‐way ANOVA—Tukey's multiple comparisons post‐test.
TEAD activity was analyzed in HeLa cells co‐transfected with a Renilla plasmid as a luciferase reporter plasmid controlled by the TEAD‐responsive promoter, and with a Renilla plasmid as a gene reporter; HeLa cells were depleted or not for SUN1 and SUN2. Data are presented as mean ± s.e.m. (n = 6, t‐test *P < 0.5)
AP1 activity was measured in cells depleted or not for SUN1 and SUN2. Data are presented as mean ± s.e.m. (n = 5, ****P < 0.001 t‐test)
mRNA expression for corresponding TF's target genes for HeLa cells depleted or not for SUN1 and SUN2. Data are presented as mean ± s.e.m. (n = 4, t‐test *P < 0.5; **P < 0.1; ***P < 0.01).
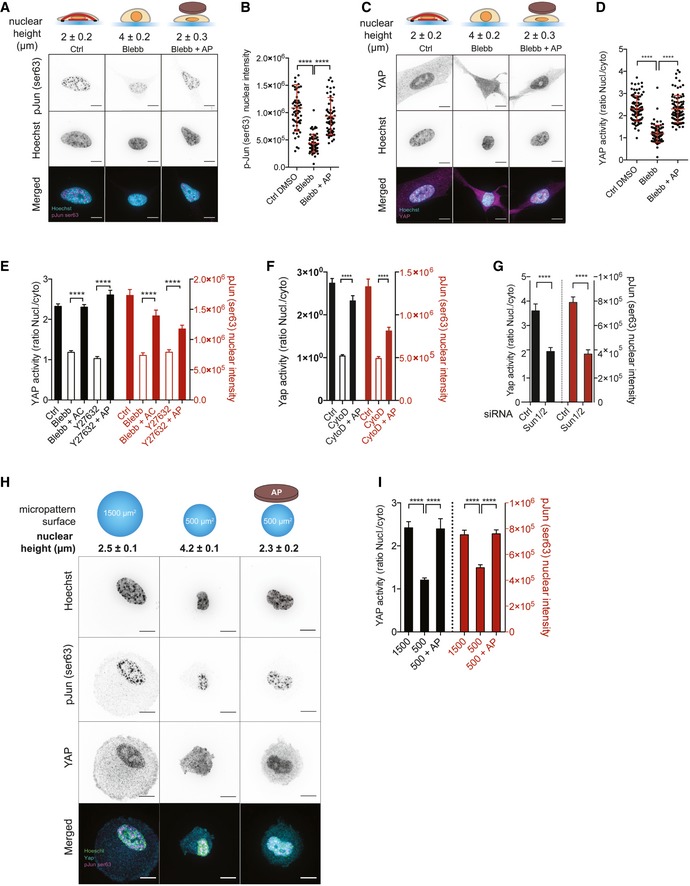
Representative cells stained for p‐Jun Ser63 (magenta) and for DNA (cyan) in Ctrl, Blebb, and Blebb + AP conditions. Scale bar = 10 μm. Nuclear heights were measured using Hoechst staining.
Corresponding quantifications of p‐Jun Ser63 nuclear intensity. Data are presented as mean ± s.e.m. (n = 59 minimum from two independent experiments, ****P < 0.001 one‐way ANOVA—Tukey's multiple comparisons post‐test).
Representative cells stained for YAP (magenta) and for DNA (cyan) in Ctrl, Blebb, and Blebb + AP conditions. Scale bar = 10 μm. Nuclear heights were measured using Hoechst staining.
Corresponding quantifications of YAP activity (ratio nucleus/cytosol). Data are presented as mean ± s.e.m. (n = 82 minimum from four independent experiments, ****P < 0.001 one‐way ANOVA—Tukey's multiple comparisons post‐test).
Quantifications of YAP activity (nucleo‐cytoplasmic ratio) and p‐Jun Ser63 nuclear intensity in Ctrl, Blebb, and Blebb +AC condition and in Ctrl, Y27632, and Y27632 + AP. Data are presented as mean ± s.e.m. (n = 19 minimum, ****P < 0.001 Tukey's multiple comparisons post‐test).
Quantifications of YAP activity (nucleo‐cytoplasmic ratio) and p‐Jun Ser63 nuclear intensity in Ctrl, cytochalasin D (CytoD), and CytoD + AP condition. Data are presented as mean ± s.e.m. (n = 32 minimum from two independent experiments, ****P < 0.001 Tukey's multiple comparisons post‐test).
Quantifications of YAP activity (nucleo‐cytoplasmic ratio) and p‐Jun Ser63 nuclear intensity in cells depleted or not for SUN1 and SUN2. Data are presented as mean ± s.e.m. (n = 28 minimum, t‐test, ****P < 0.001).
Representative cells cultured on circular micropatterns with surfaces of 1,500 and 500 μm2 and stained for p‐Jun Ser63 (magenta), for YAP (cyan), and for DNA (green). Additionally, cells were cultured on the micropatterns of 500 μm2 and an agarose pad was used to flatten their nuclei. Scale bar = 10 μm. Nuclear heights were measured using Hoechst staining.
Corresponding quantifications of YAP activity (nucleo‐cytoplasmic ratio) and p‐Jun Ser63 nuclear intensity. Data are presented as mean ± s.e.m. (n = 15 minimum ****P < 0.001 one‐way ANOVA—Tukey's multiple comparisons post‐test).
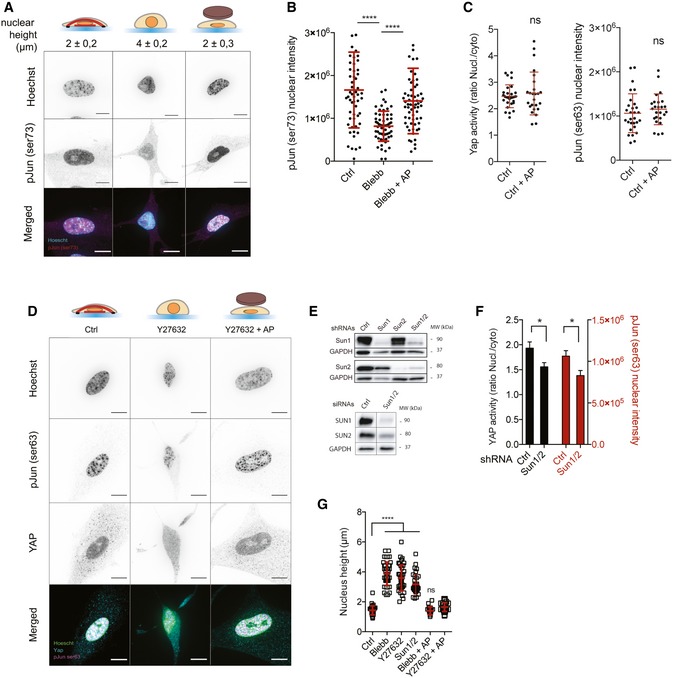
Representative cells stained for p‐Jun Ser73 (magenta) and for nucleus (cyan) in Ctrl, Blebb, and Blebb + AP conditions. Scale bar = 10 μm. Nuclear heights were measured using Hoechst staining.
Corresponding quantifications of p‐Jun Ser73 nuclear intensity. Data are presented as mean ± s.e.m. (n = 58 minimum from two independent experiments, ****P < 0.001 one‐way ANOVA—Tukey's multiple comparisons post‐test).
Quantifications of YAP activity (nucleo‐cytoplasmic ratio) and p‐Jun Ser63 nuclear intensity in Ctrl and Ctrl + AP conditions. Data are presented as mean ± s.e.m. (n = 25 minimum, ns: not significant, t‐test).
Representative cells stained for p‐Jun Ser63 (magenta) and for DNA (cyan) in Ctrl, Y27632, and Y27632 + AP conditions. Scale bar = 10 μm.
Immunoblots of SUN1, SUN2, and GADPH for MRC5 cells depleted or not for SUN1, SUN2, and SUN1 and SUN2 using siRNA or shRNA approaches.
Quantifications of YAP activity (nucleo‐cytoplasmic ratio) and p‐Jun Ser63 nuclear intensity in cells depleted or not for SUN1 and SUN2. Data are presented as mean ± s.e.m. (n = 20 minimum, t‐test *P < 0.5).
Nucleus heights were measured using Hoechst staining in the indicated conditions. Data are presented as mean ± s.e.m. (n = 18 minimum, ****P < 0.001 one‐way ANOVA—Tukey's multiple comparisons post‐test).
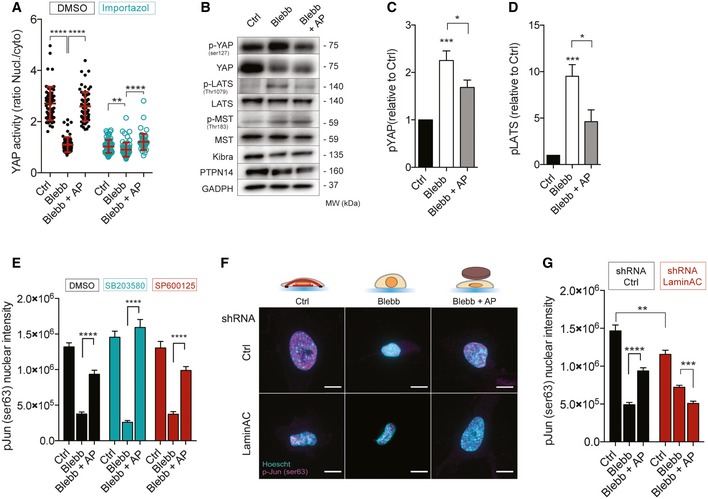
Quantifications of YAP activity in Ctrl, Blebb, and Blebb + AP conditions, treated or not with importazole (nucleo‐cytoplasmic ratio). Data are presented as mean ± s.e.m. (n = 59 minimum from three independent experiments, **P < 0.05, ****P < 0.001 one‐way ANOVA—Tukey's multiple comparisons post‐test).
Immunoblots of p‐YAP (ser127), YAP, p‐LATS (Thr1079), LATS, p‐MST (Thr1083), MST, Kibra, PTPN14, and GADPH for Ctrl, Blebb, and Blebb + AP conditions.
Corresponding quantification of p‐YAP (Ser125) relative to Ctrl and normalized to GAPDH. Data are presented as mean ± s.e.m. (n = 8, *P < 0.5, ***P < 0.01 one‐way ANOVA—Tukey's multiple comparisons post‐test).
Corresponding quantification of p‐LATS (thr1079) relative to Ctrl and normalized to GAPDH. Data are presented as mean ± s.e.m. (n = 6, *P < 0.5, ***P < 0.01 one‐way ANOVA—Tukey's multiple comparisons post‐test).
Quantifications of p‐Jun Ser63 nuclear intensity in Ctrl, Blebb, and Blebb + AP conditions for cells treated with DMSO, SB203580, a MAP Kinase inhibitor, and SP600125, a JNK inhibitor. Data are presented as mean ± s.e.m. (n = 18 minimum, ****P < 0.001 one‐way ANOVA—Tukey's multiple comparisons post‐test.).
Representative cells stained for p‐Jun Ser63 (magenta) and for DNA (cyan) in Ctrl, Blebb, and Blebb + AP conditions for cells depleted or not for lamin A/C. Scale bar = 10 μm.
Corresponding quantification of p‐Jun Ser63 nuclear intensity. Data are presented as mean ± s.e.m. (n = 49 minimum, **P < 0.05, ***P < 0.01, ****P < 0.001 one‐way ANOVA—Tukey's multiple comparisons post‐test).
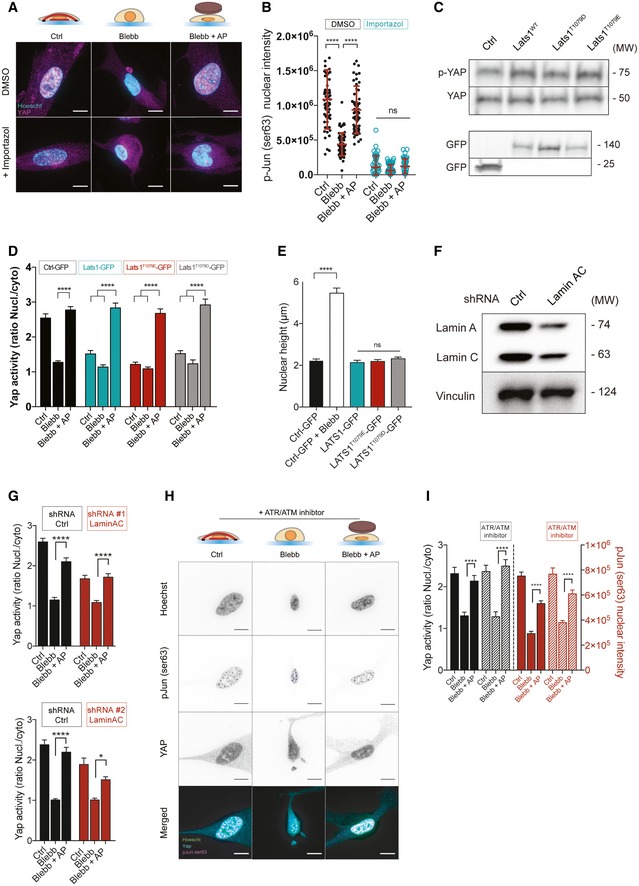
Representative cells stained for p‐Jun Ser63 (magenta) and for DNA (cyan) in Ctrl, Blebb, and Blebb + AP conditions, treated or not with importazole. Scale bar = 10 μm.
Quantifications of p‐ Jun Ser63 nuclear intensity in Ctrl, Blebb, and Blebb + AP conditions, treated or not with importazole. Data are presented as mean ± s.e.m. (n = 44 minimum from two independent experiments, ****P < 0.001 one‐way ANOVA—Tukey's multiple comparisons post‐test).
Immunoblots of p‐YAP (Ser127), YAP, and GFP for HeLa cells transfected with these following plasmids: Ctrl‐GFP, LATS1 WT‐GFP, LATS1T1079E‐GFP, LATS1T1079D‐GFP.
Quantifications of YAP activity (nucleo‐cytoplasmic ratio) in Ctrl, Blebb, and Blebb + AP conditions for cells transfected with GFP, LATS1‐GFP, LATS1T1079E‐GFP, or LATS1T1079D‐GFP. Data are presented as mean ± s.e.m. (n = 18 minimum ****P < 0.001 one‐way ANOVA—Tukey's multiple comparisons post‐test).
Nuclear heights were measured for cells transfected with GFP in Ctrl and Blebb conditions, and for those transfected with LATS1‐GFP, LATS1T1079E‐GFP, LATS1T1079D‐GFP in Ctrl condition. Data are presented as mean ± s.e.m. (n = 18 minimum ****P < 0.001 one‐way ANOVA—Tukey's multiple comparisons post‐test).
Immunoblots of lamin A/C and vinculin for MRC‐5 cells depleted or not for lamin A/C.
Quantification of YAP activity in Ctrl, Blebb, and Blebb + AP conditions for cells depleted or not for lamin A/C. Data are presented as mean ± s.e.m. (n = 48 minimum (TOP), n = 12 minimum (BOTTOM), ****P < 0.001, *P < 0.05 one‐way ANOVA—Tukey's multiple comparisons post‐test).
Representative cells stained for p‐Jun Ser63 (magenta), for YAP (cyan), and for DNA (green) treated with ATR/ATM inhibitor. Scale bar = 10 μm.
Quantifications of p‐Jun Ser63 nuclear intensity in Ctrl, Blebb, and Blebb + AP conditions for cells treated with an ATR/ATM inhibitor. Data are presented as mean ± s.e.m. (n = 30, ****P < 0.001 one‐way ANOVA—Tukey's multiple comparisons post‐test.).
References
-
- Huang S, Ingber DE (1999) The structural and mechanical complexity of cell‐growth control. Nat Cell Biol 1: E131–E138 - PubMed
-
- Chan CJ, Heisenberg C‐P, Hiiragi T (2017) Coordination of Morphogenesis and Cell‐Fate Specification in Development. Curr Biol 27: R1024–R1035 - PubMed
-
- Folkman J, Moscona A (1978) Role of cell shape in growth control. Nature 273: 345–349 - PubMed
Publication types
MeSH terms
Substances
Grants and funding
- P30 DK034987/DK/NIDDK NIH HHS/United States
- UNC|UNC-CH|Lineberger Comprehensive Cancer Center, University of North Carolina at Chapel Hill (UNC Lineberger Comprehensive Cancer Center)/International
- ERC Starting Grant 639300/EC|H2020|H2020 Priority Excellent Science|H2020 European Research Council (ERC)/International
- ANR-13-JSV1-0008/Agence Nationale de la Recherche (ANR)/International
- NIH P30 DK034987/UNC|UNC-CH|UNC School of Medicine|Center for Gastrointestinal Biology and Disease, School of Medicine, University of North Carolina at Chapel Hill (CGIBD)/International
LinkOut - more resources
Full Text Sources
Other Literature Sources
Research Materials
Miscellaneous
