Case Reports
. 2019 Aug 1:8:e48051.
doi: 10.7554/eLife.48051.

Multiplexed imaging of immune cells in staged multiple sclerosis lesions by mass cytometry

Affiliations
Case Reports

Multiplexed imaging of immune cells in staged multiple sclerosis lesions by mass cytometry

Valeria Ramaglia et al. Elife. .

Abstract

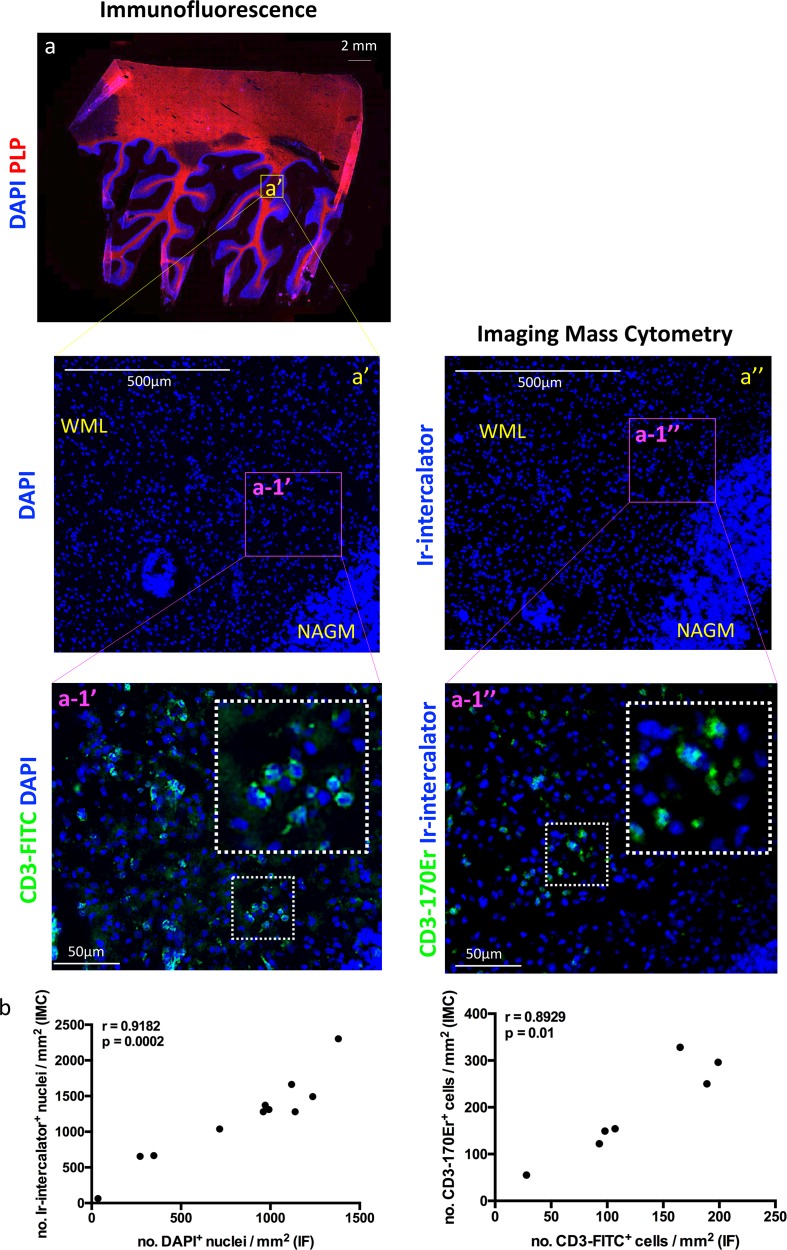
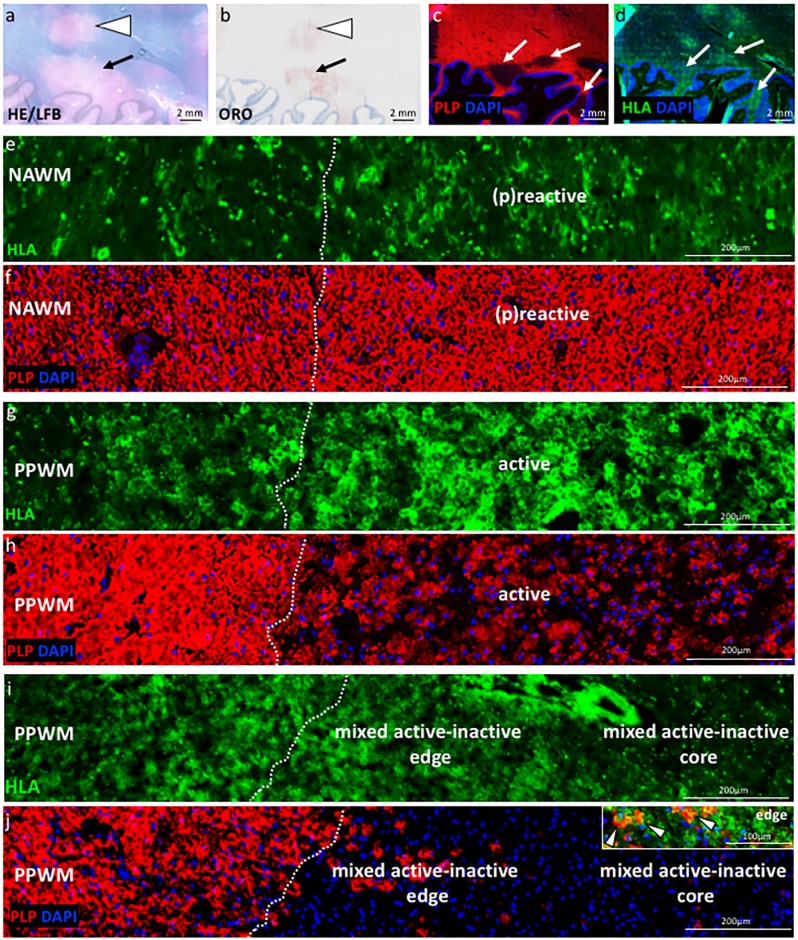
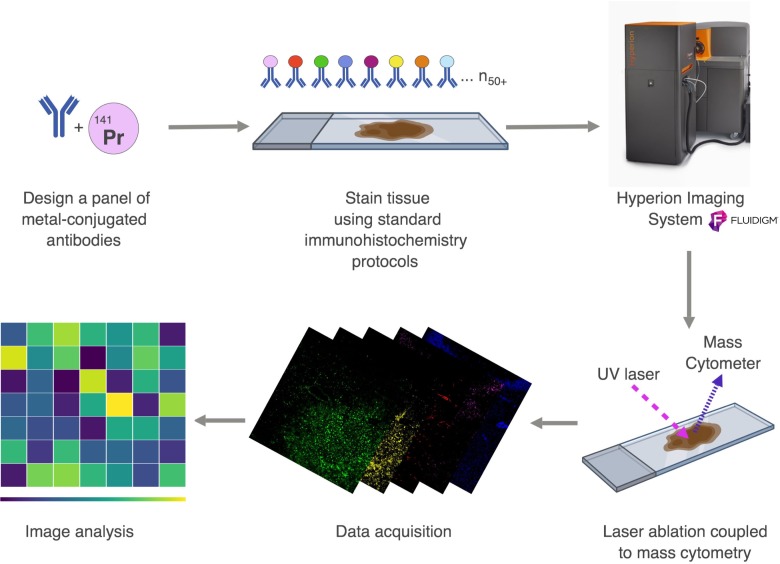
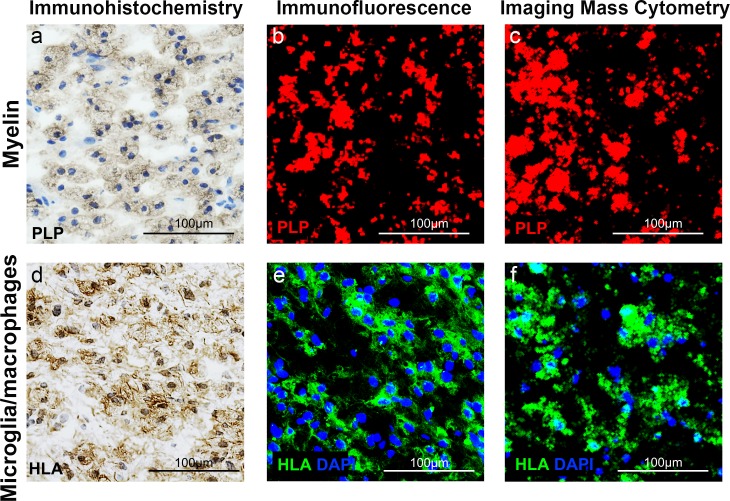
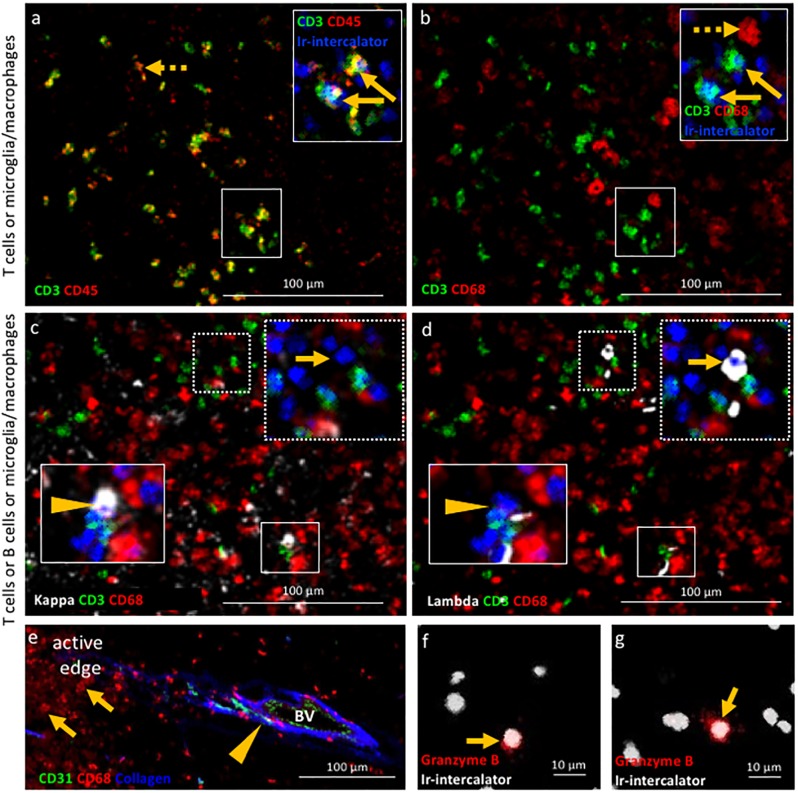
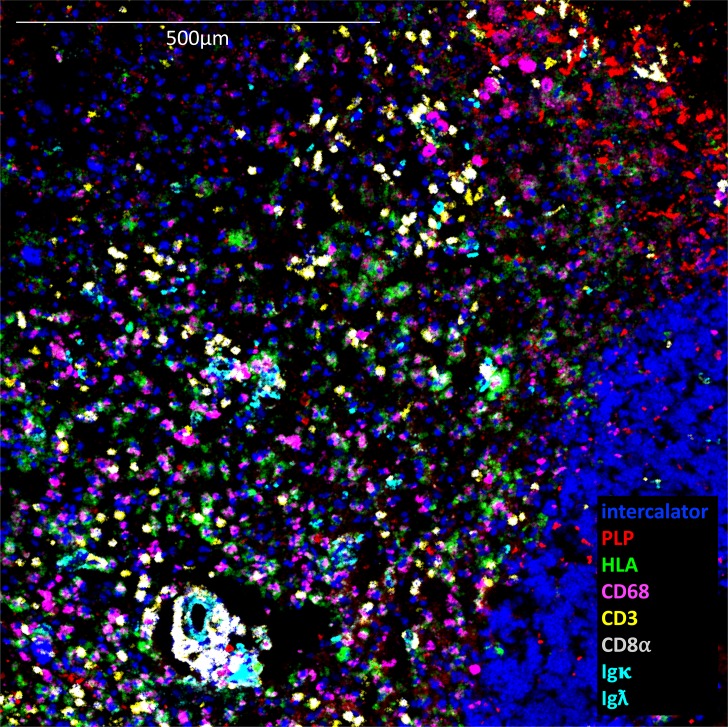
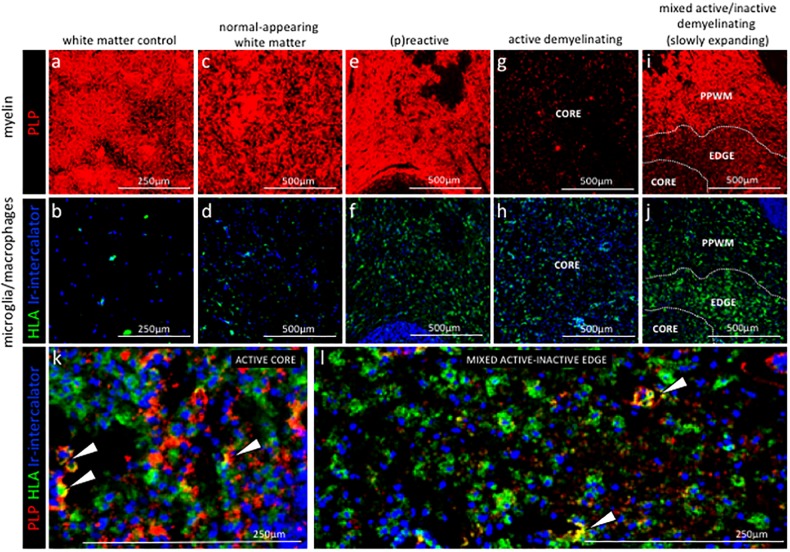
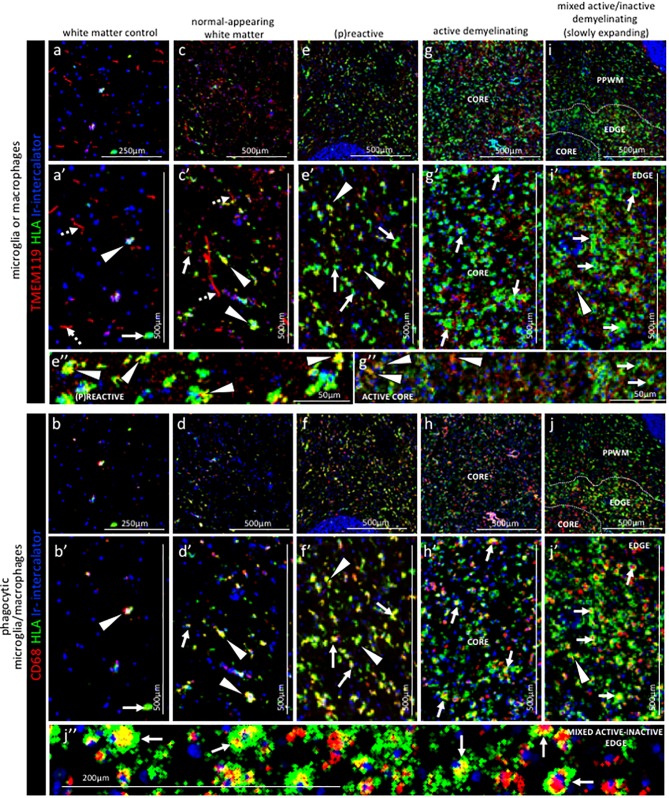
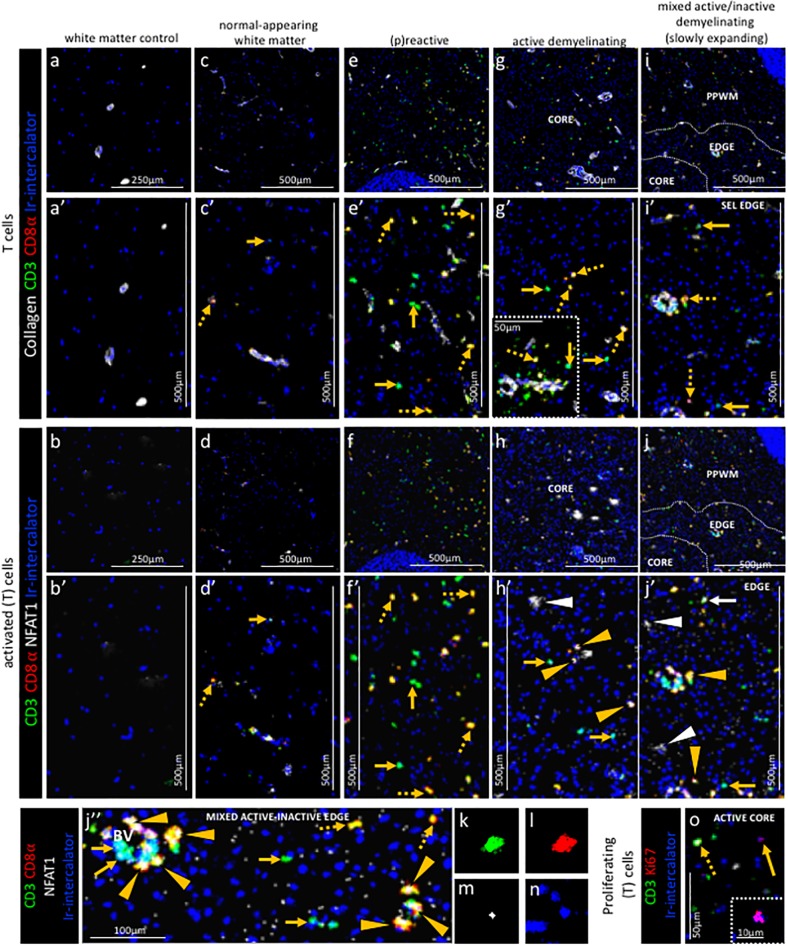
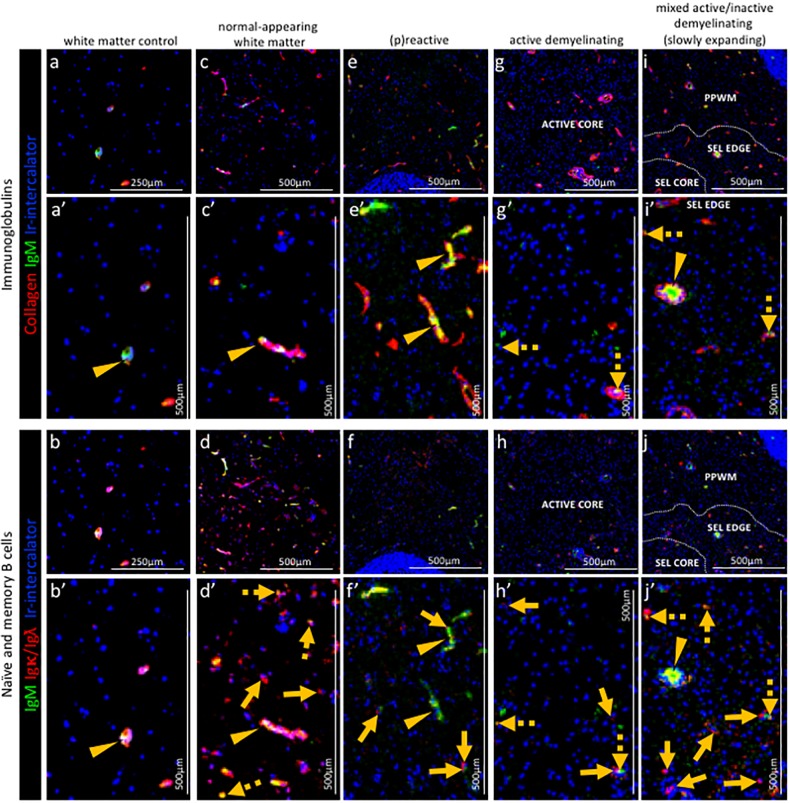
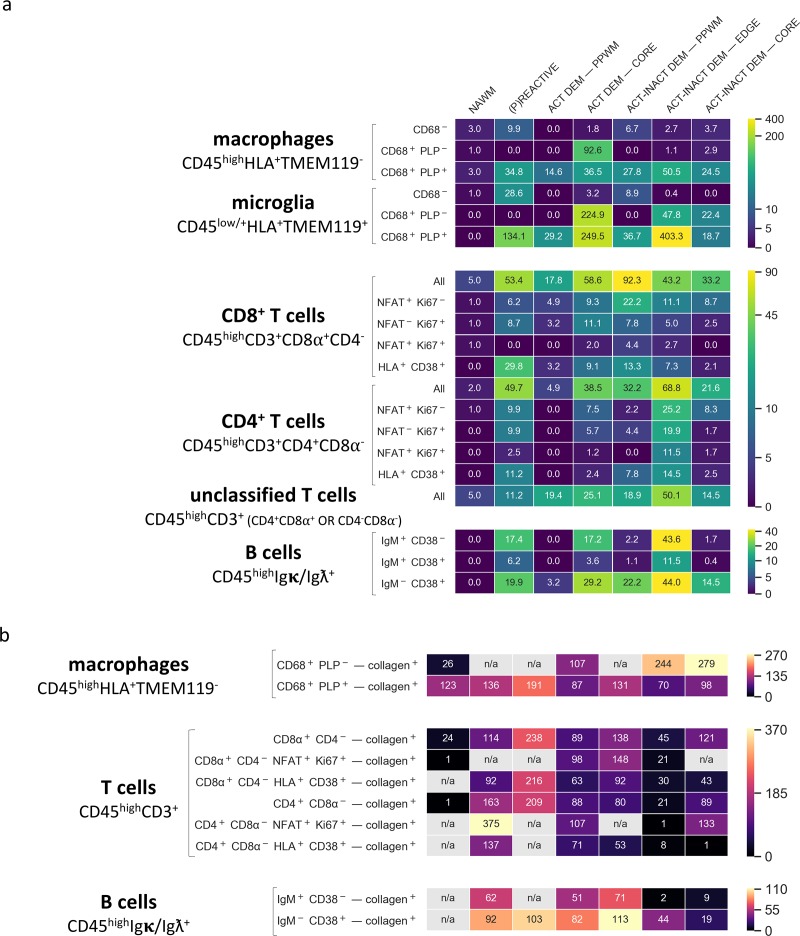
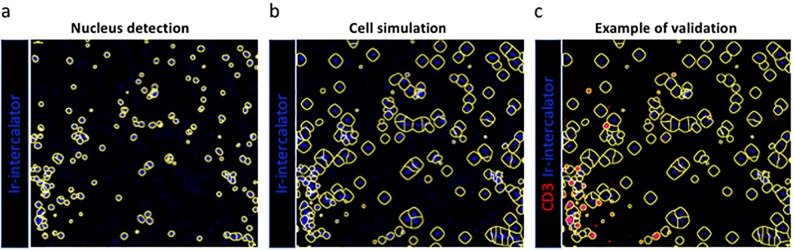
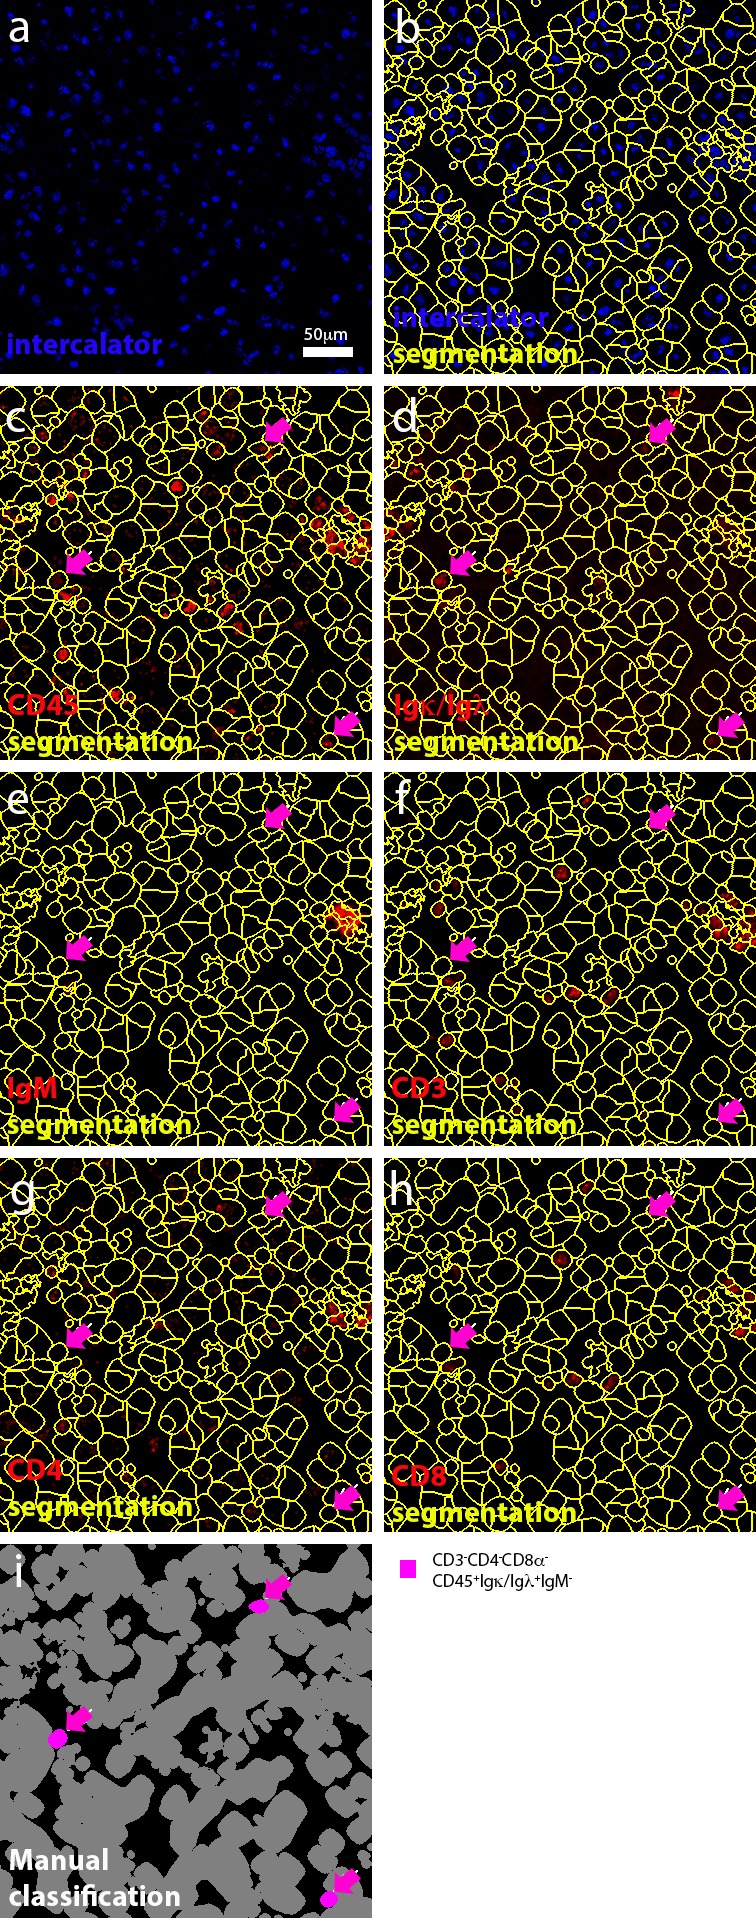
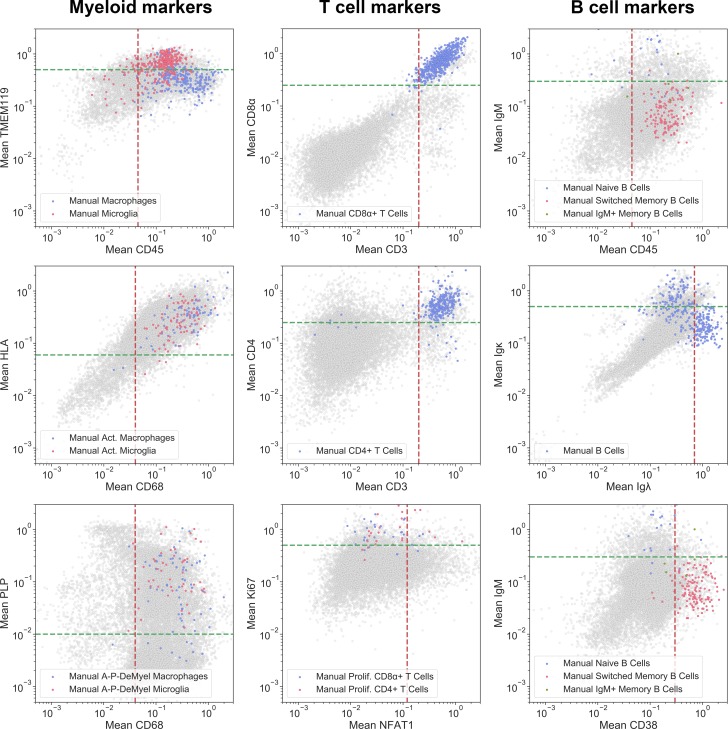
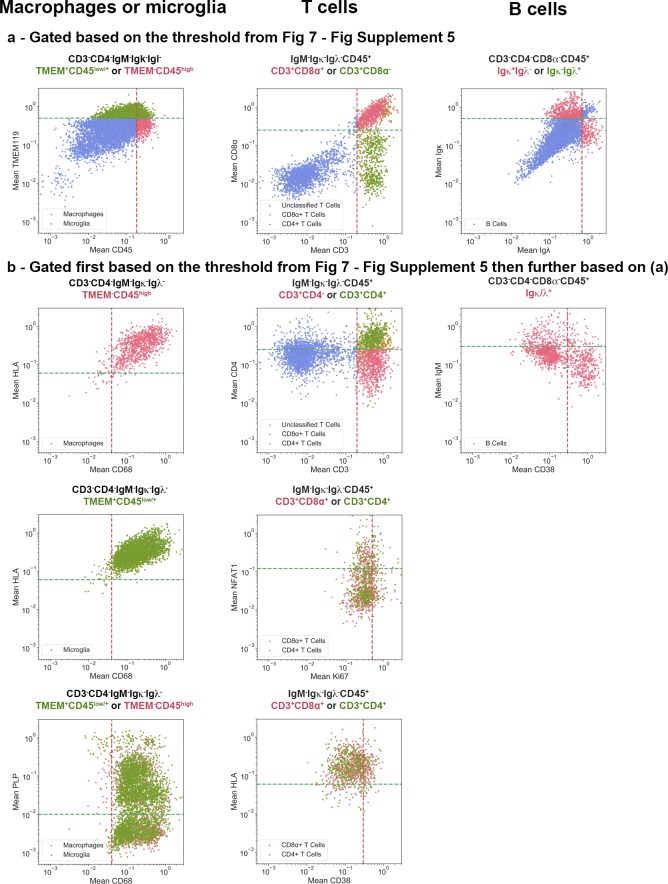
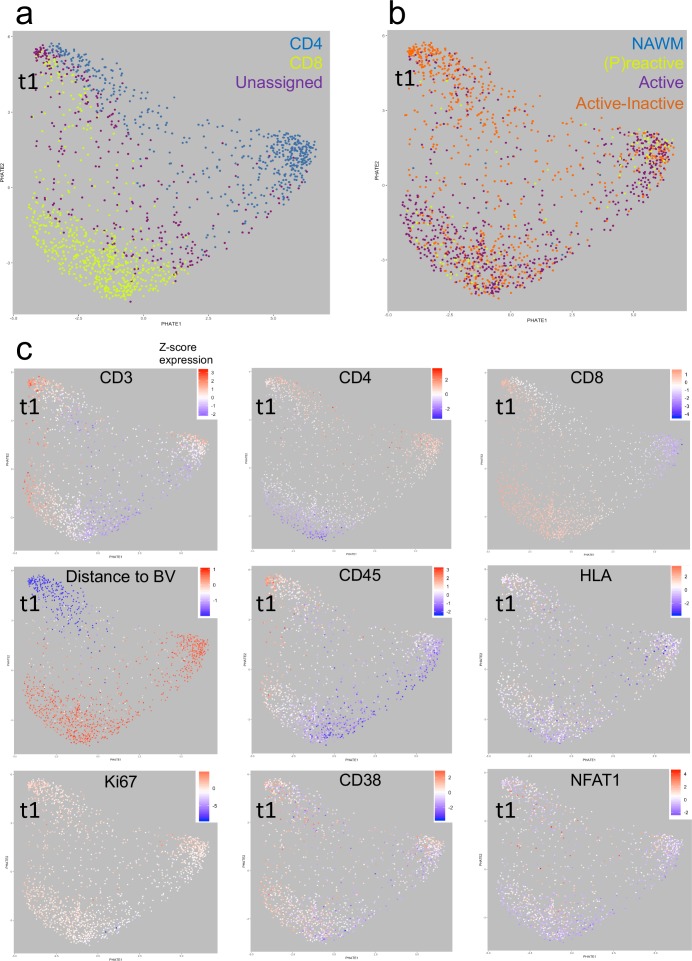
Multiple sclerosis (MS) is characterized by demyelinated and inflammatory lesions in the brain and spinal cord that are highly variable in terms of cellular content. Here, we used imaging mass cytometry (IMC) to enable the simultaneous imaging of 15+ proteins within staged MS lesions. To test the potential for IMC to discriminate between different types of lesions, we selected a case with severe rebound MS disease activity after natalizumab cessation. With post-acquisition analysis pipelines we were able to: (1) Discriminate demyelinating macrophages from the resident microglial pool; (2) Determine which types of lymphocytes reside closest to blood vessels; (3) Identify multiple subsets of T and B cells, and (4) Ascertain dynamics of T cell phenotypes vis-à-vis lesion type and location. We propose that IMC will enable a comprehensive analysis of single-cell phenotypes, their functional states and cell-cell interactions in relation to lesion morphometry and demyelinating activity in MS patients.

Keywords: human; imaging mass cytometry; immunology; immunopathology; inflammation; lesions; multiple sclerosis.


Conflict of interest statement

VR received a consulting honorarium from EMD Serono, SS, KL, CP, OR, SZ, FF, DP, AP, TM No competing interests declared, OO, ES is an employee of Fluidigm Inc, JG is a consultant for Roche (Canada) and currently holds grants with Novartis, EMD Serono and Roche

Figures

Figure 1.
Figure 1.. Comparing IMC to IF in MS lesions.
Two serial sections were assessed: one used for immunofluorescence (IF, a and a’) and one dedicated to Imaging Mass Cytometry (IMC, a’’). (a) The region of interest (a’) was guided by the immunofluorescence staining with anti-PLP (proteolipid protein, shown in red to visualize myelin), and DAPI (shown in blue to visualize nuclei) for the identification of lesion location and type (see Figure 1—figure supplement 1). The entire region of interest on a serial section was subjected to IMC, according to the work flow shown in Figure 1—figure supplement 2. Staining with Iridium (Ir)-intercalator is shown in blue to visualize DNA in nuclei. A blow up area of the region of interest within an active lesion (referred to as a-1’ for IF and a-1’’ for IMC), was also stained with fluorochrome conjugated anti-CD3 (a-1’) or metal conjugated anti-CD3 (a-1’), both depicted in green. WML, white matter lesion; NAGM, normal-appearing gray matter. (b) Spearman correlation coefficient, showing a significant positive correlation between the number of nuclei identified with DAPI by IF and the number of nuclei identified with Ir-intercalator by IMC (n = 11, coefficient, r = 0.9182, p=0.0002). (c) Spearman correlation coefficient, showing a significant positive correlation between the number of CD3+ T cells identified with fluorochrome-conjugated antibody by IF and the number of CD3+ T cells identified with metal-conjugated antibody by IMC (n = 7, coefficient, r = 0.8929, p=0.01). Additional correlation analyses between fluorochrome-conjugated antibodies by IF and metal-conjugated antibodies by IMC are shown in Figure 1—figure supplement 4.
Figure 1—figure supplement 1.
Figure 1—figure supplement 1.. Staging of MS lesions by IF.
General pathology: demyelinating lesions (arrows and arrows head in (a and b) seen in (a) hematoxylin and eosin (HE)/Luxol fast blue (LFB) stain of myelin and (b) oil red o (ORO) stain of neutral lipids within macrophages. Lesional pathology: demyelinating lesions (arrows in c and d) visualized by (c) proteolipid protein (PLP in red) stain of myelin and (d) human leukocyte antigen (HLA, in green) stain of microglia/macrophages. (e–j) Low magnification images of HLA and PLP stains, depicting the distribution and morphology of HLA+ microglia/macrophages and myelin in different sites and lesion stages. (e–f) (P)reactive lesion (block no. CR4A): Note the increase in microglia/macrophage reactivity at the (p)reactive lesion site compared to the normal-appearing white matter (NAWM), with normal-appearing PLP myelin stain seen (e) across the NAWM and (f) (p)reactive lesion. (g–h) Active demyelinating lesion (block no. CR4A): low glia reactivity and normal-appearing myelin stain is seen in the periplaque white matter (PPWM). Profound microglia/macrophage activation is seen (g) in the active lesion, where (h) myelin is being destroyed. (i–j) Mixed active-inactive demyelinating lesion (block no. CL3A): low glia reactivity and normal-appearing myelin stain is seen in the periplaque white matter (PPWM). An increased density of HLA+ cells with the morphology of microglia/macrophages is seen at the active lesion edge, with degraded PLP+ myelin within macrophages (arrows head in inset). In contrast, there are only few HLA+ cells at the inactive lesion core.
Figure 1—figure supplement 2.
Figure 1—figure supplement 2.. Workflow of Imaging Mass Cytometry.
A panel is designed using pathologist-verified antibodies conjugated to metals. The brain tissue is stained simultaneously with a cocktail of all the metal-conjugated antibodies and placed into the Hyperion Imaging System. The tissue is ablated by a UV laser beam (λ = 219 nm). A plume of particles produced by the laser is taken up by a flow of inert helium or argon gas and introduced into the CyTOF mass cytometer (Hyperion Imaging System from Fluidigm (formerly DVS Sciences)). Isotopes associated with each spot are detected and indexed against the source location, yielding an intensity map of the target proteins throughout the tissue, creating spatially resolved images of multiple parameters. The acquired data are analyzed and visualized using heat maps.
Figure 1—figure supplement 3.
Figure 1—figure supplement 3.. Validation of IMC staining patterns in MS lesions.
Core of an active demyelinating lesion, showing reduced proteolipid protein (PLP) stain by (a) immunohistochemistry, (b) immunofluorescence and (c) imaging mass cytometry and corresponding areas stained with anti-HLA to detect antigen presenting cells by (d) immunohistochemistry, (e) immunofluorescence and (f) imaging mass cytometry.
Figure 1—figure supplement 4.
Figure 1—figure supplement 4.. Correlating IMC to IF staining patterns in MS lesions.
(a) Spearman correlation coefficient, showing a significant positive correlation between the % of PLP+ area identified with fluorochrome-conjugated antibody by IF and % of PLP+ area dentified with metal-conjugated antibody by IMC (n = 14, coefficient, r = 0.9544, p<0.0001). (b) Spearman correlation coefficient, showing a significant positive correlation between the number of HLA+ cells identified with fluorochrome-conjugated antibody by IF and the number of HLA+ T cells identified with metal-conjugated antibody by IMC (n = 15, coefficient, r = 0.9794, p<0.0001). (c) Spearman correlation coefficient, showing a significant positive correlation between the number of CD68+ cells identified with fluorochrome-conjugated antibody by IF and the number of CD68+ T cells identified with metal-conjugated antibody by IMC (n = 15, coefficient, r = 0.9051, p<0.0001).
Figure 2.
Figure 2.. Validation of IMC specificity in MS lesions.
(a) Overlay of CD3 (green) and CD45 (red) identifies CD3+CD45+ T cells (solid arrows) and CD3-CD45+ leukocytes other than T cells (dotted arrow). (b) Overlay of CD3 (green) and CD68 (red) identifies CD3+CD68- T cells (solid arrows) and CD3-CD68+microglia/macrophages (dotted arrow). Note that the solid arrows in a and b indicates the same CD3+CD45+CD68- T cells. (c) Overlay of κ (white), CD3 (green) and CD68 (red) and (d) overlay of λ (white), CD3 (green) and CD68 (red) identify κ+CD3-CD68- B cells (arrow head in c) that are λ-CD3-CD68- (arrow head in d) and κ-CD3-CD68- B cells (arrow in c) that are λ+CD3-CD68- (arrow in d), as expected based on the allelic exclusion of κ and λ. (e) Overlay of CD31 (green), CD68 (red) and Collagen (blue) identifies CD31+Collagen+CD68- endothelial cells (arrow head) and CD31-Collagen-CD68+ microglia/macrophages (arrows). (f, g) Granzyme B+ cells (arrows). Images in (a and b) as well as images in c) and d) are from the same areas of an active demyelinating lesion. Image in (e) are from the edge of an active demyelinating lesion. Images in (f and g) are from the center of an active demyelinating lesion.
Figure 2—figure supplement 1.
Figure 2—figure supplement 1.. Example of active lesion in which 8 analytes are displayed simultaneously.
Figure 3.
Figure 3.. Staging of MS lesions by IMC.
Representative mass cytometry images of white matter areas of (a, f) healthy control, (b, g) MS normal-appearing white matter (block no. CR4A), (c, h) MS (p)reactive lesion (block no. CR4A), (d–i) MS active demyelinating lesion (block no. CR4A) and (e–j) an MS mixed active-inactive demyelinating lesion (block no. CL3A). For each region of interest, we show the same area simultaneously labeled with markers of myelin (proteolipid protein, PLP), antigen presentation (human leukocyte antigen, HLA) to detect microglia/macrophages and DNA (intercalator). (a–e) Images of PLP (red) and (f–i) overlay of HLA (green) and intercalator (blue) show the lesion activity in staged MS lesions compared to control white matter and normal-appearing white matter. (k, l) Overlay of PLP, HLA and intercalator show microglia/macrophages containing PLP+ myelin protein in the core of (k) an active lesion and (l) in the edge of a slowly expanding lesion, indicative of demyelinating activity. PPWM, periplaque white matter; BV, blood vessel.
Figure 4.
Figure 4.. Pattern of microglia or macrophage activity in different stages of MS lesions by IMC.
Representative mass cytometry images of (a, a’, b, b’) control white matter, (c, c’, d, d’) normal-appearing white matter (block no. CR4A), (e, e’, f, f’) (p)reactive lesion (block no. CR4A), (g, g’, h, h’) active demyelinating lesion (block no. CR4A) and (i, i’, j, j’) mixed active-inactive demyelinating lesion (block no. CL3A). For each region of interest, we show the same area simultaneously labeled with markers of antigen presentation (human leukocyte antigen, HLA) to detect microglia and/or macrophages, TMEM119 to detect microglia, lysosomes (CD68) to detect phagocytic cells and DNA (Ir-intercalator). (a, a’– i, i’) Overlay of TMEM119 (red), HLA (green) and Ir-intercalator (blue) identifies (dotted arrows in a’ and c’) TMEM119+HLA- resting microglia with thin elongated processes and (arrows head in a’,c’, e’, i’ and e’’) TMEM119+HLA+ activated microglia or (solid arrows in a’, c’, e’, g’, i’ and g’’) TMEM119-HLA+ activated macrophages. (b, b’–j, j’’) Overlay of CD68 (red), HLA (green) and Ir-intercalator (blue) identifies HLA+CD68+ phagocytic microglia/macrophages. PPWM, periplaque white matter; BV, blood vessel.
Figure 5.
Figure 5.. Pattern of T cell subpopulations in different stages of MS lesions by IMC.
Representative mass cytometry images of (a, a’, b, b’) white matter of control, (c, c’, d, d’) normal-appearing white matter (block no. CR4A), (e, e’, f, f’) (p)reactive lesion (block no. CR4A), (g, g’, h, h’, o) active demyelinating lesion (block no. CR4A) and (i, i’, j–n) mixed active-inactive demyelinating lesion (block no. CL3A). For each region of interest, we show the same area simultaneously labeled with anti-collagen antibodies to visuzliae blood vessels, all T cells (CD3), CD8α T cells, cell proliferation (Ki67) and DNA (Ir-intercalator). (a, a’– i, i’) Overlay of collagen (white), CD3 (green), CD8α (red) and Ir-intercalator (blue) identifies (dotted arrows in c’, e’, g’ and i’) CD3+CD8α+ T cells, (solid arrows in c’, e’, g’ and i’) CD3+CD8α- (therefore by exclusion putative CD4+) T cells and collagen+ blood vessels. (b–b’–j, j’’) Overlay of CD3 (in green), CD8α (red), NFAT1 (in white) and Ir-intercalator (in blue) identifies (yellow arrow head in h’, j’ and j’’) CD3+CD8α+NFAT1+ T cells and (white solid arrow in j’) CD3+CD8α-NFAT1+ (putative CD4+) T cells. (white arrow head in h’ and j’) CD3-CD8α-NFAT1+ cells are also detected. (o) Overlay of CD3 (in green), Ki67 (red) and Ir-intercalator (in blue) identifies CD3+Ki67+ proliferating T cells (dotted arrow) and CD3-Ki67+ proliferating cells other than T cells (solid arrows and inset). PPWM, periplaque white matter.
Figure 6.
Figure 6.. Pattern of immunoglobulins and B cell subpopulations in different stages of MS lesions by IMC.
Representative mass cytometry images of (a, a’, b, b’) white matter of control, (c, c’, d, d’) normal-appearing white matter (block no. CR4A), (e, e’, f, f’) a (p)reactive lesion (block no. CR4A), (g, g’, h, h’, o) an active demyelinating lesion (block no. CR4A) and (i, i’, j–n) a mixed active-inactive demyelinating lesion (block no. CL3A). For each region of interest, we show the same area simultaneously labeled with markers of endothelial cells (collagen) to detect blood vessels, immunoglobulin M (IgM), the κ or λ light chain of immunoglobulins (Igκ/Igλ) to detect B cells and DNA (Ir-intercalator). (a, a–i, i’) Overlay of collagen (red), IgM (green) and Ir-intercalator (blue) identifies cellular (intercalator-associated, dotted arrows in g’ and i’) and non-cellular (free immunoglobulin, arrows head in a’, c’, e’, i’) IgM in the parenchyma or within collagen+ blood vessels. (b, b’–j, j’) Overlay of IgM (green), Igκ/Igλ (red) and Ir-intercalator (blue) identifies (dotted arrow in d’, h’ and j’) Igκ/Igλ+IgM+ naïve and IgM memory B cells and (solid arrows in d’, f’, h’ and j’) Igκ/Igλ+IgM- class switch B cells.
Figure 7.
Figure 7.. Density of immune cell subsets in different stages of MS lesions and their distance from blood vessels by IMC.
(a) Cell counts are provided as number of cells per mm2 (Barnett and Prineas, 2004) of region of interest. The category of cells is defined according to the expression of cell-specific and functional markers as indicated and also described in Table 2. (b) Distance between defined categories of cells and blood vessels (collagen+) are provided in μm. NAWM, normal-appearing white matter; PPWM, periplaque white matter; Act dem, active demyelinating; act inact dem, active-inactive demyelinating. The single-cell segmentation strategy is shown in Figure 7—figure supplement 1. The Positive and negative ‘gates’ used to identify each cell subset were established based on the quadrants defined by manually-identified cells according to the pipeline shown in Figure 7—figure supplements 2–4 and laid out in Figure 7—figure supplement 5. Please see the section ‘Gating strategy for quantitative analysis of T cell, B cell, macrophage and microglial cell subsets’ in the Materials and methods. The gating strategy used for the generation of heat maps is laid out in Figure 7—figure supplement 6. Source files used for the quantitative analysis are provided in Figure 7—source data 1.
Figure 7—figure supplement 1.
Figure 7—figure supplement 1.. Single cell segmentation and validation of approach using anti-CD3.
A Gaussian blur was applied to the DNA signal (nucleus detection - a), and the resulting blurred image was segmented to identify nuclear content corresponding to individual cell areas using a combination of threshold and watershed filters (cell simulation - b). Subsequently, we interrogated the segmented image for the presence of specific markers or combinations of markers that are either biologically co-expressed, or whose expression is mutually exclusive. In this example we show CD3 (example of validation - c).
Figure 7—figure supplement 2.
Figure 7—figure supplement 2.. Manual selection of myeloid cells.
(a) Representation of manually-annotated cells in an active lesion, based on the detection of nuclei. (b) Segmented cells. (c–h) Identification of cells that express (for example CD45+HLA+) or do not express (for example Igκ/Igλ-CD3-) a biologically relevant set of markers. (i) Classification of myeloid cells. Purple arrows were used throughout (c–i) to track myeloid cells.
Figure 7—figure supplement 3.
Figure 7—figure supplement 3.. Manual selection of T cells.
(a) Representation of manually-annotated cells in an active lesion, based on the detection of nuclei. (b) Segmented cells. (c–h) Identification of cells that express (for example CD45+CD3+CD4+ or CD8+) or do not express (for example Igκ/Igλ-) a biologically relevant set of markers. (i) Classification of T cells. Red arrows were used throughout (c–i) to track CD8+ T cells. Green arrows were used throughout c–i) to track CD4+ T cells. Cyan arrows were used throughout (c–i) to track CD4+ proliferating T cells.
Figure 7—figure supplement 4.
Figure 7—figure supplement 4.. Manual selection of B cells.
(a) Representation of manually-annotated cells in a mixed active-inactive lesion, based on the detection of nuclei. (b) Segmented cells. (c–h) Identification of cells that express (for example CD45+Igκ/Igλ+) or do not express (for example CD3-CD4-CD8-) a biologically relevant set of markers. (i) Classification of B cells. Magenta arrows were used throughout c–i) to track B cells.
Figure 7—figure supplement 5.
Figure 7—figure supplement 5.. Gating strategy used for the identification of cell subsets.
Gating strategy for the identification of cell subset phenotypes and activation states of microglia, macrophages, T cells and B cells. In brief, the per-cell mean intensities of specific marker combinations are shown here in 2D log-log biaxial scatterplots. Gates were established based on pathologist-verified positive cells (see colored cells superimposed into each dotplot contrasting with non-verified cells in gray).
Figure 7—figure supplement 6.
Figure 7—figure supplement 6.. Gating strategy used for the generation of heat maps.
Using the quadrants that capture the appropriate positivity range of each cell phenotype shown in Figure 7—figure supplement 5, cells were subjected to the positive and negative gating strategies as outlined in the Materials and methods for each lineage and indicated in (a). Subsequently, these cells were plotted for the marker combinations listed in Table 2. The frequency of cells in each quadrant are indicated. Note that some CD3+CD45+ T cells could not be classified because they fell outside of the specified gates for either of the two markers – CD8+ cells that were not simultaneously CD4-, or CD4+ cells that were not simultaneously CD8-. This is due to the dynamic range of these particular markers and thus our inability to get a clean CD4+CD8- or CD4-CD8+ T cell population. Cells that fulfilled the gating criteria specified above each image, but which did not fulfill the requirements for classification as Macrophages, Microglia, B cells or T cells, are shown in blue.
Figure 8.
Figure 8.. Heat-diffusion Affinity-based Transition Embedding (PHATE) mapping of T cells.
(a–c) PHATE plots of all T cells analyzed in this study, colored by (a) cell class, (b) lesion type of residence and (c) relative marker expression intensity or distance to blood vessels. The heatmap scales in (c) represent the range of Z-score normalized values for a given parameter. NAWM = normal appearing white matter; BV = blood vessels; t1 = identified T cell cluster (see text for explanation).

References

    1. Alvarez JI, Saint-Laurent O, Godschalk A, Terouz S, Briels C, Larouche S, Bourbonnière L, Larochelle C, Prat A. Focal disturbances in the blood-brain barrier are associated with formation of neuroinflammatory lesions. Neurobiology of Disease. 2015;74:14–24. doi: 10.1016/j.nbd.2014.09.016. - DOI - PubMed
    1. Bandura DR, Baranov VI, Ornatsky OI, Antonov A, Kinach R, Lou X, Pavlov S, Vorobiev S, Dick JE, Tanner SD. Mass cytometry: technique for real time single cell multitarget immunoassay based on inductively coupled plasma time-of-flight mass spectrometry. Analytical Chemistry. 2009;81:6813–6822. doi: 10.1021/ac901049w. - DOI - PubMed
    1. Barnett MH, Prineas JW. Relapsing and remitting multiple sclerosis: pathology of the newly forming lesion. Annals of Neurology. 2004;55:458–468. doi: 10.1002/ana.20016. - DOI - PubMed
    1. Bendall SC, Simonds EF, Qiu P, Amir el-AD, Krutzik PO, Finck R, Bruggner RV, Melamed R, Trejo A, Ornatsky OI, Balderas RS, Plevritis SK, Sachs K, Pe'er D, Tanner SD, Nolan GP. Single-cell mass cytometry of differential immune and drug responses across a human hematopoietic continuum. Science. 2011;332:687–696. doi: 10.1126/science.1198704. - DOI - PMC - PubMed
    1. Bennett ML, Bennett FC, Liddelow SA, Ajami B, Zamanian JL, Fernhoff NB, Mulinyawe SB, Bohlen CJ, Adil A, Tucker A, Weissman IL, Chang EF, Li G, Grant GA, Hayden Gephart MG, Barres BA. New tools for studying microglia in the mouse and human CNS. PNAS. 2016;113:E1738–E1746. doi: 10.1073/pnas.1525528113. - DOI - PMC - PubMed

Publication types