

Transcriptional profiling of intramembranous and endochondral ossification after fracture in mice
- PMID: 31369916
- PMCID: PMC6708791
- DOI: 10.1016/j.bone.2019.07.022
Transcriptional profiling of intramembranous and endochondral ossification after fracture in mice
Abstract
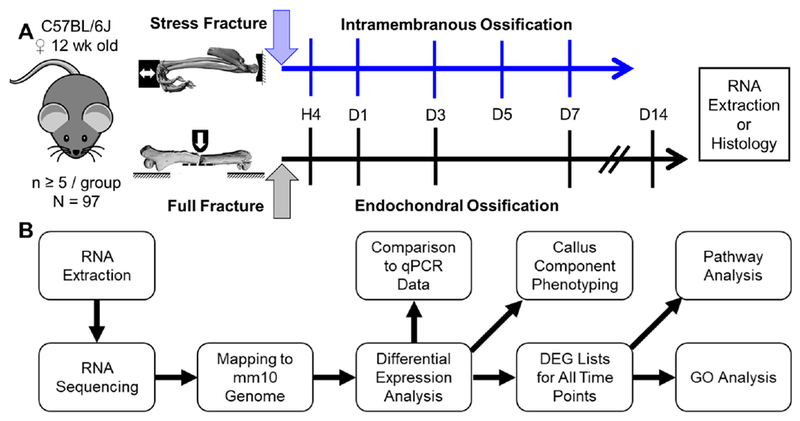
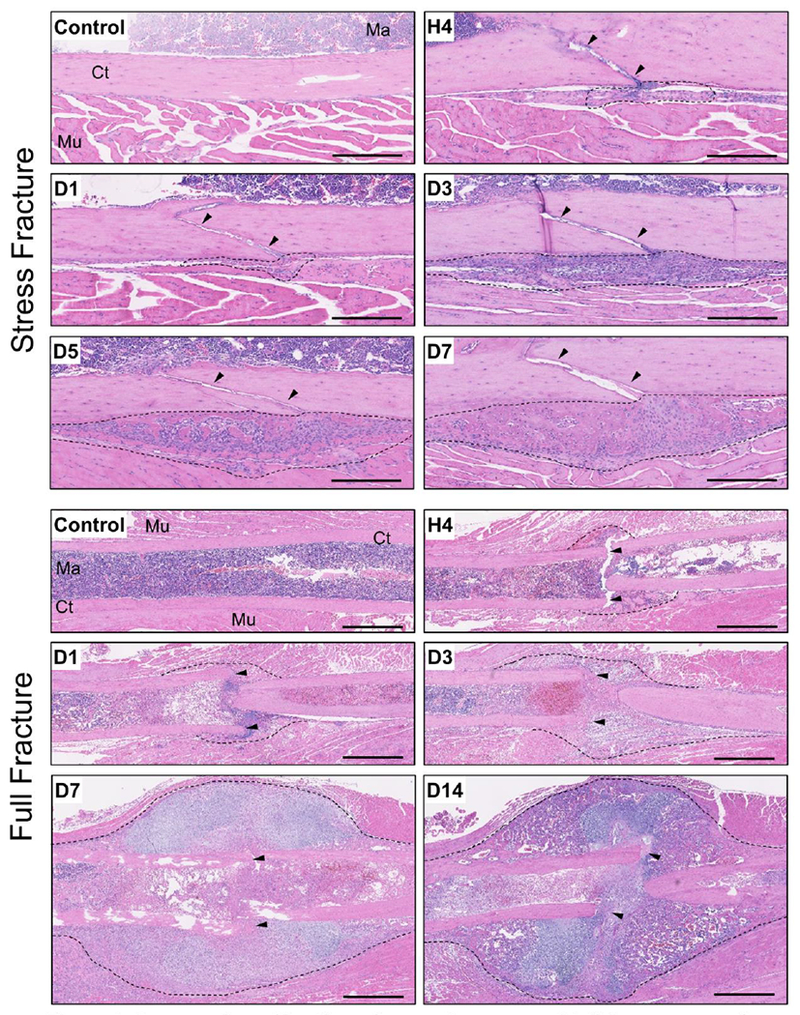
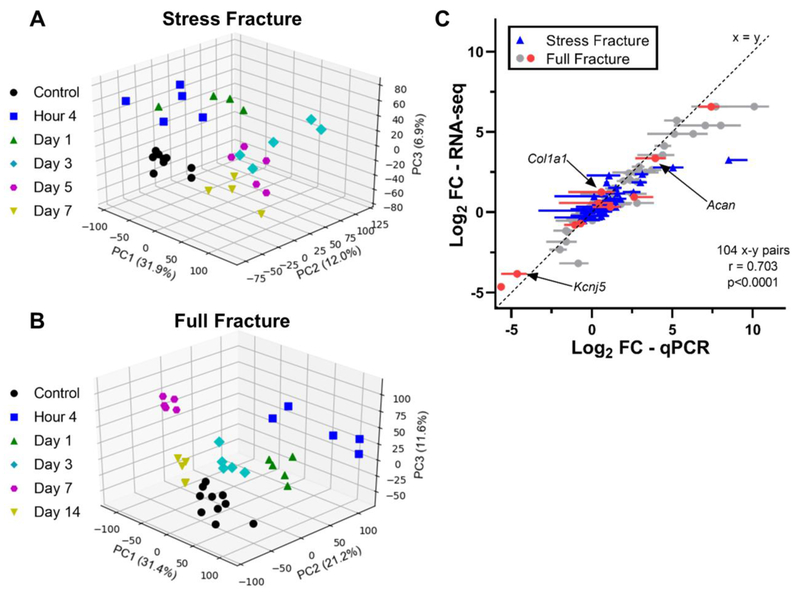
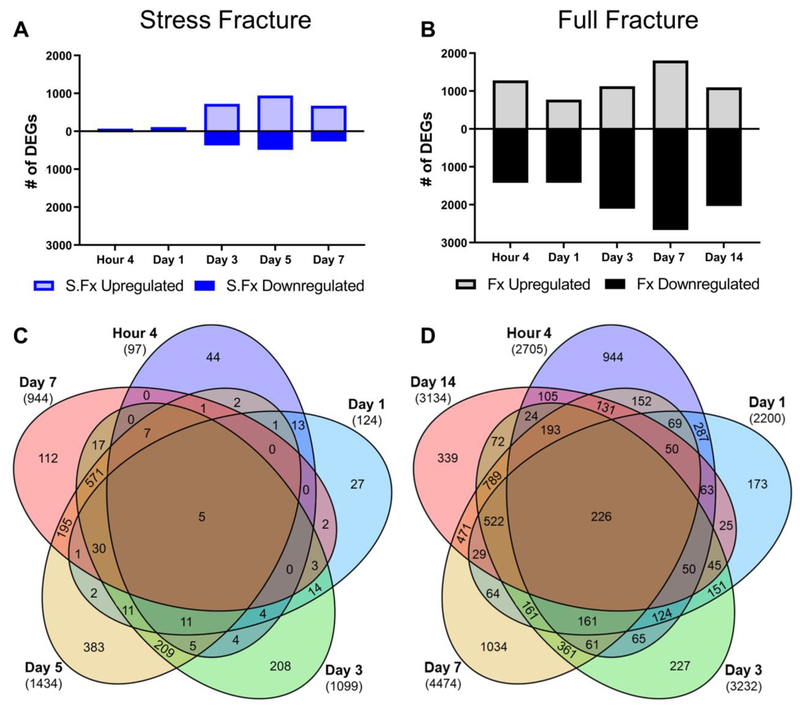
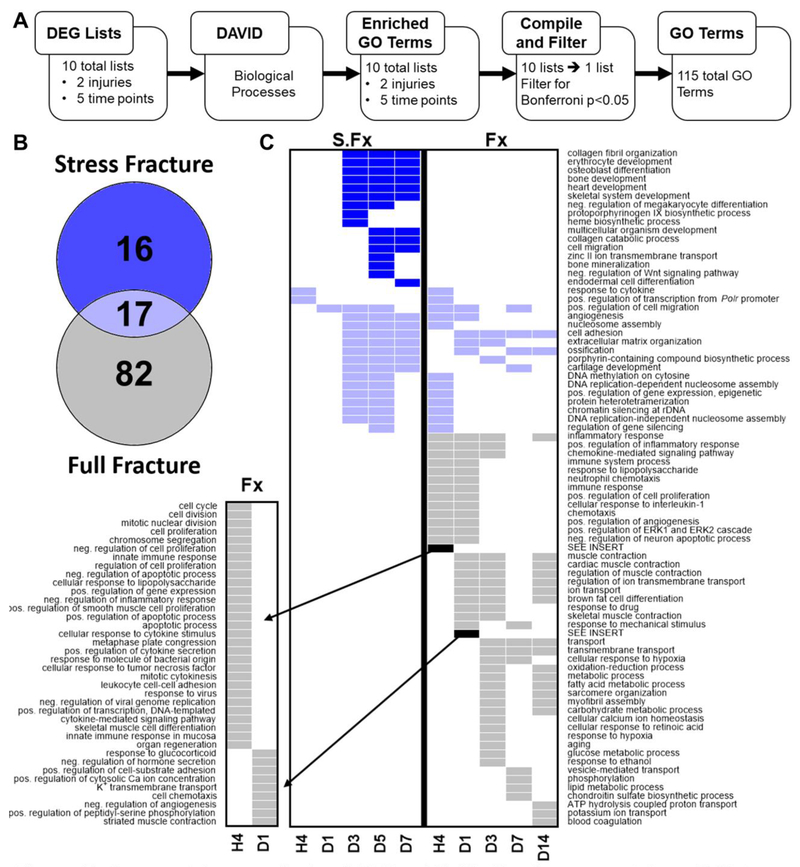
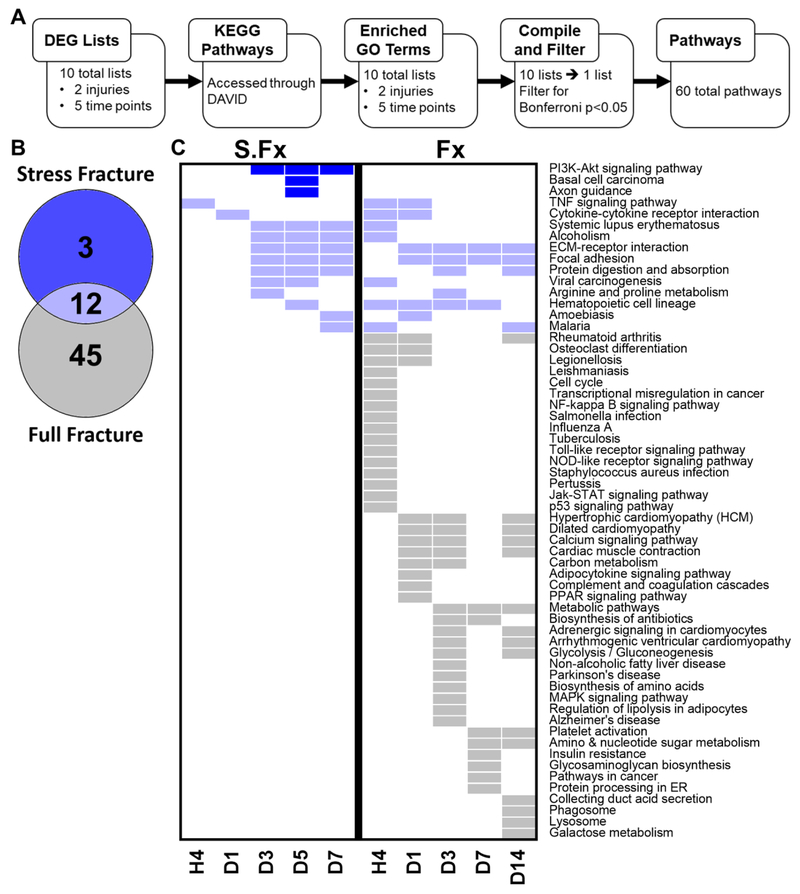
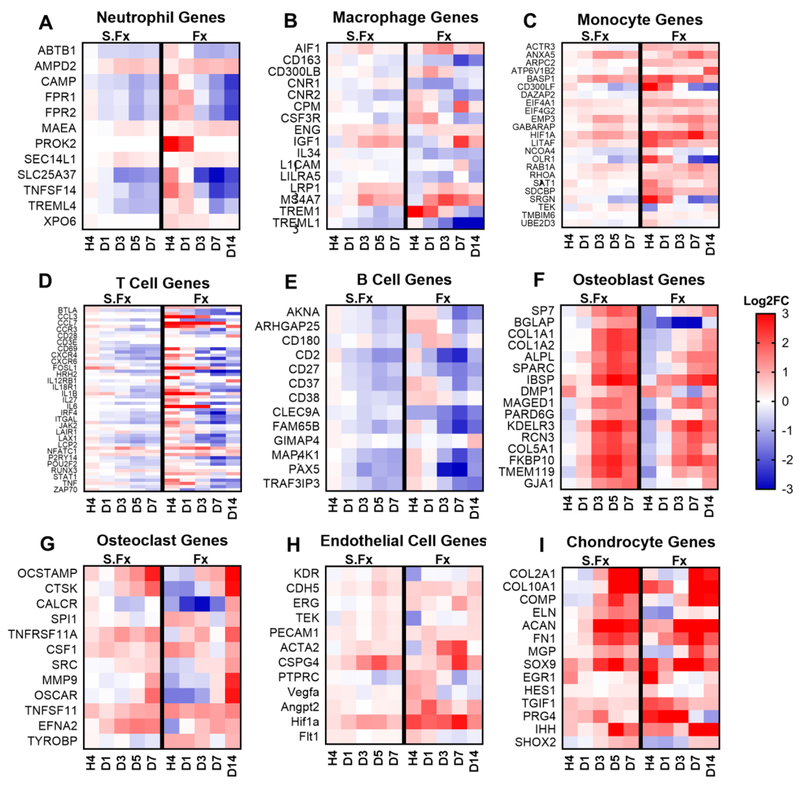
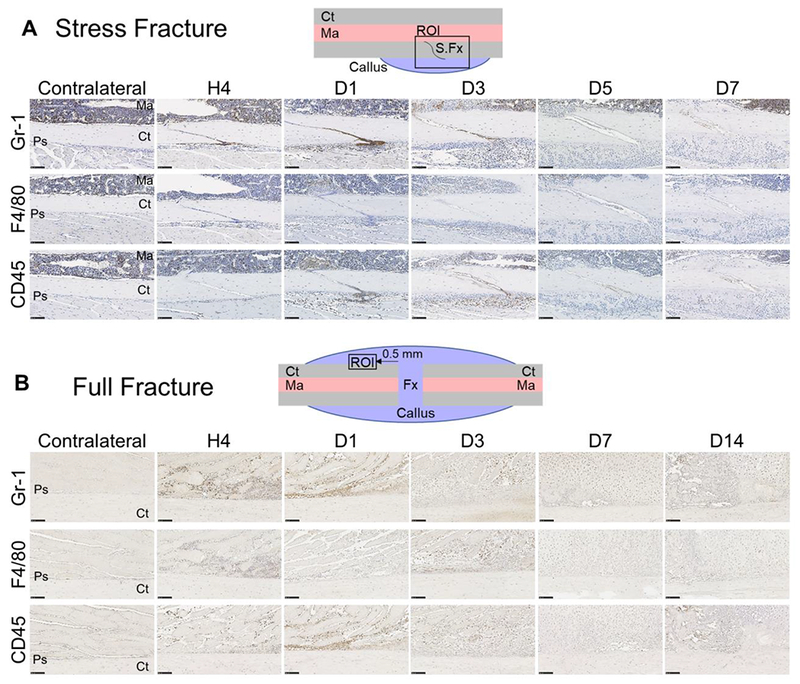
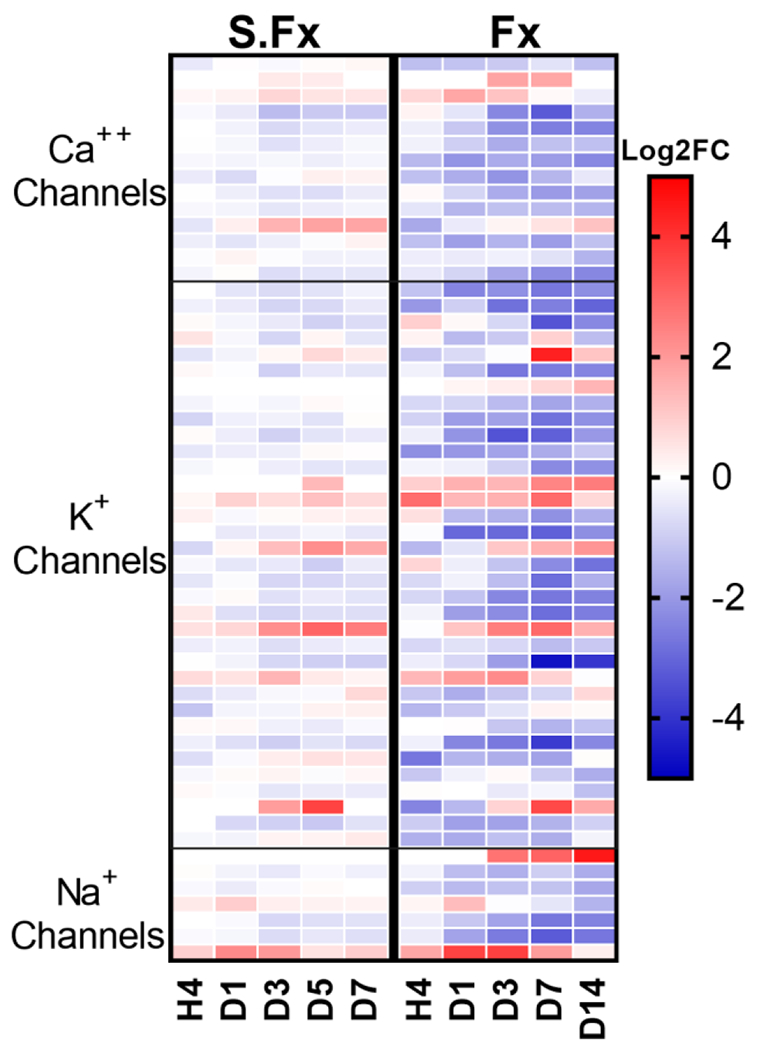
Bone fracture repair represents an important clinical challenge with nearly 1 million non-union fractures occurring annually in the U.S. Gene expression differs between non-union and healthy repair, suggesting there is a pattern of gene expression that is indicative of optimal repair. Despite this, the gene expression profile of fracture repair remains incompletely understood. In this work, we used RNA-seq of two well-established murine fracture models to describe gene expression of intramembranous and endochondral bone formation. We used top differentially expressed genes, enriched gene ontology terms and pathways, callus cellular phenotyping, and histology to describe and contrast these bone formation processes across time. Intramembranous repair, as modeled by ulnar stress fracture, and endochondral repair, as modeled by femur full fracture, exhibited vastly different transcriptional profiles throughout repair. Stress fracture healing had enriched differentially expressed genes associated with bone repair and osteoblasts, highlighting the strong osteogenic repair process of this model. Interestingly, the PI3K-Akt signaling pathway was one of only a few pathways uniquely enriched in stress fracture repair. Full fracture repair involved a higher level of inflammatory and immune cell related genes than did stress fracture repair. Full fracture repair also differed from stress fracture in a robust downregulation of ion channel genes following injury, the role of which in fracture repair is unclear. This study offers a broad description of gene expression in intramembranous and endochondral ossification across several time points throughout repair and suggests several potentially intriguing genes, pathways, and cells whose role in fracture repair requires further study.
Keywords: Animal models; Bone; Fracture repair; Transcriptome.
Copyright © 2019 Elsevier Inc. All rights reserved.
Conflict of interest statement
All other authors have no financial conflicts of interest with the submission of this manuscript.
Figures
Similar articles
-
Bmp2 conditional knockout in osteoblasts and endothelial cells does not impair bone formation after injury or mechanical loading in adult mice.Bone. 2015 Dec;81:533-543. doi: 10.1016/j.bone.2015.09.003. Epub 2015 Sep 5. Bone. 2015. PMID: 26344756 Free PMC article.
-
Impaired intramembranous bone formation during bone repair in the absence of tumor necrosis factor-alpha signaling.Cells Tissues Organs. 2001;169(3):285-94. doi: 10.1159/000047893. Cells Tissues Organs. 2001. PMID: 11455125
-
Stress fracture healing: fatigue loading of the rat ulna induces upregulation in expression of osteogenic and angiogenic genes that mimic the intramembranous portion of fracture repair.Bone. 2009 Feb;44(2):320-30. doi: 10.1016/j.bone.2008.09.010. Epub 2008 Oct 7. Bone. 2009. PMID: 18950737 Free PMC article.
-
Fracture Healing in the Setting of Endocrine Diseases, Aging, and Cellular Senescence.Endocr Rev. 2022 Nov 25;43(6):984-1002. doi: 10.1210/endrev/bnac008. Endocr Rev. 2022. PMID: 35182420 Free PMC article. Review.
-
Expression of bone morphogenetic proteins in fracture healing.Clin Orthop Relat Res. 1998 Oct;(355 Suppl):S116-23. doi: 10.1097/00003086-199810001-00013. Clin Orthop Relat Res. 1998. PMID: 9917632 Review.
Cited by
-
Transcriptional reprogramming during human osteoclast differentiation identifies regulators of osteoclast activity.Bone Res. 2024 Jan 24;12(1):5. doi: 10.1038/s41413-023-00312-6. Bone Res. 2024. PMID: 38263167 Free PMC article.
-
Molecular Dissection of Somatic Skeletal Disease in Neurofibromatosis Type 1.J Bone Miner Res. 2023 Feb;38(2):288-299. doi: 10.1002/jbmr.4755. Epub 2022 Dec 13. J Bone Miner Res. 2023. PMID: 36459048 Free PMC article.
-
Clinical Assessments of Fracture Healing and Basic Science Correlates: Is There Room for Convergence?Curr Osteoporos Rep. 2023 Apr;21(2):216-227. doi: 10.1007/s11914-022-00770-7. Epub 2022 Dec 19. Curr Osteoporos Rep. 2023. PMID: 36534307 Review.
-
Wnt-associated adult stem cell marker Lgr6 is required for osteogenesis and fracture healing.Bone. 2023 Apr;169:116681. doi: 10.1016/j.bone.2023.116681. Epub 2023 Jan 25. Bone. 2023. PMID: 36708855 Free PMC article.
-
Investigating Transcriptional Dynamics Changes and Time-Dependent Marker Gene Expression in the Early Period After Skeletal Muscle Injury in Rats.Front Genet. 2021 Jun 17;12:650874. doi: 10.3389/fgene.2021.650874. eCollection 2021. Front Genet. 2021. PMID: 34220936 Free PMC article.
References
-
- Pollak W-C, Sylvia I Andrew N.., Fracture Trends, in: United States Bone and Joint Initiative: The Burden of Musculoskeletal Diseases in the United States (BMUS), Third Edition, 2014, Rosemont, IL, n.d. http://www.boneandjointburden.org/ (accessed November 13, 2018).
-
- Warden SJ, Burr DB, Brukner PD, Stress Fractures: Pathophysiology, Epidemiology, and Risk Factors, (n.d.) 7. - PubMed
Publication types
MeSH terms
Grants and funding
LinkOut - more resources
Full Text Sources
Medical
Molecular Biology Databases
