. 2019 Sep 27:19:119-134.
doi: 10.1016/j.isci.2019.07.013. Epub 2019 Jul 15.

Zebrafish Exploit Visual Cues and Geometric Relationships to Form a Spatial Memory

Affiliations

Zebrafish Exploit Visual Cues and Geometric Relationships to Form a Spatial Memory

Ksenia Yashina et al. iScience. .

Abstract

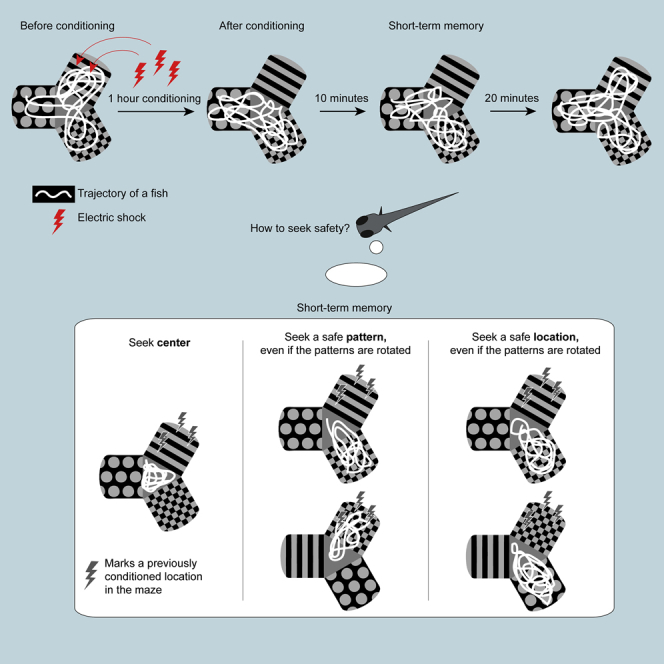
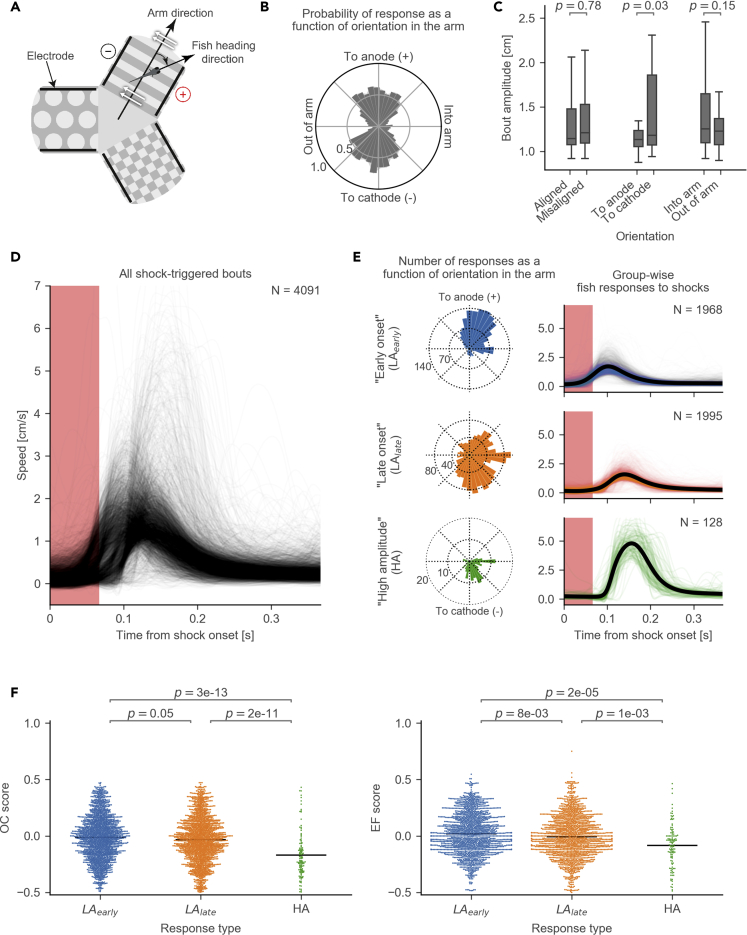
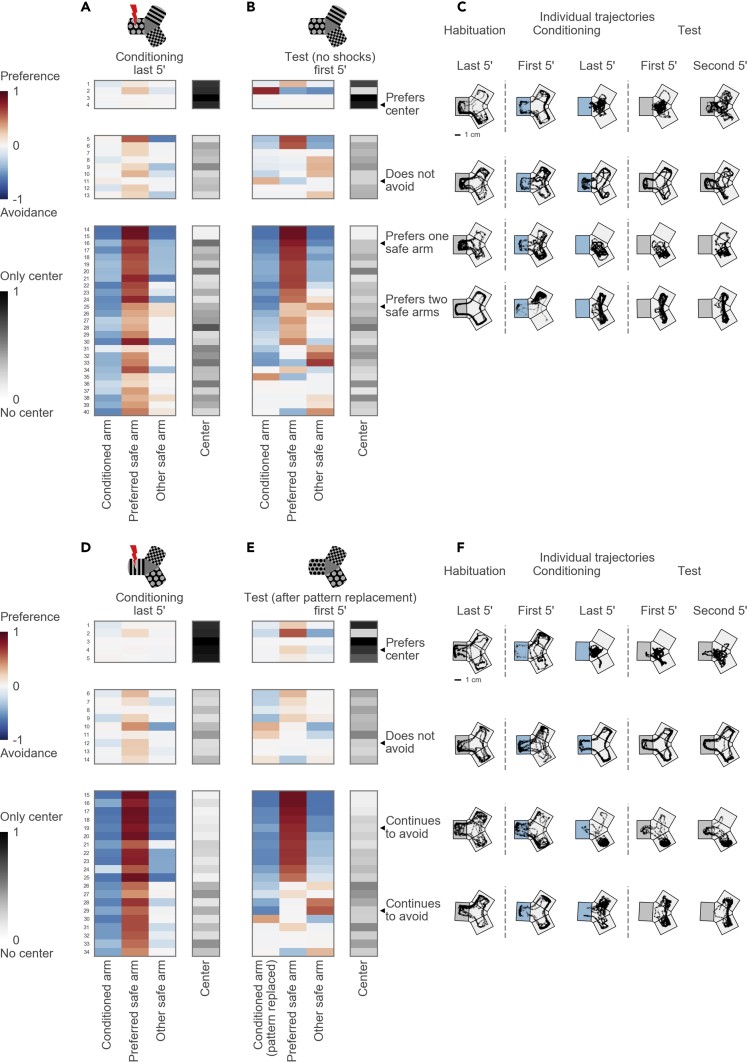
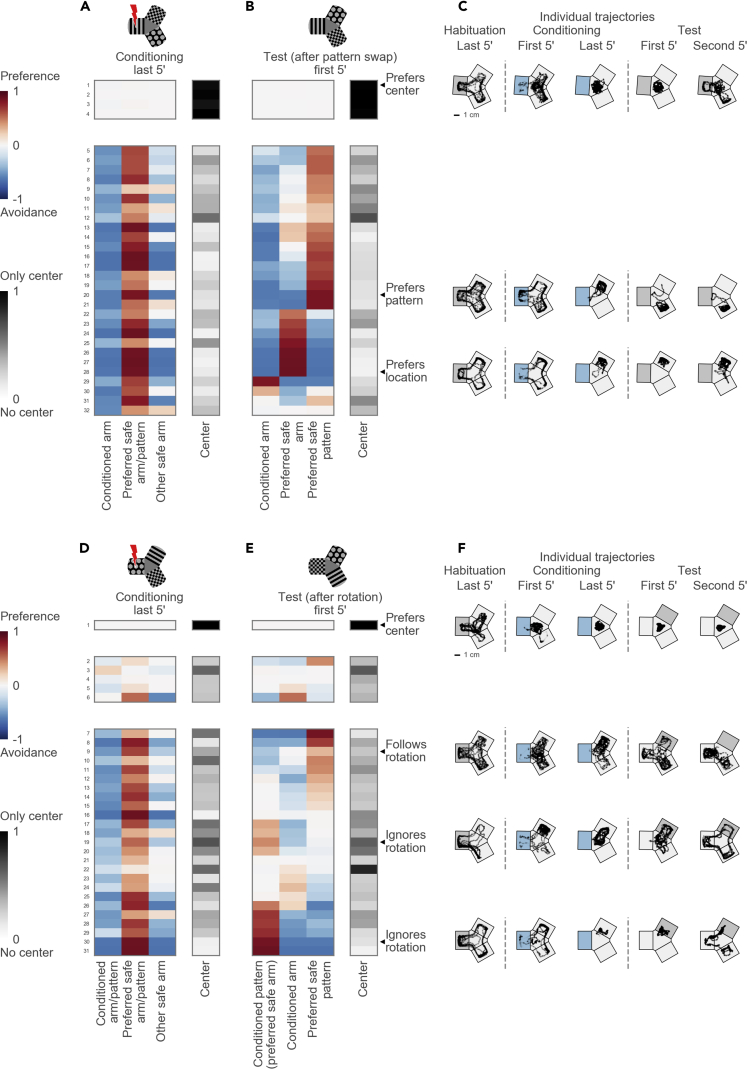
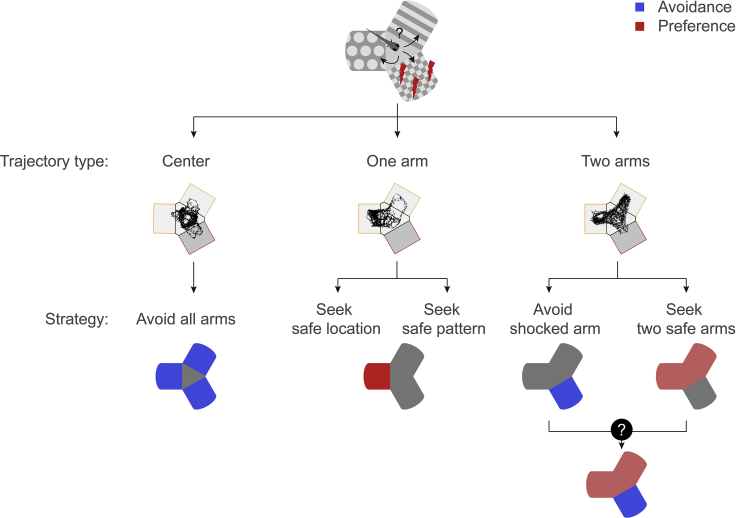
Animals use salient cues to navigate in their environment, but their specific cognitive strategies are largely unknown. We developed a conditioned place avoidance paradigm to discover whether and how zebrafish form spatial memories. In less than an hour, juvenile zebrafish, as young as 3 weeks, learned to avoid the arm of a Y-maze that was cued with a mild electric shock. Interestingly, individual fish solved this task in different ways: by staying in the safe center of the maze or by preference for one, or both, of the safe arms. In experiments in which the learned patterns were swapped, rotated, or replaced, the animals could transfer the association of safety to a different arm or to a different pattern using either visual cues or location as the conditioned stimulus. These findings show that juvenile zebrafish exhibit several complementary spatial learning modes, which generate a flexible repertoire of behavioral strategies.

Keywords: Behavioral Neuroscience; Biological Sciences; Evolutionary Biology.


Conflict of interest statement

The authors declare no competing interests.

Figures

None
Graphical abstract
Figure 1
Figure 1
The Conditioned Place Avoidance (CPA) Paradigm (A) Experimental setup. (B) Measures of fish performance in the paradigm, top: arm occupancy (OC); bottom: arm entry frequency (EF); middle: schematic for the calculation of the preference scores for OC/EF. Positive values of the scores correspond to arm preference; negative values correspond to arm avoidance. Red color represents the shocked arm, black and gray represent the safe arms. (C) Left: moving averages of the OC/EF scores in a 2-h control experiment (mean ± SEM). Right: box plots for OC/EF scores in the first and the last 5 min of the control experiments (Mann-Whitney test, n = 24 fish). Box plots show median and quartiles; whiskers show 1.5x interquartile range; dots show values for individual fish; prime symbol stands for minutes. (D) There is no significant preference for any of the visual patterns (ANOVA, n = 24 fish). Box plot annotations are the same as in (C). (E) Distributions of amplitudes for spontaneous (gray) and shock-triggered swim bouts (red). Age of the fish is between 20 and 27 days post fertilization. (F) Pseudo-random 1D walk model used to evaluate CPA measures. Bout amplitude S for simulated movement was drawn from a Gamma distribution, amplitude in the conditioned arm was multiplied by a speed ratio α. (G) Top: model without learning. Bottom: model with learning. Learning rule was implemented by decreasing the probability of entry into the conditioned arm. Middle and right: moving averages of EF and OC scores. Black/gray lines correspond to simulations with different speed ratios α. Dashed vertical blue lines mark the areas where moving average combined information from two sessions. Arrowheads mark the differences in the OC/EF scores between top and bottom. Moving averages are calculated with a 5-min time window and a 30-s time step. See also Table S1.
Figure 2
Figure 2
Performance in the CPA Paradigm across Different Age Groups (A) Schematic of the protocol: habituation and conditioning sessions. (B) Changes in EF scores across different age groups. Note that the EF score becomes significantly lower than zero only in 3-week-old fish. Top: moving average (mean ± SEM). Bottom: comparison of the EF scores in the last 5 min of conditioning with the null-distribution (permutation test). Individual values for each fish are shown as dots; null-distributions are shown in gray violin plots. Horizontal lines show the sample means; the line is red if the mean lies to the left of the fifth percentile in the null-distribution. Prime symbol stands for minutes. (C) Changes in OC scores across different age groups. Figure annotations are the same as in (B). (D) Distribution of body sizes across different ages. Average body size and its variability increase with age: 1 week, 4.95 ± 0.23 mm; 2 weeks, 6.74 ± 0.93 mm; 3 weeks, 7.64 ± 1.15 mm, mean ± standard deviation. Dpf, days post fertilization.
Figure 3
Figure 3
Evaluation of Aversive Memory Formed in the CPA Paradigm (A) Top: schematic of the protocol with habituation, conditioning, and test sessions. Bottom, left: OC score moving average. Black line shows average across individuals, gray ribbon shows SEM. Bottom, right: comparison of the OC scores in the last 5 min of conditioning and in the first, second, and last 5 min of test session with the null-distribution (permutation test, n = 40 fish). Prime symbol indicates minutes. (B) Top: schematic of the protocol with habituation, conditioning, no-pattern (all arms with a gray background), and test sessions. Bottom, left: OC score moving average. No-pattern session is indicated on the top of the plot with a black horizontal bar. Note the deflection in the moving average during the no-pattern session (at around minute 95) with a peak value near zero, the chance level. Bottom, right: comparison of the OC scores in the last 5 min of conditioning, 5 min of no-pattern, and in the first 5 min of test session with the null-distribution (permutation test, n = 30 fish). (C) Top: schematic of the protocol where visual patterns in all arms are identical. Bottom, left: OC score moving average. Bottom, right: comparison of the OC scores in the last 5 min of conditioning and in the first 5 min of test session with the null-distribution (permutation test, n = 31 fish). All moving averages are calculated with a 5-min time window and a 30-s time step. See also Figure S1.
Figure 4
Figure 4
Responsiveness to Electric Shocks (A) Schematic of a fish's orientation in the electric field. The orientation angle is calculated between arm direction and fish heading direction. White arrows show the direction of the electric field. Black lines indicate the positions of the electrodes. (B) A radial histogram of the probabilities of shock-triggered swim bouts (i.e., responses to shocks) plotted against the fish's orientation in the electric field (bin size 9°). (C) Comparison of the bout amplitudes between different orientations in the electric field (2-sample t test). Bout amplitude is calculated as speed integrated over the duration of a bout. “Aligned” bouts include anode- and cathode-facing orientations; “misaligned” bouts include into-arm- and out-of-arm-facing orientations. (D) Variety of amplitudes and onsets of individual shock-triggered swim bouts. Each curve shows the speed during an individual bout (N = 4,091 bouts). (E) Response types identified by hierarchical cluster analysis: low amplitude with early onset (LAearly, N = 1,968 bouts), low amplitude with late onset (LAlate, N = 1,995 bouts), and high-amplitude responses (HA, N = 128 bouts). Left: radial histogram of how many bouts of a certain type occur plotted against the fish's orientation in the electric field (bin size 9°). Right: speed over time after the shock onset. Y axes are the same as in (D). (F) Comparison of OC (left) and EF (right) scores in a 5-min time window after a shock-triggered bout between different response types (Mann-Whitney test). Each dot represents an OC or EF score after an individual shock-triggered bout. Horizontal lines indicate sample means. Bouts were obtained from the experiments with 27 fish.
Figure 5
Figure 5
Diverse Strategies Used to Avoid the Conditioned Arm (A) Top: schematic of the maze during the conditioning session. Bottom: hierarchical clustering of arm occupancies in the last 5 min of the conditioning session reveals three groups: 4 fish preferring the center, 9 fish not avoiding the conditioned arm, and 27 avoiding fish. Each group is presented as a table, one row per fish. Columns correspond to maze arms (from left to right: the conditioned arm, the preferred safe arm, the other safe arm) and the center. Each cell shows a color-coded occupancy value in the particular compartment of the maze for a particular fish, with the logarithmic blue-to-red color scheme for the maze arms and the gray color scheme for the maze center. (B) Top: schematic of the maze during the test session. The rows in (A) and (B) correspond to the same fish. Rows within each group are ordered by their similarity to each other in the hierarchical tree in the test session. (C) Example trajectories of individual fish in the last 5 min of habituation, in the first and last 5 min of conditioning, and in the first and second 5 min of test session. Top: a fish uses the central compartment as a “safe haven.” Upper middle: a non-avoiding fish revisits the conditioned arm despite continued shocks. Lower middle: a fish prefers one safe arm. Bottom: a fish swims in both safe arms. The conditioned arm is depicted with gray background for the habituation session, blue for the conditioning session, and again gray for the test session. The orientation of the conditioned arm varied in the experiments and is shown here on the left for clarity. (D) Top: schematic of the maze during the conditioning session in experiments with pattern replacement. Bottom: hierarchical clustering reveals three groups: 5 center-preferring, 9 non-avoiding, and 20 avoiding fish. (E) Top: schematic of the maze during the test session in experiments with pattern replacement. Bottom: occupancies during the test session that correspond to the groups identified in (D). (F) Example trajectories of individual fish before and after the pattern replacement. Top: a fish prefers the center. Upper middle: a non-avoiding fish. Lower middle: a fish swims in one safe arm before and after the replacement of the conditioned pattern. Bottom: a fish swims in both safe arms before and after the pattern replacement. See also Figures S2 and S3.
Figure 6
Figure 6
Dissociation of Pattern and Location Preference (A) Top: schematic of the maze during the conditioning session in experiments with pattern swap. Bottom: hierarchical clustering reveals two groups: 4 center-preferring and 28 arm-avoiding fish. (B) Arm occupancies during the test session in experiments with pattern swap. Occupancy groups correspond to the groups identified in (A). (C) Example trajectories of individual fish before and after the pattern swap. Top: a fish prefers the center. Middle: a fish prefers one arm and switches the arm after the patterns are swapped. Bottom: another fish also prefers one arm but stays in the same arm after the pattern swap. (D) Top: schematic of the maze during the conditioning session in experiments with pattern rotation. Bottom: hierarchical clustering reveals three groups: 1 center-preferring, 5 non-avoiding, and 25 avoiding fish. (E) Arm occupancies during the test session in experiments with pattern rotation. The conditioned pattern moves into the preferred safe arm, thus creating a conflict between avoidance and preference cues. The pattern from the preferred arm moves into the non-preferred arm; the pattern from the non-preferred arm moves into the previously conditioned arm. Occupancy groups correspond to the groups identified in (D). (F) Example trajectories of individual fish before and after the pattern rotation. Top: a fish prefers the center. Upper middle: a fish moves its preference following the preferred pattern and starts avoiding its previously preferred arm. Lower middle: a fish ignores the rotation and stays in its preferred arm despite the presence of the conditioned pattern. Bottom: another fish also ignores the rotation and stays in its preferred arm. See also Figure S4.
Figure 7
Figure 7
Diverse Strategies for Conditioned Place Avoidance Among Individual Animals Center visitors could avoid all arms. One-arm visitors prefer one arm: either a pattern or a location in the maze. Two-arm visitors avoid the conditioned arm: either by avoiding the conditioned arm or by a more sophisticated strategy, e.g., learning the two safe patterns or the combination of visual and location cues in the maze.

Similar articles

Cited by

References

    1. Aizenberg M., Schuman E.M. Cerebellar-dependent learning in larval Zebrafish. J. Neurosci. 2011;31:8708–8712. - PMC - PubMed
    1. Al-Imari L., Gerlai R. Sight of conspecifics as reward in associative learning in zebrafish (Danio rerio) Behav. Brain Res. 2008;189:216–219. - PubMed
    1. Aoki R., Tsuboi T., Okamoto H. Y-maze avoidance: an automated and rapid associative learning paradigm in zebrafish. Neurosci. Res. 2015;91:69–72. - PubMed
    1. Bergmann K., Meza Santoscoy P., Lygdas K., Nikolaeva Y., MacDonald R., Cunliffe V., Nikolaev A. Imaging neuronal activity in the optic tectum of late stage larval Zebrafish. J. Dev. Biol. 2018;6:6. - PMC - PubMed
    1. Braubach O.R., Wood H.-D., Gadbois S., Fine A., Croll R.P. Olfactory conditioning in the zebrafish (Danio rerio) Behav. Brain Res. 2009;198:190–198. - PubMed

LinkOut - more resources