

Extracting Global Shipping Networks from Massive Historical Automatic Identification System Sensor Data: A Bottom-Up Approach
- PMID: 31370172
- PMCID: PMC6695660
- DOI: 10.3390/s19153363
Extracting Global Shipping Networks from Massive Historical Automatic Identification System Sensor Data: A Bottom-Up Approach
Abstract
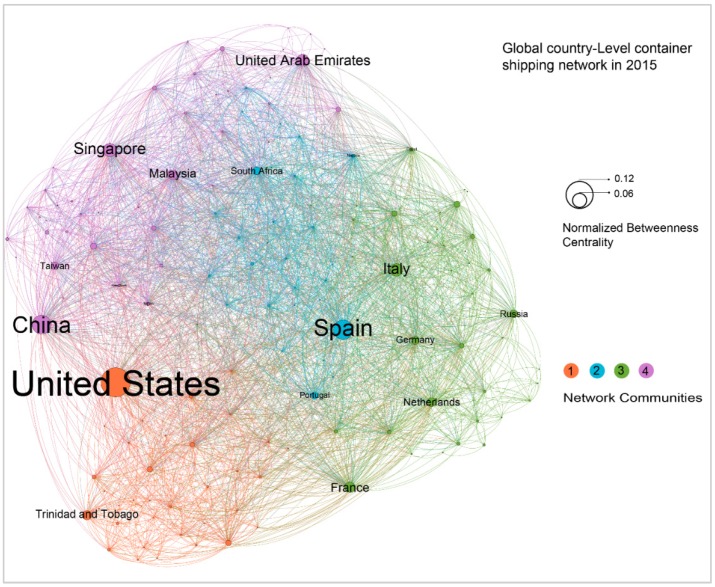
The increasing availability of big Automatic Identification Systems (AIS) sensor data offers great opportunities to track ship activities and mine spatial-temporal patterns of ship traffic worldwide. This research proposes a data integration approach to construct Global Shipping Networks (GSN) from massive historical ship AIS trajectories in a completely bottom-up way. First, a DBSCAN (Density-Based Spatial Clustering of Applications with Noise) algorithm is applied to temporally identify relevant stop locations, such as marine terminals and their associated events. Second, the semantic meanings of these locations are obtained by mapping them to real ports as identified by the World Port Index (WPI). Stop events are leveraged to develop travel sequences of any ship between stop locations at multiple scales. Last, a GSN is constructed by considering stop locations as nodes and journeys between nodes as links. This approach generates different levels of shipping networks from the terminal, port, and country levels. It is illustrated by a case study that extracts country, port, and terminal level Global Container Shipping Networks (GCSN) from AIS trajectories of more than 4000 container ships in 2015. The main features of these GCSNs and the limitations of this work are finally discussed.
Keywords: AIS big data; DBSCAN; ship trajectory; shipping network; stay locations; stop events.
Conflict of interest statement
The authors declare no conflict of interest.
Figures


References
-
- Rodrigue J., Comtois C., Slack B. The Geography of Transport Systems. Routledge; New York, NY, USA: 2016.
-
- IMO . International Shipping and World Trade. International Maritime Organization; London, UK: 2006.
-
- Wang C., Wang J. Spatial pattern of the global shipping network and its hub-and-spoke system. Res. Transp. Econ. 2011;32:54–63. doi: 10.1016/j.retrec.2011.06.010. - DOI
-
- Viljoen N.M., Joubert J.W. The vulnerability of the global container shipping network to targeted link disruption. Phys. A Stat. Mech. Appl. 2016;462:396–409. doi: 10.1016/j.physa.2016.06.111. - DOI
-
- Peng P., Cheng S., Chen J., Liao M., Wu L., Liu X., Lu F. A fine-grained perspective on the robustness of global cargo ship transportation networks. J. Geogr. Sci. 2018;28:881–889. doi: 10.1007/s11442-018-1511-z. - DOI
Grants and funding
LinkOut - more resources
Full Text Sources
Research Materials
Miscellaneous
