. 2019 Jul 28;151(4):044111.
doi: 10.1063/1.5108761.

A hybrid, bottom-up, structurally accurate, Go¯-like coarse-grained protein model

Affiliations

A hybrid, bottom-up, structurally accurate, Go¯-like coarse-grained protein model

Tanmoy Sanyal et al. J Chem Phys. .

Abstract

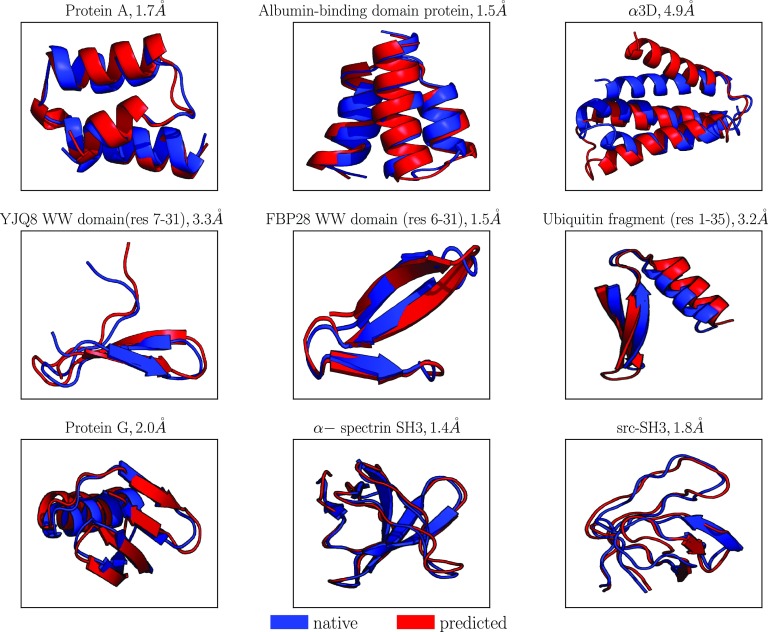
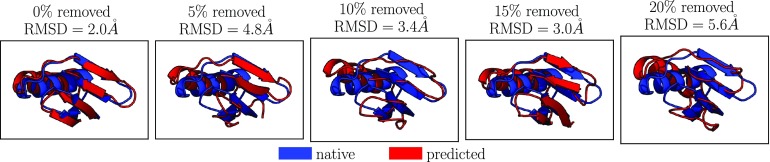
Coarse-grained (CG) protein models in the structural biology literature have improved over the years from being simple tools to understand general folding and aggregation driving forces to capturing detailed structures achieved by actual folding sequences. Here, we ask whether such models can be developed systematically from recent advances in bottom-up coarse-graining methods without relying on bioinformatic data (e.g., protein data bank statistics). We use relative entropy coarse-graining to develop a hybrid CG but Go¯-like CG peptide model, hypothesizing that the landscape of proteinlike folds is encoded by the backbone interactions, while the sidechain interactions define which of these structures globally minimizes the free energy in a unique native fold. To construct a model capable of capturing varied secondary structures, we use a new extended ensemble relative entropy method to coarse-grain based on multiple reference atomistic simulations of short polypeptides with varied α and β character. Subsequently, we assess the CG model as a putative protein backbone forcefield by combining it with sidechain interactions based on native contacts but not incorporating native distances explicitly, unlike standard Go¯ models. We test the model's ability to fold a range of proteins and find that it achieves high accuracy (∼2 Å root mean square deviation resolution for both short sequences and large globular proteins), suggesting the strong role that backbone conformational preferences play in defining the fold landscape. This model can be systematically extended to non-natural amino acids and nonprotein polymers and sets the stage for extensions to non-Go¯ models with sequence-specific sidechain interactions.


Figures

FIG. 1.
FIG. 1.
Leucine is mapped to four heavy atom centers N, C, O, and S that sit at the centers-of-mass of the amino, α-carbon, carbonyl carbon and oxygen, and the side-chain groups, respectively. The CG model of a 15-mer leucine polypeptide is parameterized by minimizing the relative entropy using a reference atomistic simulation.
FIG. 2.
FIG. 2.
CG backbone potentials (UCGBB) are first extracted from CG polypeptide models parameterized by minimizing relative entropy from AA polyleucine (red), polyvaline (dark yellow), and a mixed leucine-valine sequence LVVVVVVVLLLVVLL. A hybrid CG backbone embedding both α helical (from polyleucine) and β-sheet (from polyvaline) characteristics is also parameterized by simultaneously minimizing the total relative entropy from both AA leucine and valine polymer references. Go¯-like models are developed for each of these backbone forcefields, by parameterizing native interactions UpairSS, native through a second round of relative entropy minimization with a AA simulation of the trp-cage miniprotein (1L2Y). Lines across the 1L2Y structure connect the native contacts.
FIG. 3.
FIG. 3.
Comparison of folding curves between atomistic (blue) and CG (red) simulations of 15-mers of leucine (panel A) and valine (panel B). The folding fraction at a particular temperature is calculated as the fraction of the (reweighted) trajectory that is within 3 Å RMSD of the reference AA top-cluster structure at 270 K (helix for polyleucine and hairpin for polyvaline). Reference (AA top cluster) and CG top cluster structures are shown in blue and red, respectively, in the insets. Folding temperatures for AA polyleucine (407 K) and polyvaline (367 K) are marked with vertical dashed lines. The CG LEU15 model has nearly similar (within 5 K error) folding temperature as its atomistic counterpart, while the VAL15 model underestimates the atomistic folding temperature by ∼27 K.
FIG. 4.
FIG. 4.
Comparison between AA and CG simulations of folding free energy surfaces (ΔF) at 280 K, as functions of radius of gyration (Rg) and backbone RMSD from the atomistic top-cluster structure at 270 K, for LEU15 (top panel) and VAL15 (bottom panel) CG models. While the LEU15 CG model exclusively stabilizes an ideal helix similar to its AA reference, the VAL15 AA and CG models have significant populations of two closely similar hairpins that are register-shifted from each other. In either case, the top cluster structures are reproduced nearly quantitatively (RMSD ≤ 1 Å). AA structures are shown in blue, while CG structures are in red.
FIG. 5.
FIG. 5.
The LEU6VAL9 CG polypeptide model constructed from the leucine-valine copolymer LVVVVVVVLLLVVLL. The panels in (a) compare the folding curves between AA (blue) and CG (red) simulations of the copolymer. The folding fractions are calculated as the percent of the (reweighted) trajectory that is within 3 Å RMSD of a given reference structure as shown. The left panel in (a) uses the pure atomistic polyleucine helix at 270 K (see Fig. 3) as reference, thus showing an α-helix fraction, while the right panel uses the pure atomistic polyvaline hairpin at 270 K reference (again, Fig. 3), showing a β-fraction. The dashed lines mark the folding temperature of 360 K for the AA copolymer, where the total α + β (i.e., the structured fraction of configurations) is 50%. Both α and β fractions in the CG model are lower than their AA counterparts. The panels in (b) compare the AA (left) and CG (right) free energy surfaces at 280 K as a function of the radius of the gyration (Rg) and RMSD from the polyleucine helix reference. Shown in red are the actual top cluster structures at 280 K from the CG copolymer MD simulation. The top α clusters are similar, while the top β cluster is register shifted in the CG model.
FIG. 6.
FIG. 6.
The LEU15 + VAL15 CG polypeptide model constructed using the extended-ensemble method, by combining data from AA leucine and valine 15-mers. Both the (a) free energy surface as a function of Rg and RMSD from the polyleucine top cluster structure (near perfect helix) and (b) Ramachandran plot at 280 K reveal the presence of basins dominated by both helices and hairpins separated by a ∼7.5kBT barrier. (c) Folding curves (constructed by considering trajectory fractions within 3 Å of the top clusters of AA polyleucine and polyvaline) show that β-fractions remain consistently lower than 5%. Here, solid curves correspond to AA results, while dashed curves correspond to CG simulations. (d) However, when used in a self-assembly simulation of six polypeptide chains, the LEU15 + VAL15 forcefield produces an antiparallel beta-zipper structure (inset) with ∼80% β-content, also shown by dominant off-diagonal patterns in the interresidue contact map (A–F refers to the 6 peptide chains).
FIG. 7.
FIG. 7.
Native interactions optimized from the atomistic trp-cage miniprotein (1L2Y) at 300 K, for the candidate backbone forcefields in Table I. All native potentials have an inner repulsive core near ∼3.8 Å and are cut off at 10 Å. The non-native interaction is fixed as a WCA potential with σ = 3.8 Å and ε = 4.2kBT.
FIG. 8.
FIG. 8.
Assessment of the accuracy of Go¯-like CG models in Table I for predicting the structure of α-helical (top panel), β-rich (middle panel), and α + β (bottom panel) sequences (detailed in Table II). In each panel, stacked bar charts show the fraction of sequences that fold to within 2 Å (green), 2–4 Å (teal), and >4 Å (brown) RMSD from the native structure. The LEU15 + VAL15 CG backbone at 300 K, derived from an extended ensemble of polyleucine and polyvaline AA references, best-predicts all trial proteins. All RMSDs are ensemble-averaged values from trajectories at 290 K.
FIG. 9.
FIG. 9.
Top cluster structures for short sequences (11–20 residues) predicted by the Go¯-like model derived from the extended-ensemble LEU15 + VAL15 backbone. Native structures are in blue, while simulated ones are in red. The RMSD from the native structure (averaged from the trajectory at 290 K) is reported beside the sequence name. The average standard error (standard deviation/mean) in calculating the RMSDs is ∼6.5%.
FIG. 10.
FIG. 10.
Top cluster structures for longer sequences (26–73 residues) predicted by the Go¯-like model derived from the extended-ensemble LEU15 + VAL15 backbone. Native structures are in blue, while simulated ones are in red. The RMSD from the native structure (averaged from the trajectory at 290 K) is reported beside the sequence name. The average standard error (standard deviation/mean) in calculating the RMSDs is ∼6.5%.
FIG. 11.
FIG. 11.
Top cluster structures for bacterial flavodoxin (163 residues) and the TIM barrel protein (247 residues) predicted by the Go¯-like model derived from the extended-ensemble LEU15 + VAL15 backbone. Native structures are in blue, while simulated ones are in red. The RMSD from the native structure (averaged from the trajectory at 290 K) is reported beside the sequence name. The average standard error (standard deviation/mean) in calculating the RMSDs is ∼6%.
FIG. 12.
FIG. 12.
A test of robustness of the Go¯-like model derived from the extended ensemble LEU15 + VAL15 backbone forcefield. This model is used in CG REMD simulations of protein G that progressively remove native-contact information by deleting zero to 20% of the native contacts. The RMSD with the native structure (ensemble averaged from the 290 K trajectory) varies between 2 and 5.6 Å and has a standard error (standard deviation/mean) of ∼6.5%. The prediction quality does not decrease monotonically since contacts are removed randomly. Native and predicted structures are colored blue and red, respectively.

References

    1. Kendrew J. C., Bodo G., Dintzis H. M., Parrish R. G., Wyckoff H., and Phillips D. C., “A three-dimensional model of the myoglobin molecule obtained by x-ray analysis,” Nature 181, 662–666 (1958).10.1038/181662a0 - DOI - PubMed
    1. Perutz M. F., Rossmann M. G., Cullis A. F., Muirhead H., Will G., and North A. C. T., “Structure of hæmoglobin: A three-dimensional Fourier synthesis at 5.5-Å. Resolution, obtained by x-ray analysis,” Nature 185, 416–422 (1960).10.1038/185416a0 - DOI - PubMed
    1. Brito J. A. and Archer M., “X-ray crystallography,” in Practical Approaches to Biological Inorganic Chemistry, edited by Crichton R. R. and Louro R. O. (Elsevier, Oxford, 2013), Chap. 9, pp. 217–255.
    1. Nitsche C. and Otting G., “NMR studies of ligand binding,” Curr. Opin. Struct. Biol. 48, 16–22 (2018).10.1016/j.sbi.2017.09.001 - DOI - PubMed
    1. Davis C. M., Gruebele M., and Sukenik S., “How does solvation in the cell affect protein folding and binding?,” Curr. Opin. Struct. Biol.Curr. Opin. Struct. Biol. 48, 23–29 (2018).10.1016/j.sbi.2017.09.003 - DOI - PubMed

MeSH terms