. 2019 Jul;146(1):425.
doi: 10.1121/1.5116680.

The impact of peripheral mechanisms on the precedence effect

Affiliations

The impact of peripheral mechanisms on the precedence effect

M Torben Pastore et al. J Acoust Soc Am. 2019 Jul.

Abstract

When two similar sounds are presented from different locations, with one (the lead) preceding the other (the lag) by a small delay, listeners typically report hearing one sound near the location of the lead sound source-this is called the precedence effect (PE). Several questions about the underlying mechanisms that produce the PE are asked. (1) How might listeners' relative weighting of cues at onset versus ongoing stimulus portions affect perceived lateral position of long-duration lead/lag noise stimuli? (2) What are the factors that influence this weighting? (3) Are the mechanisms invoked to explain the PE for transient stimuli applicable to long-duration stimuli? To answer these questions, lead/lag noise stimuli are presented with a range of durations, onset slopes, and lag-to-lead level ratios over headphones. Monaural, peripheral mechanisms, and binaural cue extraction are modeled to estimate the cues available for determination of perceived laterality. Results showed that all three stimulus manipulations affect the relative weighting of onset and ongoing cues and that mechanisms invoked to explain the PE for transient stimuli are also applicable to the PE, in terms of both onset and ongoing segments of long-duration, lead/lag stimuli.


Figures

FIG. 1.
FIG. 1.
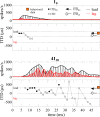
(Color online) Time domain illustrations, from top to bottom, of the basic types of lead/lag stimuli: 1-ms, 41-ms, and 200-ms noise burst, and an example of the diotically windowed noise burst, this one of 100-ms duration. Lead stimuli are represented in black. The 200- and 41-ms stimuli had a center frequency of 500 Hz with an 800-Hz bandwidth with 20-ms cos2 on- and off-ramps. The 1-ms duration stimuli were wideband (50–3950 Hz) Gaussian noises that were then rectangular windowed. The ITD, which was ±300 μs for all stimulus conditions, is the delay between the lead (or lag) in one ear and the lead (or lag) in the contralateral ear. The lead/lag delay is the time elapsed between the onset of the lead at one ear and the onset of lag at the other ear. For the diotically windowed stimuli (subscripted 20 D) presented in experiments 2.1 and 2.2, a 400-ms duration stimulus was created. Then, the compound lead/lag stimulus was multiplied by a temporally centered diotic window with 20-ms cos2 on- and off-ramps. Thick back envelopes indicate the window and hatched gray sections indicate the stimulus portion that was windowed out. This operation yielded a stimulus with a duration of 50–600 ms, depending on the condition, with diotic envelope onsets and offsets but the same ongoing temporal fine-structure relations that would occur in the “ongoing” stimulus portion of the standard long duration lead/lag pairs presented in the earlier experiments. See Table I for further details. Note that ITD and lead/lag delay are not drawn to scale. Also, the ITD was shorter than any stimulus, so the left and right ear signals temporally overlapped for each lead and lag left/right pair.
FIG. 2.
FIG. 2.
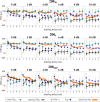
(Color online) Normalized performance of six listeners for the 10, 4120, and 20020 stimuli. The ILD of the acoustic pointer was normalized such that +1 indicates perceived lateral position that was the same as for the lead presented alone (without the lag), –1 matching the lag alone, and 0 matching diotic presentation. The lag/lead level ratio is indicated above each figure panel. For legibility, data points for different stimulus conditions are skewed slightly to the left and right of each other.
FIG. 3.
FIG. 3.
(Color online) The normalized performance of 6 listeners for the 20020 (open circles) and 2005 (filled squares) conditions. Vertical bars show the standard error of the mean. Figure is otherwise read the same as Fig. 2.
FIG. 4.
FIG. 4.
The performance of 7 listeners for 800–Hz bandwidth 200–ms Gaussian noise bursts in the presence of one lag stimulus. Figure is otherwise read the same as previous data figures. Inset: Calculated broadband interaural level differences as a function of lead/lag delay.
FIG. 5.
FIG. 5.
(Color online) Normalized listener performance for the 20020 (open circles) vs 20020D (downward triangles) conditions for 11 listeners. See Table I and Fig. 1 for further details.
FIG. 6.
FIG. 6.
(Color online) The mean and standard error of the mean of the change in lateralization, relative to the 20020 condition, for the six listeners (shown also in Fig. 3) who participated in the 20020, 2005, and 20020D conditions. Black lines show the change resulting from sharpening the onset to 5 ms and gray lines show the change resulting from diotically windowing onsets and offsets.
FIG. 7.
FIG. 7.
(A) The average performance of 6 listeners for stimuli of various durations with diotic onsets and offsets. Vertical bars indicate the standard error of the mean. (B) The mean change, averaged across lead/lag delays and listeners, in lateralization re: the 5020D condition for each longer duration stimulus. Error bars indicate the standard error of the mean averaged across lead/lag delays. Positive values indicate responses that are further towards the lead than for the 5020D condition. (C) The proportion of the lateral extent reported for the 60020D condition that was reported for the 5020D (gray bar) and 20020D (black bar) conditions.
FIG. 8.
FIG. 8.
(Color online) Output from the Zilany et al. (2014) AN model in response to a 70 dB, 50-ms duration 750 Hz pure tone with 20-ms cos2 on- and off-ramps showing effects of adaptation, and filter ringing. The envelope of the input sinusoid is shown at the same time scale as the neural outputs and arbitrary units of linear (thin line) and logarithmic (thick line) amplitude. Effects of hair-cell compression are not shown; the change in neural output brought about by an increase in stimulus amplitude of 6 dB (the approximate increase in amplitude from adding a lag to the lead stimulus) would barely be visible in this figure.
FIG. 9.
FIG. 9.
(Color online) Modeling analyses for the 1-ms lead/lag delay, 0-dB lag-level condition for the 10 stimulus (top 2 panels) and the 4120 stimulus (bottom 2 panels). For each stimulus, modeled auditory nerve output for the auditory filter centered at 750 Hz, for the lead- and lag-side ears, is shown in the upper panel and a binaural coincidence detection analysis is shown in the lower panel. For each ITD analysis, ITDs calculated from the rising slope (ITDRS) of the modeled auditory nerve output are shown with filled circles and other calculated ITDs are shown with empty circles. To the right side of each ITD analysis panel, the mean ITDRS is shown with a filled, black arrow, and the mean of all ITDs (i.e., filled and empty circles), regardless of slope, is shown with an empty, diamond-shaped arrow. Mean behavioral data for the same conditions are shown with shaded squares.
FIG. 10.
FIG. 10.
(Color online) Detailed ITD analyses for the 20020 stimulus, comparing the 2- and 5-ms lead/lag delay conditions at 0-dB lag level. Figure is read the same as Fig. 9, but mean ITD measures (diamonds) have error bars to indicate the standard deviation (across time), and are included at the right end of each figure panel along with the behavioral results for the 20020 (shaded circles) and 20020D (diotically windowed onset, inverted triangles).
FIG. 11.
FIG. 11.
(Color online) Modeled ITDs for the 20020 (top row) and 20020D stimuli (bottom row) at 0-dB lag level. Shaded circles, connected by thin black lines, represent ITDRS calculated during the first rising slope of the onset of the entire stimulus. Filled black squares show ITDRS calculated from the rising slope of within-filter envelope fluctuations during the ongoing portion of the stimulus. Open, unconnected circles show ITDs estimated from all stimulus portions, regardless of slope. Panels to the left show model results for the individual filters most heavily weighted in the ITD weighting function (center panel—filled triangles indicate center frequencies for which model results are shown). The center frequency for each filter is shown at the top of each individual filter model panel. Modeled ITDs for these individual filters are then weighted by the ITD weighting function (see text for more details). The weighted mean and standard deviation across center frequencies of all ten individual filters are shown in the rightmost column along with the behavioral data (thick shaded line). Behavioral data are plotted so that an average normalized pointer ILD of ±1 = ±300 μs (see Sec. II, reference condition).
FIG. 12.
FIG. 12.
(Color online) Modeling results, integrated across frequencies, for the 20020 (200-ms duration, 20-ms cos2 onset/offset slopes), 2005 (200-ms duration, 5-ms cos2 onset/offset slopes), and 20020D (200-ms duration, 20-ms cos2 diotic onset/offset slope) stimuli at all presented combinations of lead/lag delay and lag level. The same types of ITD estimates are shown as in Fig. 11, with the addition of estimated long-term ILDs (shaded diamonds). As in Fig. 11, behavioral data are shown with the thick shaded line; the thickness of the line is approximately the same as the average standard deviation of the behavioral data.

Similar articles

Cited by

References

    1. Bernstein, L. R. , and Trahiotis, C. (1985). “ Lateralization of low-frequency, complex waveforms: The use of envelope-based temporal disparities,” J. Acoust. Soc. Am. 77(5), 1868–1880.10.1121/1.391938 - DOI - PubMed
    1. Bianchi, F. , Verhulst, S. , and Dau, T. (2013). “ Experimental evidence for a cochlear source of the precedence effect,” J. Assoc. Res. Otolaryngol. 14, 767–779.10.1007/s10162-013-0406-z - DOI - PMC - PubMed
    1. Blauert, J. (1997). Spatial Hearing, revised ed. ( The MIT Press, Cambridge, MA: ).
    1. Braasch, J. (2013). “ A precedence effect model to simulate localization dominance using an adaptive, stimulus parameter-based inhibition process,” J. Acoust. Soc. Am. 134(1), 420–435.10.1121/1.4807829 - DOI - PubMed
    1. Braasch, J. (2016). “ Sound localization in the presence of multiple reflections using a binaurally integrated cross-correlation/auto-correlation mechanism,” J. Acoust. Soc. Am. 140, EL143–EL148.10.1121/1.4959230 - DOI - PubMed

Publication types