. 2019 Aug 1;25(1):35.
doi: 10.1186/s10020-019-0102-5.

Gut microbiota promote the inflammatory response in the pathogenesis of systemic lupus erythematosus

Affiliations

Gut microbiota promote the inflammatory response in the pathogenesis of systemic lupus erythematosus

Yiyangzi Ma et al. Mol Med. .

Abstract

Objectives: Systemic lupus erythematosus (SLE) is a chronic autoimmune disease whose onset and progression are affected by genetic and environmental factors. The purpose of this study is to identify the influence of gut microbiota in the pathogenesis of SLE, and to investigate the mechanism involved.

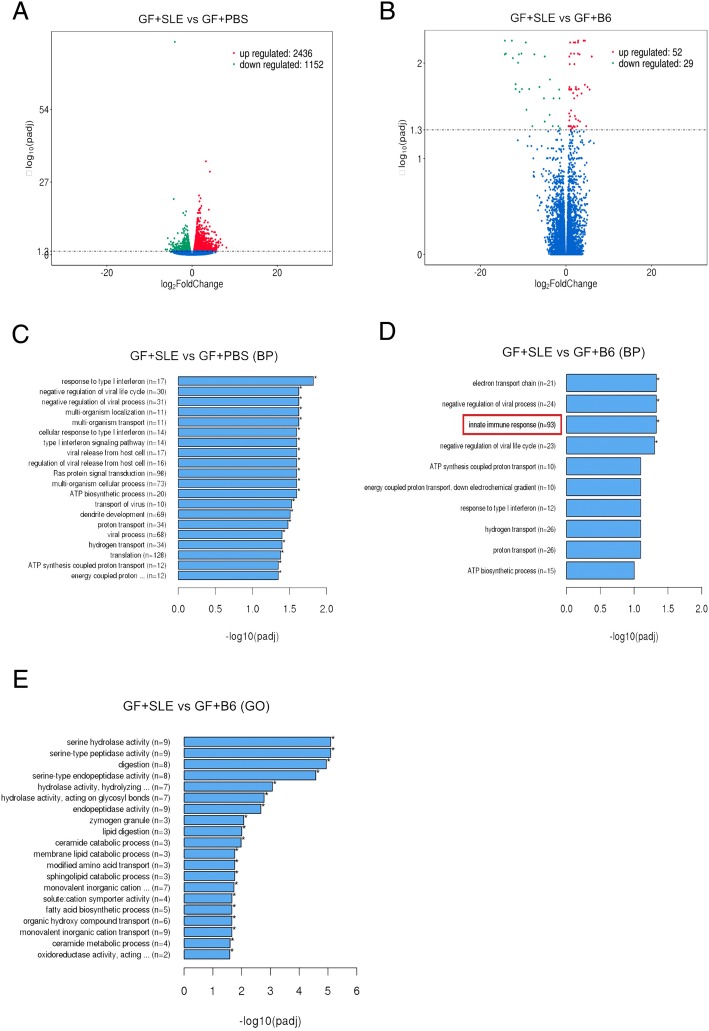
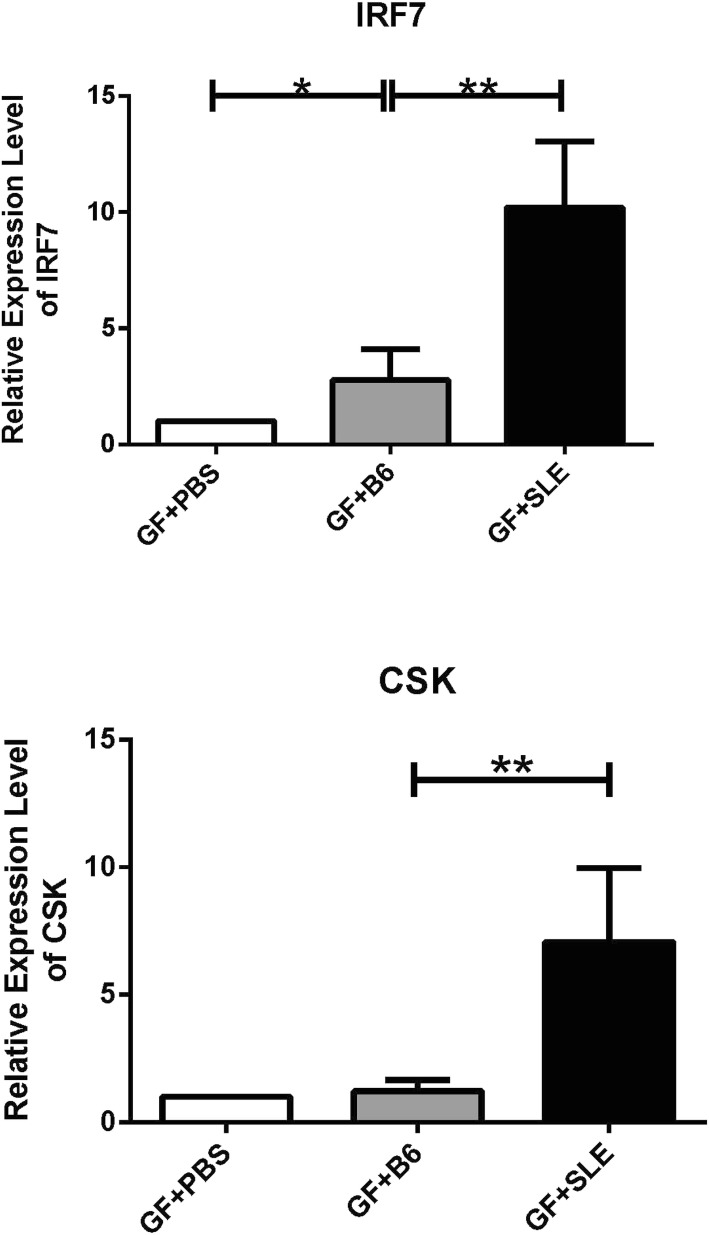
Methods: Fecal microbiota from C57/BL6 mice and SLE prone mice were examined using next-generation sequencing (NGS). Germ free mice were given fecal microbiota transplantation (FMT), and their gut microbiome and gene expression in recipients' colons were examined by NGS. The anti-double stranded DNA (anti-dsDNA) antibodies in recipients were determined using an enzyme-linked immunosorbent assay (ELISA). The immune cell profiles of mice were analyzed by flow cytometry at the 3rd week after FMT, and the expression of genes associated with SLE after FMT was determined using quantitative real-time PCR (qRT-PCR).

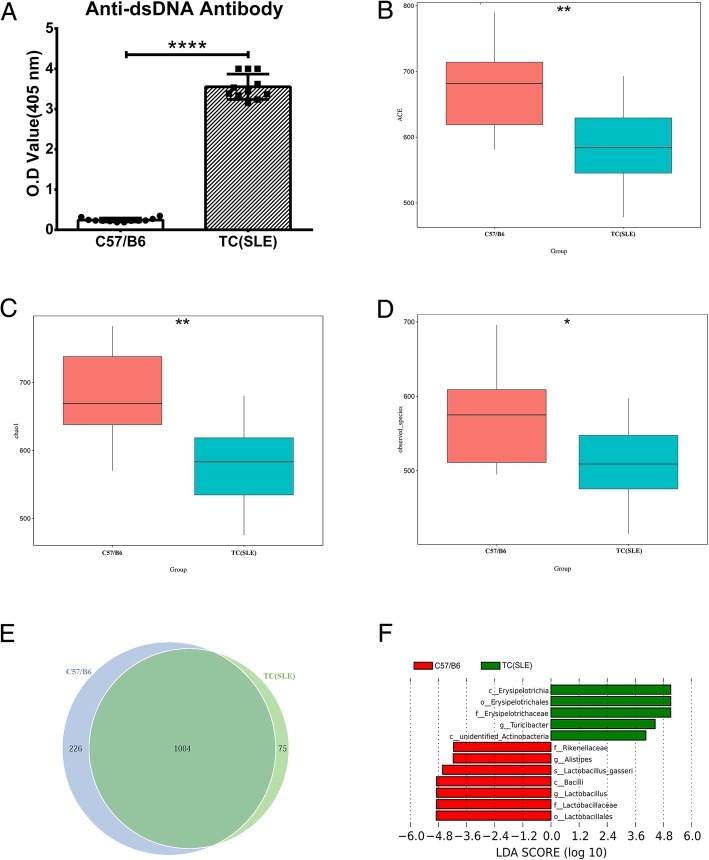
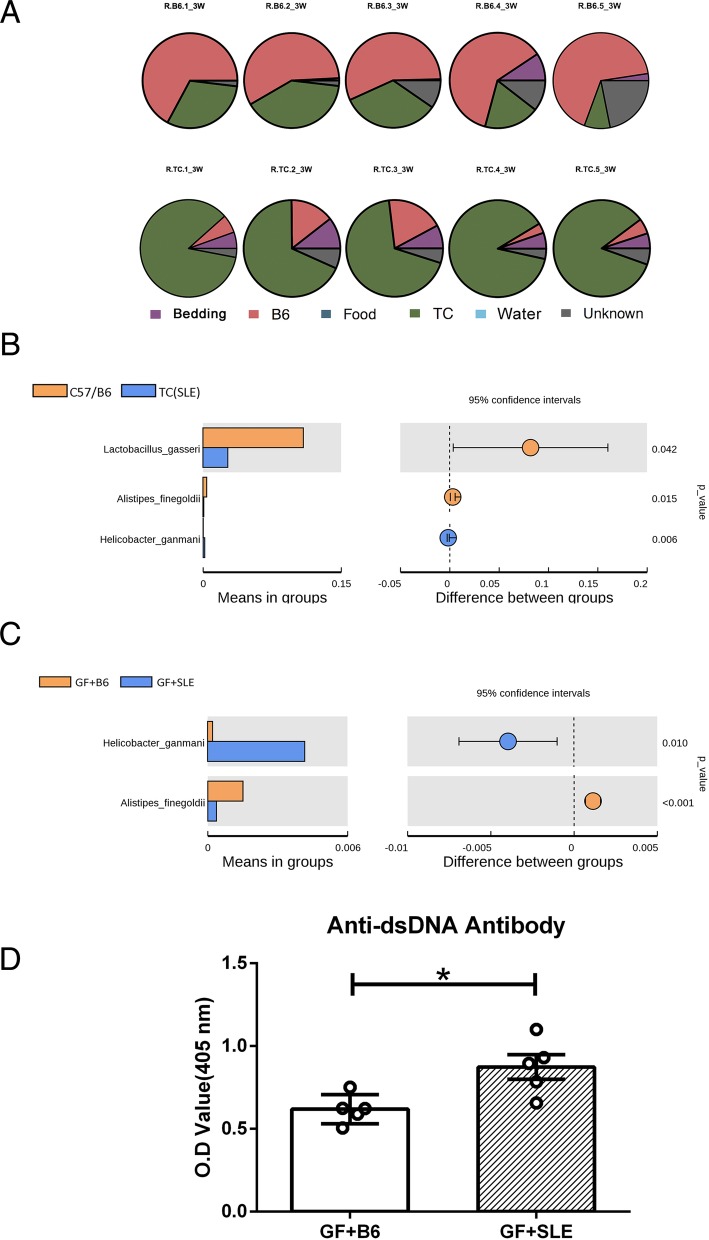
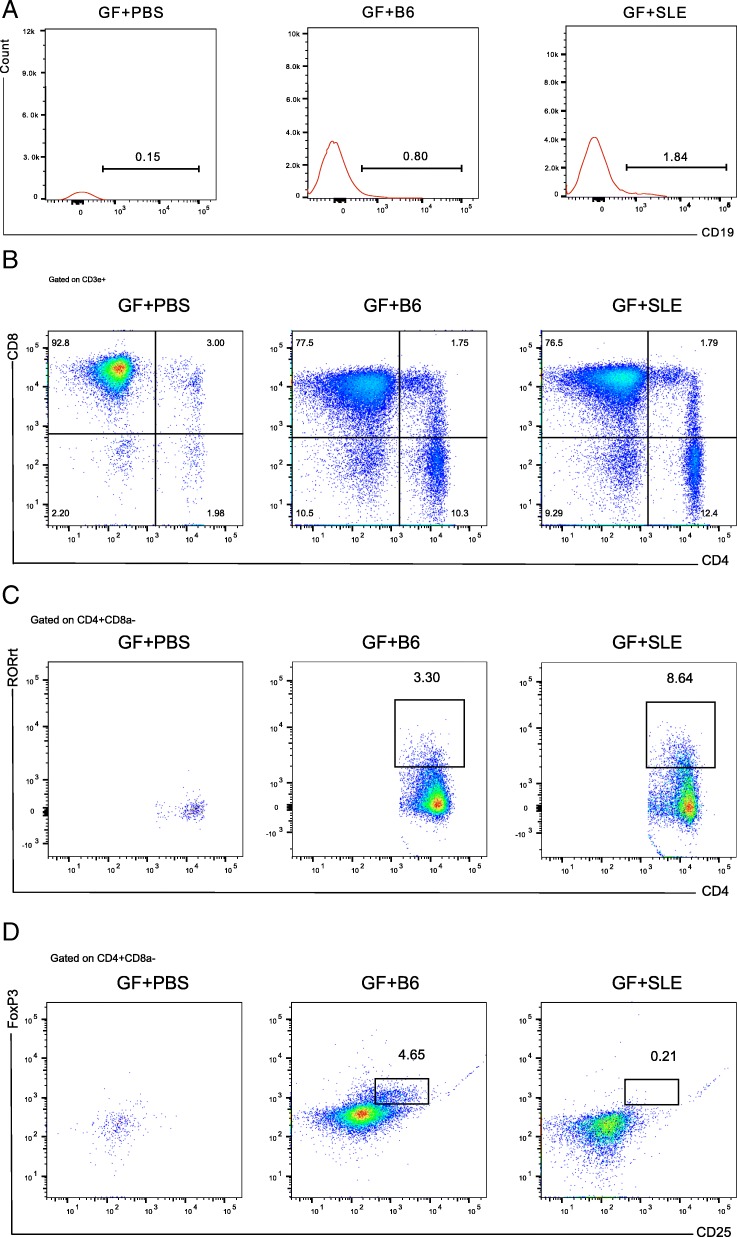
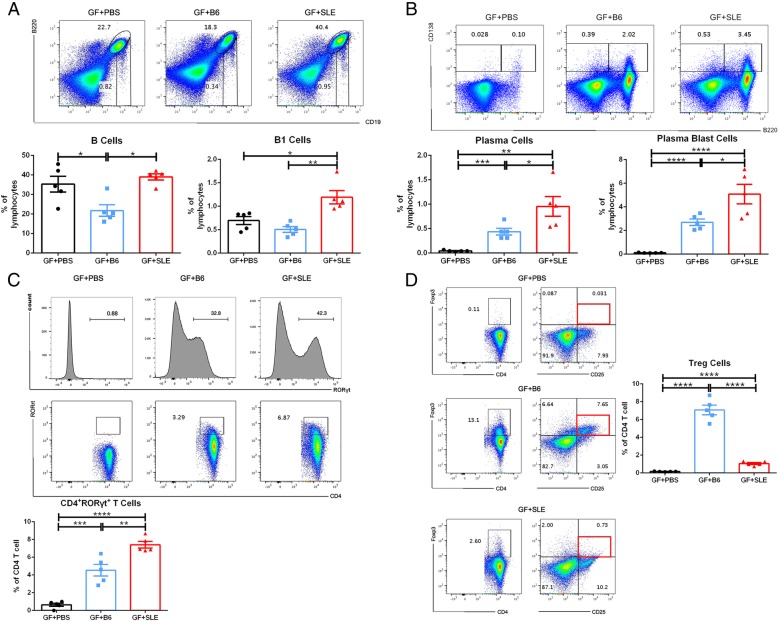
Results: The fecal microbiota of SLE mice had lower community richness and diversity than healthy mice. Fecal microbiota of recipient mice were similar to their donors. Fecal microbiome from SLE mice could lead to a significant increase of anti-dsDNA antibodies and promote the immune response in recipient mice. Our results also indicated that fecal microbiome from SLE mice resulted in significant changes in the distribution of immune cells and upregulated expression of certain lupus susceptibility genes.

Conclusions: SLE is associated with alterations of gut microbiota. Fecal microbiome from SLE mice can induce the production of anti-dsDNA antibodies in germ free mice and stimulate the inflammatory response, and alter the expression of SLE susceptibility genes in these mice.

Keywords: Fecal microbiota transplantation2; Gut microbiota1; Immune response4; Lupus susceptibility gene5; Systemic lupus erythematosus3.


Conflict of interest statement

The authors declare that they have no competing interests.

Figures

Fig. 1
Fig. 1
Establishment of the diseased SLE model and analysis of gut microbiota in SLE mice and C57/B6 mice. (A) Anti-dsDNA antibody titers in TC (SLE) mice and C57/B6 mice (11 mice per group). (B-F) Feces of each group were collected for analysis of bacterial 16S DNA from the colorectum and determination of the (B) ACE index and (C) Chao1 index, *P < 0.05, **P < 0.01. (D) Comparison of observed species comparison between groups. *P < 0.05. (E) Unique and shared microbiota of the two groups (Venn diagram). (F) LDA scores for different bacterial taxa of the two groups (p, phylum; c, class; o, order; f, family; g, genus)
Fig. 2
Fig. 2
Effect of FMT from control mice and SLE mice into GF mice. (A) SourceTracker results of recipient mice (5 mice per group). The first row shows the result of each mouse in the GF + B6 group and the second row shows the result of each mouse in the GF + SLE group. (B) Significantly different species in the SLE group and C57/B6 group (11 mice per group; left); difference in mean proportions between the groups, P-values, and 95% confidence intervals (right). 16 s rRNA gene sequences were assigned to the species level based on greater than 97% identity to reference sequences (see Materials and methods). (C) Significantly different species in the GF + SLE group and the GF + B6 group (5 mice per group); difference in mean proportions between the groups, P-values, and 95% confidence intervals (right). (D)Anti-dsDNA antibody titers of mice in the GF + SLE group and the GF + B6 group (5 mice per group). Data represent one of three independent experiments, and error bars represent means ± SEMs
Fig. 3
Fig. 3
Flow cytometry analysis of the distribution of lymphocytes in the lamina propria of GF + PBS mice, GF + B6 mice and GF + SLE mice. (a) Histograms of CD19+ B cells. The number is the percentage of CD19+ B cells of live cells. The red histograms show CD19+ cells of live cells. The right statistical results show percentages of B cells in groups (5 mice per group). (b) Plots represent CD4+ CD8a T cells (left) and the percentages of CD4+ CD8a T cells in 3 groups (5 mice per group; right). (c) Plots represent CD4+ RORγt + T cells (left) and percentages of CD4+ RORγt + cells in 3 groups (5 mice per group; right). (d) Plots represent regulatory T cells (Tregs; left) and percentages of Treg cells in 3 groups (5 mice per group; right). Data represent one of three independent experiments. A Mann-Whitney t-test was used to compare groups, and error bars represent means ± SEMs. *P < 0.05, **P < 0.01, ***P < 0.001, ****P < 0.0001
Fig. 4
Fig. 4
Flow cytometry analysis of the distribution of lymphocytes in the spleens of GF + PBS mice, GF + B6 mice and GF + SLE mice. (A) Plots of B cells and B1 cells (top) and percentages of B cells and B1 cells (5 mice per group, bottom). (B) Plots of plasma cells (PCs) and plasma blast cells (PBs; top) and percentages of PCs and PBs (5 mice per group; bottom). (C) Histograms of RORγt+ cells to identify the gate strategy. The number inside the histogram is the percentage of RORγt+ cells as of live cells (top); Plots of CD4+RORγt+T cells gated on CD3e+CD4+ T cells (middle); and percentages of CD4+RORrt+ T cells (5 mice per group). (D) Plots regulatory T cells (Tregs, left) and percentages of Tregs in 3 groups (5 mice per group; right). Data represent one of three independent experiments. A Mann-Whitney t-test was used to compare groups, and error bars represent means ± SEMs. *P < 0.05, **P < 0.01, ***P < 0.001, ****P < 0.0001
Fig. 5
Fig. 5
Differential expression of genes (DEGs) in the intestines of GF mice after different treatments. (A) Comparison of the GF + SLE and the GF + PBS groups. (B) Comparison of the GF + SLE and GF + B6 groups. (C) Biological process enrichment of the GF + SLE group relative to the GF + PBS group. (D) Biological process enrichment of the GF + SLE group relative to the GF + B6 group. (E) Gene ortholog (GO) enrichment of the GF + SLE group relative to the GF + B6 group. * beside the bar represents significant difference between groups
Fig. 6
Fig. 6
Expression of two major SLE susceptibility genes in GF + PBS mice, GF + B6 mice, and GF + SLE mice. (A) IRF7 (4 mice per group). (B) CSK (4 mice per group). A Mann-Whitney t-test was used to compare the two groups. Error bars represent means ± SEMs. *P < 0.05, **P < 0.01

References

    1. Abreu MT. Toll-like receptor signalling in the intestinal epithelium: how bacterial recognition shapes intestinal function. Nat Rev Immunol. 2010;10(2):131–144. doi: 10.1038/nri2707. - DOI - PubMed
    1. Azzouz D, Omarbekova A, Heguy A, Schwudke D, Gisch N, Rovin BH, et al. Lupus nephritis is linked to disease-activity associated expansions and immunity to a gut commensal. Ann Rheum Dis. 2019;78(7):947–956. doi: 10.1136/annrheumdis-2018-214856. - DOI - PMC - PubMed
    1. Backhed F, Ley RE, Sonnenburg JL, Peterson DA, Gordon JI. Host-bacterial mutualism in the human intestine. Science. 2005;307(5717):1915–1920. doi: 10.1126/science.1104816. - DOI - PubMed
    1. Ball RJ, Avenell A, Aucott L, Hanlon P, Vickers MA. Systematic review and meta-analysis of the sero-epidemiological association between Epstein-Barr virus and rheumatoid arthritis. Arthritis Res Ther. 2015;17:274. doi: 10.1186/s13075-015-0755-6. - DOI - PMC - PubMed
    1. Bassolas-Molina H, Raymond E, Labadia M, Wahle J, Ferrer-Picon E, Panzenbeck M, et al. An RORgammat Oral inhibitor modulates IL-17 responses in peripheral blood and intestinal mucosa of Crohn's disease patients. Front Immunol. 2018;9:2307. doi: 10.3389/fimmu.2018.02307. - DOI - PMC - PubMed

Publication types

MeSH terms