

Temporal trends analysis of tuberculosis morbidity in mainland China from 1997 to 2025 using a new SARIMA-NARNNX hybrid model
- PMID: 31371283
- PMCID: PMC6678063
- DOI: 10.1136/bmjopen-2018-024409
Temporal trends analysis of tuberculosis morbidity in mainland China from 1997 to 2025 using a new SARIMA-NARNNX hybrid model
Abstract
Objective: Tuberculosis (TB) remains a major deadly threat in mainland China. Early warning and advanced response systems play a central role in addressing such a wide-ranging threat. The purpose of this study is to establish a new hybrid model combining a seasonal autoregressive integrated moving average (SARIMA) model and a non-linear autoregressive neural network with exogenous input (NARNNX) model to understand the future epidemiological patterns of TB morbidity.
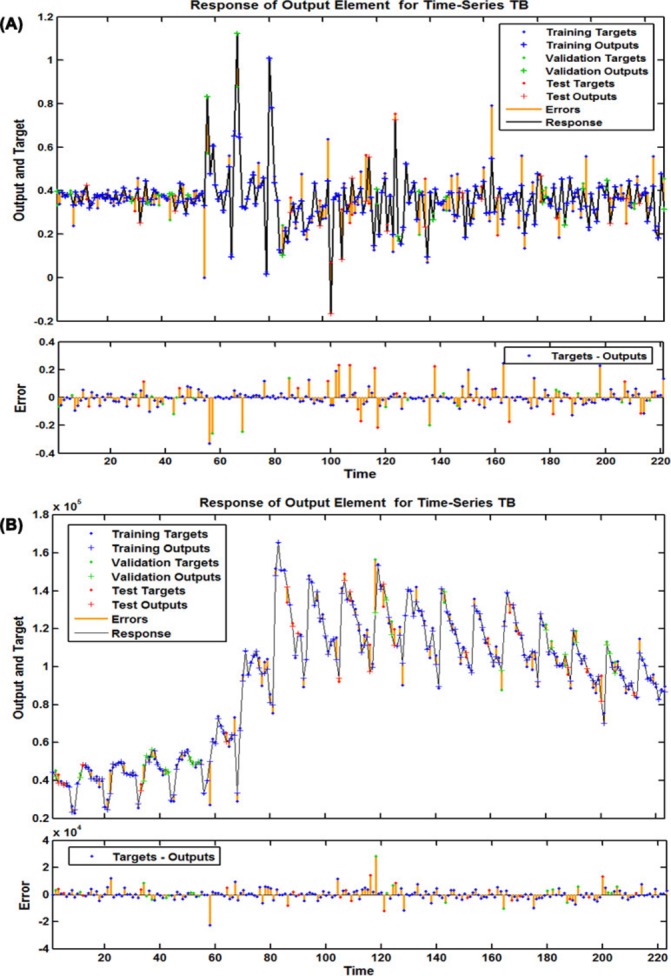
Methods: We develop a SARIMA-NARNNX hybrid model for forecasting future levels of TB incidence based on data containing 255 observations from January 1997 to March 2018 in mainland China, and the ultimate simulating and forecasting performances were compared with the basic SARIMA, non-linear autoregressive neural network (NARNN) and error-trend-seasonal (ETS) approaches, as well as the SARIMA-generalised regression neural network (GRNN) and SARIMA-NARNN hybrid techniques.
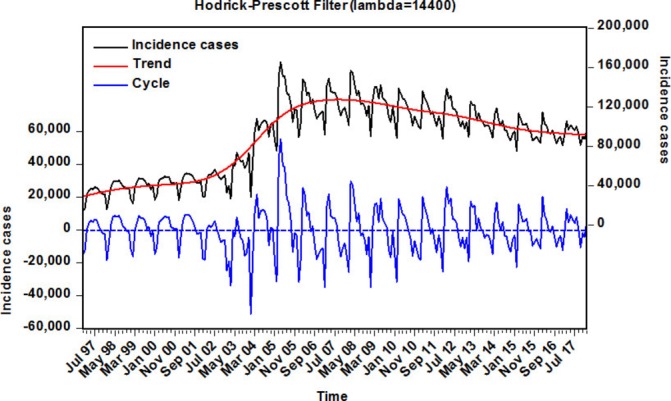
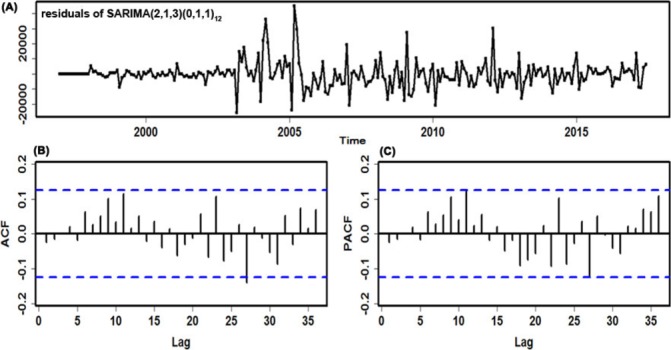
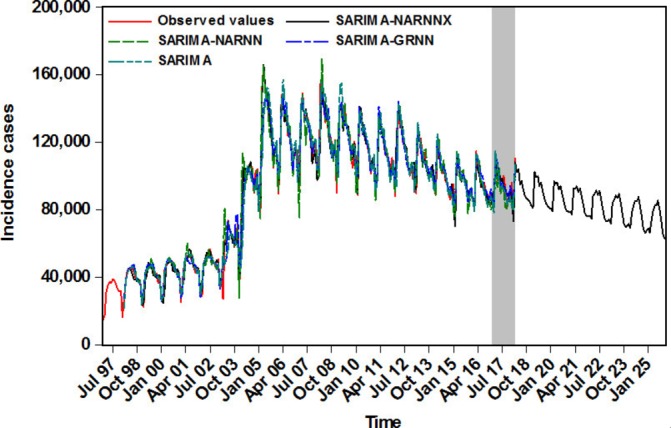
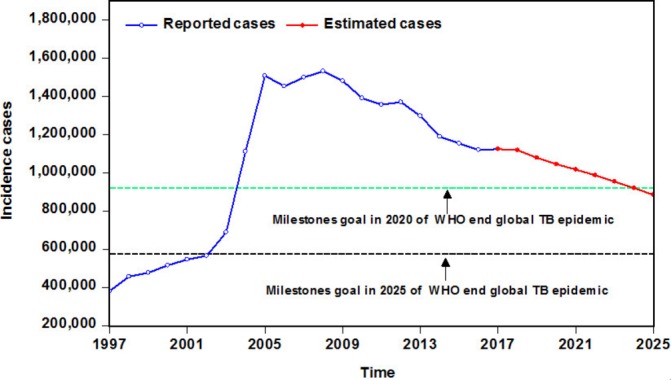
Results: In terms of the root mean square error, mean absolute error, mean error rate and mean absolute percentage error, the identified best-fitting SARIMA-NARNNX combined model with 17 hidden neurons and 4 feedback delays had smaller values in both in-sample simulating scheme and the out-of-sample forecasting scheme than the preferred single SARIMA(2,1,3)(0,1,1)12 model, a NARNN with 19 hidden neurons and 6 feedback delays and ETS(M,A,A), and the best-performing SARIMA-GRNN and SARIMA-NARNN models with 32 hidden neurons and 6 feedback delays. Every year, there was an obvious high-risk season for the notified TB cases in March and April. Importantly, the epidemic levels of TB from 2006 to 2017 trended slightly downward. According to the projection results from 2018 to 2025, TB incidence will continue to drop by 3.002% annually but will remain high.
Conclusions: The new SARIMA-NARNNX combined model visibly outperforms the other methods. This hybrid model should be used for forecasting the long-term epidemic patterns of TB, and it may serve as a beneficial and effective tool for controlling this disease.
Keywords: forecasting; models; statistics; tuberculosis.
© Author(s) (or their employer(s)) 2019. Re-use permitted under CC BY-NC. No commercial re-use. See rights and permissions. Published by BMJ.
Conflict of interest statement
Competing interests: None declared.
Figures
Similar articles
-
An Advanced Data-Driven Hybrid Model of SARIMA-NNNAR for Tuberculosis Incidence Time Series Forecasting in Qinghai Province, China.Infect Drug Resist. 2020 Mar 24;13:867-880. doi: 10.2147/IDR.S232854. eCollection 2020. Infect Drug Resist. 2020. PMID: 32273731 Free PMC article.
-
Forecasting the Tuberculosis Incidence Using a Novel Ensemble Empirical Mode Decomposition-Based Data-Driven Hybrid Model in Tibet, China.Infect Drug Resist. 2021 May 25;14:1941-1955. doi: 10.2147/IDR.S299704. eCollection 2021. Infect Drug Resist. 2021. PMID: 34079304 Free PMC article.
-
Time-series analysis of tuberculosis from 2005 to 2017 in China.Epidemiol Infect. 2018 Jun;146(8):935-939. doi: 10.1017/S0950268818001115. Epub 2018 Apr 30. Epidemiol Infect. 2018. PMID: 29708082 Free PMC article.
-
Forecasting tuberculosis incidence: a review of time series and machine learning models for prediction and eradication strategies.Int J Environ Health Res. 2024 Jun 25:1-16. doi: 10.1080/09603123.2024.2368137. Online ahead of print. Int J Environ Health Res. 2024. PMID: 38916208 Review.
-
Forecasting of Indian tourism industry using modeling approach.MethodsX. 2024 Apr 19;12:102723. doi: 10.1016/j.mex.2024.102723. eCollection 2024 Jun. MethodsX. 2024. PMID: 38660034 Free PMC article. Review.
Cited by
-
Forecasting of Milk Production in Northern Thailand Using Seasonal Autoregressive Integrated Moving Average, Error Trend Seasonality, and Hybrid Models.Front Vet Sci. 2021 Nov 30;8:775114. doi: 10.3389/fvets.2021.775114. eCollection 2021. Front Vet Sci. 2021. PMID: 34917670 Free PMC article.
-
An Advanced Data-Driven Hybrid Model of SARIMA-NNNAR for Tuberculosis Incidence Time Series Forecasting in Qinghai Province, China.Infect Drug Resist. 2020 Mar 24;13:867-880. doi: 10.2147/IDR.S232854. eCollection 2020. Infect Drug Resist. 2020. PMID: 32273731 Free PMC article.
-
Predictive analysis of the number of human brucellosis cases in Xinjiang, China.Sci Rep. 2021 Jun 1;11(1):11513. doi: 10.1038/s41598-021-91176-5. Sci Rep. 2021. PMID: 34075198 Free PMC article.
-
Forecasting the incidence of mumps in Chongqing based on a SARIMA model.BMC Public Health. 2021 Feb 17;21(1):373. doi: 10.1186/s12889-021-10383-x. BMC Public Health. 2021. PMID: 33596871 Free PMC article.
-
Evaluating the impact of COVID-19 outbreak on hepatitis B and forecasting the epidemiological trend in mainland China: a causal analysis.BMC Public Health. 2024 Jan 2;24(1):47. doi: 10.1186/s12889-023-17587-3. BMC Public Health. 2024. PMID: 38166922 Free PMC article.
References
-
- WHO. Global tuberculosis report 2018. http://www.who.int/tb/publications/global_report/en/ (Accessed on 4 Dec 2018).
Publication types
MeSH terms
LinkOut - more resources
Full Text Sources
Medical
Miscellaneous