. 2019 Nov 1;25(21):6532-6545.
doi: 10.1158/1078-0432.CCR-19-0498. Epub 2019 Aug 1.

BRN4 Is a Novel Driver of Neuroendocrine Differentiation in Castration-Resistant Prostate Cancer and Is Selectively Released in Extracellular Vesicles with BRN2

Affiliations

BRN4 Is a Novel Driver of Neuroendocrine Differentiation in Castration-Resistant Prostate Cancer and Is Selectively Released in Extracellular Vesicles with BRN2

Divya Bhagirath et al. Clin Cancer Res. .

Abstract

Purpose: Neuroendocrine prostate cancer (NEPC), an aggressive variant of castration-resistant prostate cancer (CRPC), often emerges after androgen receptor-targeted therapies such as enzalutamide or de novo, via trans-differentiation process of neuroendocrine differentiation. The mechanistic basis of neuroendocrine differentiation is poorly understood, contributing to lack of effective predictive biomarkers and late disease recognition. The purpose of this study was to examine the role of novel proneural Pit-Oct-Unc-domain transcription factors (TF) in NEPC and examine their potential as noninvasive predictive biomarkers.Experimental Design: Prostate cancer patient-derived xenograft models, clinical samples, and cellular neuroendocrine differentiation models were employed to determine the expression of TFs BRN1 and BRN4. BRN4 levels were modulated in prostate cancer cell lines followed by functional assays. Furthermore, extracellular vesicles (EV) were isolated from patient samples and cell culture models, characterized by nanoparticle tracking analyses, Western blotting, and real-time PCR.

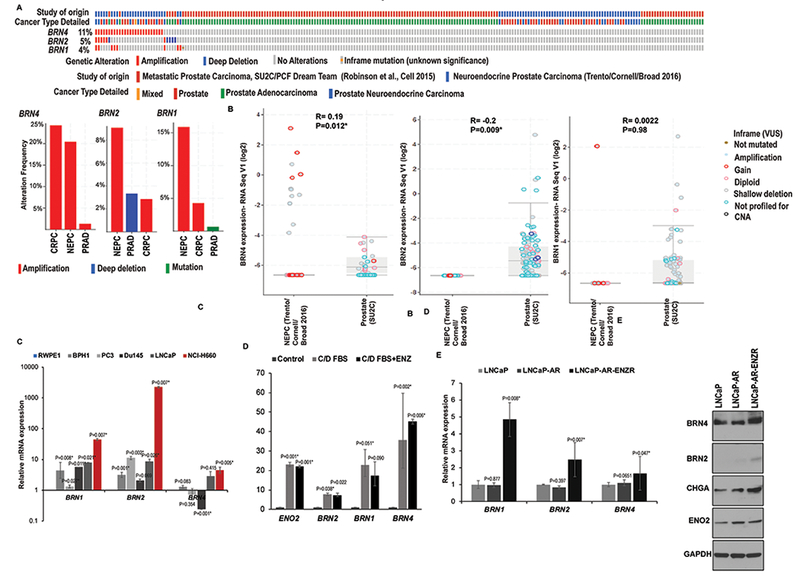
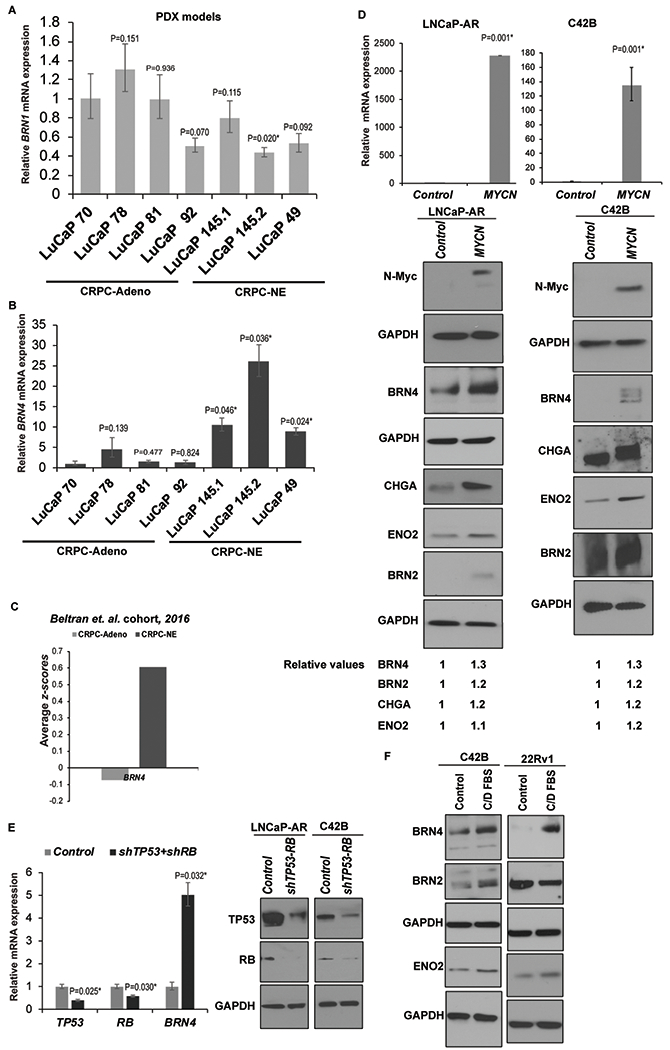
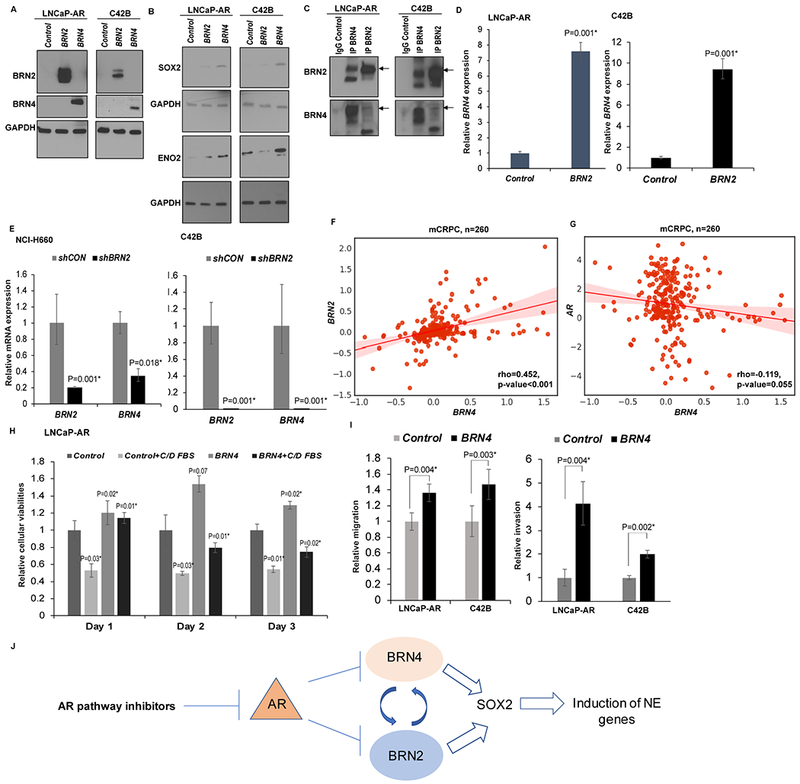
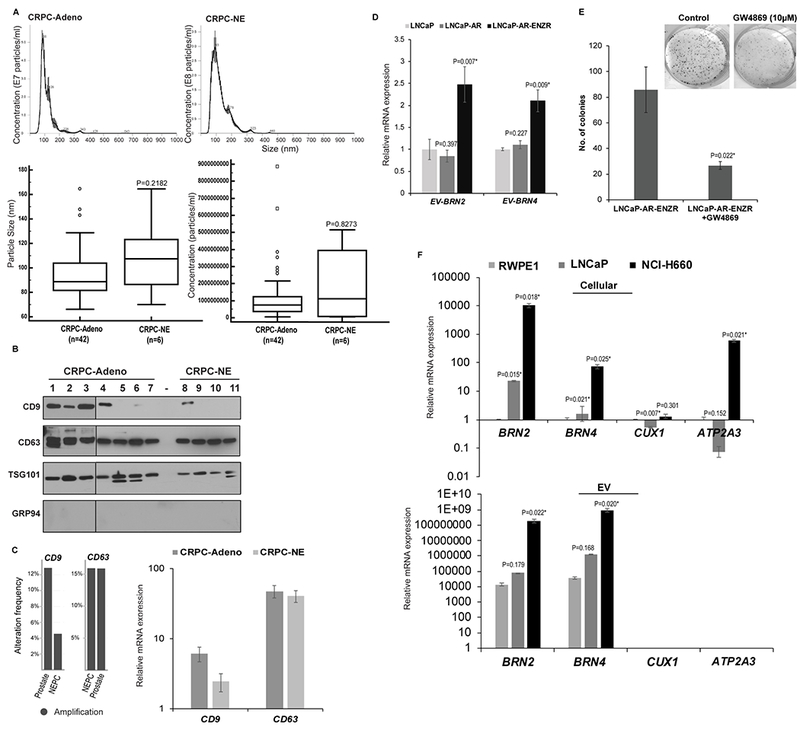
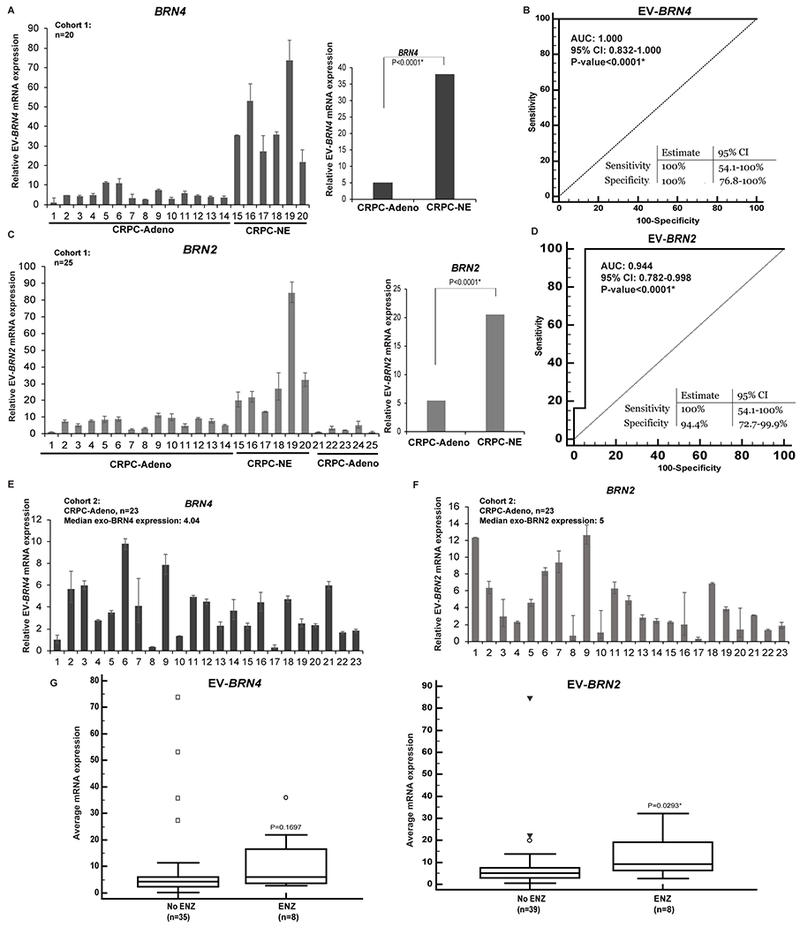
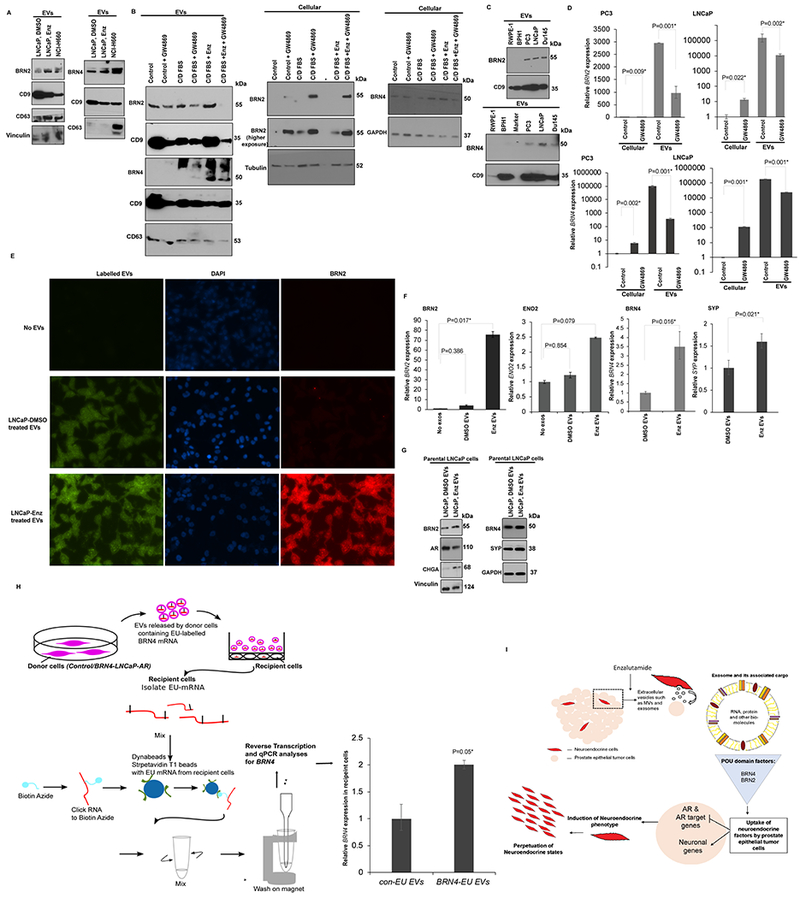
Results: We identify for the first time that: (i) BRN4 is amplified and overexpressed in NEPC clinical samples and that BRN4 overexpression drives neuroendocrine differentiation via its interplay with BRN2, a TF that was previously implicated in NEPC; (ii) BRN4 and BRN2 mRNA are actively released in prostate cancer EVs upon neuroendocrine differentiation induction; and (iii) enzalutamide treatment augments release of BRN4 and BRN2 in prostate cancer EVs, promoting neuroendocrine differentiation induction.

Conclusions: Our study identifies a novel TF that drives NEPC and suggests that as adaptive mechanism to enzalutamide treatment, prostate cancer cells express and secrete BRN4 and BRN2 in EVs that drive oncogenic reprogramming of prostate cancer cells to NEPC. Importantly, EV-associated BRN4 and BRN2 are potential novel noninvasive biomarkers to predict neuroendocrine differentiation in CRPC.


Conflict of interest statement

Conflicts of interest: The authors declare no potential conflicts of interest

Figures

Fig. 1
Fig. 1. POU-domain TFs BRN1 and BRN4 are highly expressed in neuroendocrine PCa cell line models and enzalutamide resistant cells
A. Genomic alterations in Class III POU-domain genes in prostate neuroendocrine carcinomas (CRPC-NE), mixed small cell carcinoma-adenocarcinomas and adenocarcinomas in SUC2C/PCF Dream Team (38) and Beltran et al (11) cohorts as analyzed by cBioPortal. Lower panel shows the relative frequencies of these alterations in PRAD, CRPC and NEPC cases within these two cohorts. B. Correlation analyses of BRN1, BRN2 and BRN4 mRNA and CNAs in the two cohorts. C. Relative mRNA levels of BRN1, BRN2 and BRN4 in normal immortalized prostate epithelial cell line (RWPE-1), benign non-transformed prostate epithelial cell line (BPH1) and PCa cell lines (PC3, Du145, LNCaP and NCI-H660) as assessed by real-time PCR. Data were normalized to GAPDH control and represented as mean ± SEM. D. Relative mRNA levels of BRN11, BRN2 and BRN4 in LNCaP cells cultured in regular media (control), androgen-depleted media (C/D FBS) and 20 µM ENZ in C/D FBS media as assessed by real-time PCR. Data were normalized to GAPDH control and represented as mean ± SEM. E. Left panel: Relative mRNA levels of BRN1, BRN2 and BRN4 in LNCaP, LNCaP-AR and ENZ-resistant LNCaP-AR cells as assessed by real-time PCR. Data were normalized to GAPDH control and represented as mean ± SEM. Right panel: Western blot analyses of BRN4, BRN2 and indicated neuronal markers in LNCaP, LNCaP-AR and ENZ-resistant LNCaP-AR cells. GAPDH was used as a loading control.
Fig. 2
Fig. 2. BRN4 expression is selectively upregulated in CRPC-NE patient-derived xenograft (PDX) models, clinical samples and cell line models
A. Relative BRN1 mRNA and; B. BRN4 mRNA expression in PDX models with CRPC-Adenocarcinoma characteristics (LuCaP 70, 78, 81 and 92) vs those with CRPC-NE alterations (LuCaP 49, 145.1 and 145.2) as assessed by real-time PCR analyses. Data were normalized to GAPDH control and represented as mean ± SEM. P-values were calculated relative to LuCaP 70 PDX. C. Average z-scores for BRN4 mRNA expression in CRPC-Adeno vs CRPC-NE tissues in Beltran et al (11) cohort. D. LNCaP-AR and C42B cells were stably transfected with control/NMYC overexpression constructs followed by real time PCR analyses of NMYC mRNA (upper panel) and Western blot analyses of N-Myc, BRN4 and neuronal markers BRN2, CHGA and ENO2 (lower panels). Band intensities were quantified by Image J, relative values were calculated for indicated proteins after normalizing to corresponding GAPDH values and are represented below blots. E. Left panel: LNCaP-AR cells were transfected with control shRNA/shRNA targeting TP53 and RB1 followed by real time PCR analyses of TP53, RB and BRN4 mRNA. Right panel: Western blot analyses confirming TP53 and RB knockdown following shRNA transfections. GAPDH was used as a loading control. F. C42B and 22Rv1 cell lines were grown under androgen depleted conditions (RPMI medium with 10% C/D FBS) for 5 days followed by Western blot analyses of BRN4, BRN2 and indicated neuronal markers. GAPDH was used as a loading control.
Fig. 3
Fig. 3. BRN4 regulates SOX2 expression and controls expression of NE genes
A-B. LNCaP-AR and C42B cells were stably transfected with control/BRN2/BRN4 overexpression constructs followed by Western blot analyses of A. BRN2 and BRN4 protein levels; B. SOX2 and ENO2 protein levels. GAPDH was used as a loading control. C. LNCaP-AR and C42B cells were used to perform co-IP with control IgG, BRN4 antibody and BRN2 antibody followed by Western blot analyses for BRN2 and BRN4. D. LNCaP-AR and C42B cells were stably transfected with control/BRN2 overexpression constructs followed by real time PCR analyses of BRN4 mRNA. GAPDH was used as an endogenous control. E. NCI-H660 and C42B cells were stably transfected with control/BRN2 shRNA constructs followed by real time PCR analyses of BRN2 and BRN4 mRNA. GAPDH was used as an endogenous control. F. Correlation between BRN2 and BRN4 expression; and G. AR and BRN4 expression in PCTA (Prostate Cancer Transcriptome Analyses) dataset of mCRPC patients (n=260). H. Cellular viabilities of LNCaP-AR cells transfected with control/BRN4 grown in regular media/androgen-depleted media + ENZ. I. Transwell in vitro migration and invasion assays upon control/BRN4 expression in LNCaP-AR and C42B cell lines. J. Schematic representation showing the proposed role of BRN4 in NEPC.
Fig. 4
Fig. 4. Alterations in EV secretion pathways upon induction of neuroendocrine differentiation states in prostate cancer and release of BRN2 and BRN4 mRNA in PCa EVs upon ENZ treatment
A. EVs were isolated from sera of PCa patients with CRPC-Adeno, n=42 and CRPC-NE, n=6. Nanoparticle Tracking Analyses (NTA) of representative CRPC-Adeno (upper left panel) and CRPC-NE (upper right panel) cases showing size and concentration of isolated particles. Lower left: Average particle size and; Lower right: Particle concentration in CRPC-Adeno vs CRPC-NE cases as determined by NTA analyses. B. Western blot analyses for EV markers CD9, CD63, TSG101 and negative marker GRP94 to confirm the integrity of EVs isolated from sera of CRPC-Adeno (n=7) and CRPC-NE (n=4) cases. C. Genomic alteration frequencies (left panel) and relative mRNA expression (right panel) for CD9 and CD63 in CRPC-Adeno and CRPC-NE cases in Beltran et al (11) cohort. mRNA data is represented as mean ± SEM. D. EVs were extracted from conditioned media of LNCaP, LNCaP-AR and ENZ-R cell line followed by RNA isolation and real-time PCR based expression profiling for EV-associated BRN2 and BRN4 mRNA. Data were normalized to GAPDH control and represented as mean ± SEM. E. LNCaP-AR ENZR cell line was treated with exosome inhibitor GW4869 (20µM) for 48 hours followed by clonogenicity assay. Representative images from control/GW4869 treated cells are shown above. F. Expression of indicated genes in cellular (upper) and EV (lower) fractions from RWPE-1, LNCaP and NCI-H660 cells. Data were normalized to GAPDH control and represented as mean ± SEM.
Fig. 5
Fig. 5. EV-associated BRN4 and BRN2 are upregulated in sera from neuroendocrine PCa patients and can predict NED induction in PCa patients non-invasively
A. Relative EV-BRN4 levels in CRPC-Adeno (n=14) and CRPC-NE samples (n=4) as assessed by real-time PCR. Data were normalized to GAPDH control and represented as mean ± SEM (left). Average EV-BRN4 expression in CRPC-Adeno vs CRPC-NE cases (right). B. Receiver Operating Characteristic (ROC) curve analyses for EV-BRN4 as a parameter to discriminate between non-NE and NE cases based on dCt values in CRPC-Adeno vs CRPC-NE cases. C. Relative EV-BRN2 levels in CRPC-Adeno (n=19) and CRPC-NE samples (n=4) as assessed by real-time PCR (left). Average EV-BRN2 expression in CRPC-Adeno vs CRPC-NE cases (right). Data were normalized to GAPDH control and represented as mean ± SEM. D. ROC curve analyses for EV-BRN2 based on dCt values in CRPC-Adeno (n=19) and CRPC-NE (n=4). E. Relative EV-BRN4 levels and, F. EV-BRN2 levels in sera of cohort 2 of CRPC-Adeno patients (n=23) as assessed by real-time PCR. Data were normalized to GAPDH control and represented as mean ± SEM. G. Median EV-BRN4 (left panel) and EV-BRN2 expression (right panel) in CRPC-Adeno cases treated with/without ENZ. P-values are based on Mann-Whitney U test.
Fig. 6
Fig. 6. BRN4 and BRN2 are selectively released in PCa EVs upon NED induction that mediate neuroendocrine differentiation states in prostate cancer
A. EVs were isolated from control (DMSO)/1μM ENZ treated LNCaP cells and NCI-H660 cells and subjected to Western blot analyses for indicated proteins. B. LNCaP cells were cultured under regular conditions (control) or under androgen depleted conditions (C/D FBS) or treated with 20μM ENZ in C/D FBS media. These treatments were followed by treatment with exosome inhibitor GW4869 for 48 hrs. Cellular and EV fractions were extracted after various treatments followed by Western blot analyses for BRN2 and BRN4 in the two fractions. CD9, CD63 were used as controls for EV while tubulin/GAPDH were used as controls for cellular fractions. C. BRN2 and BRN4 protein levels in EVs derived from normal immortalized (RWPE-1)/benign prostate epithelial (BPH1) cells and PCa cell lines (PC3, LNCaP, Du145). CD9 was used as an exosomal control. D. Relative BRN2 mRNA (upper panels) and BRN4 mRNA (lower panels) expression in cellular and EV fractions of PC3 and LNCaP cell lines with/without exosome inhibitor GW4869 treatment as assessed by real time PCR. Data were normalized to Vinculin control and represented as mean ± SEM. E-G. E-G’Uptake experiment’ with labelled EVs in parental LNCaP cells. EVs were isolated from control (DMSO)/1μM ENZ treated LNCaP cells, labelled with SYTO RNA Select green fluorescent stain followed by incubation of labelled EVs (40µg/ml) with parental LNCaP cells. As a negative control, parental LNCaP cells were incubated with media with no EVs. E. Fluorescence microscopy analyses to confirm uptake of labelled EVs (green, left panels), DAPI staining (blue, middle panels) and BRN2 IF staining (red, right panels) after EV treatment. F. Relative cellular BRN2, ENO2, BRN4 and SYP expression in EV treated/control LNCaP cells as assessed by real-time PCR. Data was normalized to GAPDH control and represented as mean ± SEM. G. Western blot analyses for indicated proteins after ‘uptake assay’. Vinculin/GAPDH were used as loading controls. H. Control/BRN4 expressing LNCaP-AR cells (donor cells) were grown in the presence of 5EU for 24 hours to label nascent RNA transcripts. EVs released by donor cells after labelling were isolated, characterized and applied to parental LNCaP-AR cells (recipient, non-EU labelled) for 48 hours. Total RNA was extracted from recipient cells followed by purification of EU-labelled mRNA from recipient cells as shown schematically using Click-iT Nascent RNA Capture Kit (#C10365, ThermoFisher) following the manufacturer’s protocol. Purified labeled RNA was used for real time PCR based analyses of labelled BRN4 in recipient cells. Data was normalized to GAPDH control and represented as mean ± SEM. I. Schematic representation depicting proposed role of EV-associated BRN4 and BRN2 in inducing reprogramming in PCa cells to NE states. We propose that as an adaptive mechanism to androgen deprivation conditions/ENZ treatment, PCa cells express and secrete BRN2 and BRN4 in EVs/exosomes that in turn, drives oncogenic reprogramming of PCa cells. We propose that these reprogramming TFs are selectively sorted into PCa EVs/exosomes upon NED induction that mediates intercellular communication between PCa cells leading to perpetuation of NE states. EV-associated BRN2 and BRN4 are taken up by neighboring ‘non-NE’ PCa epithelial cells leading to suppression of AR and AR target genes and induction of neuronal genes.

Similar articles

Cited by

References

    1. Siegel RL, Miller KD, Jemal A. Cancer statistics, 2019. CA Cancer J Clin 2019;69(1):7–34 doi 10.3322/caac.21551. - DOI - PubMed
    1. Knudsen KE, Scher HI. Starving the addiction: new opportunities for durable suppression of AR signaling in prostate cancer. Clin Cancer Res 2009;15(15):4792–8 doi 10.1158/1078-0432.CCR-08-2660. - DOI - PMC - PubMed
    1. Shen MM, Abate-Shen C. Molecular genetics of prostate cancer: new prospects for old challenges. Genes Dev 2010;24(18):1967–2000 doi 10.1101/gad.1965810. - DOI - PMC - PubMed
    1. Scher HI, Fizazi K, Saad F, Taplin ME, Sternberg CN, Miller K, et al. Increased survival with enzalutamide in prostate cancer after chemotherapy. N Engl J Med 2012;367(13):1187–97 doi 10.1056/NEJMoa1207506. - DOI - PubMed
    1. Watson PA, Arora VK, Sawyers CL. Emerging mechanisms of resistance to androgen receptor inhibitors in prostate cancer. Nat Rev Cancer 2015;15(12):701–11 doi 10.1038/nrc4016. - DOI - PMC - PubMed

Publication types

MeSH terms