. 2020 Apr;105(4):971-986.
doi: 10.3324/haematol.2018.194910. Epub 2019 Aug 1.

Leprosy drug clofazimine activates peroxisome proliferator-activated receptor-γ and synergizes with imatinib to inhibit chronic myeloid leukemia cells

Affiliations

Leprosy drug clofazimine activates peroxisome proliferator-activated receptor-γ and synergizes with imatinib to inhibit chronic myeloid leukemia cells

Harish Kumar et al. Haematologica. 2020 Apr.

Abstract

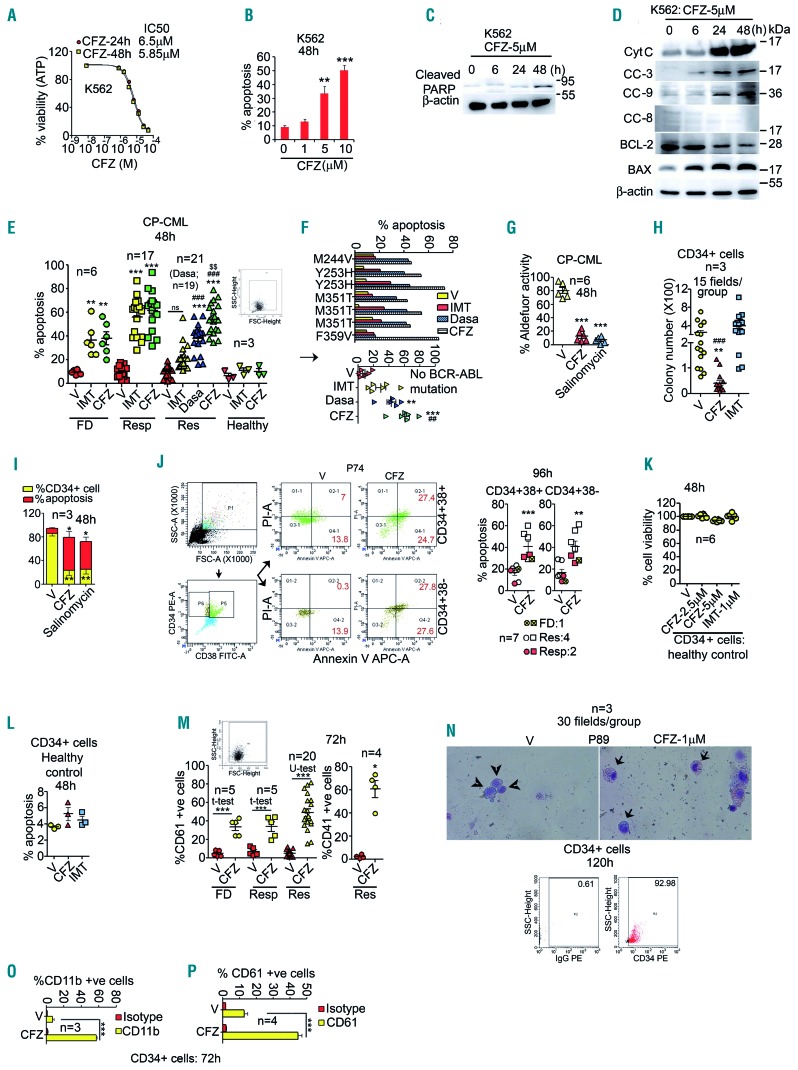
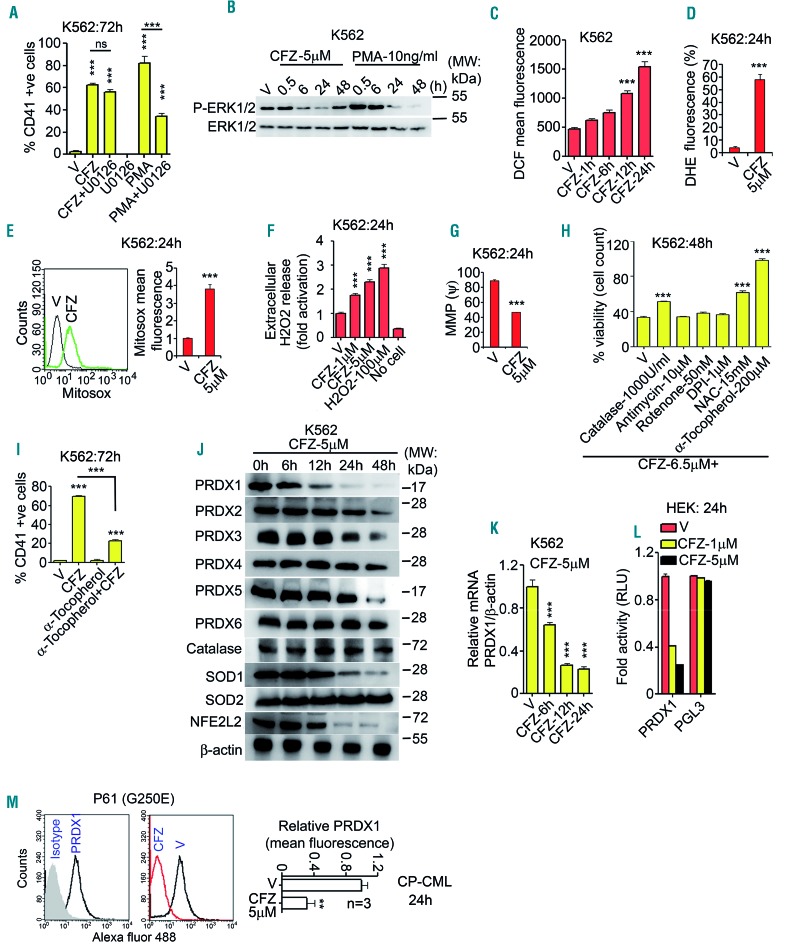
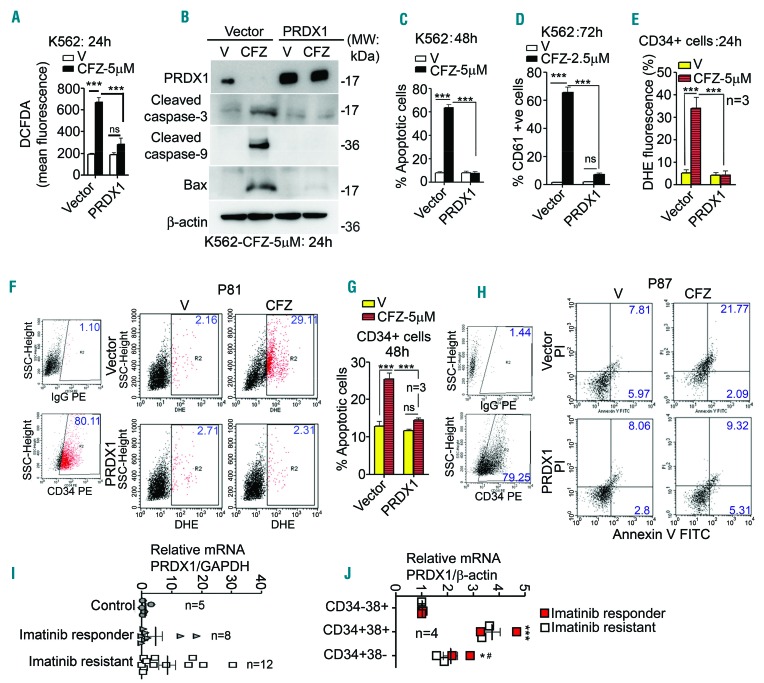
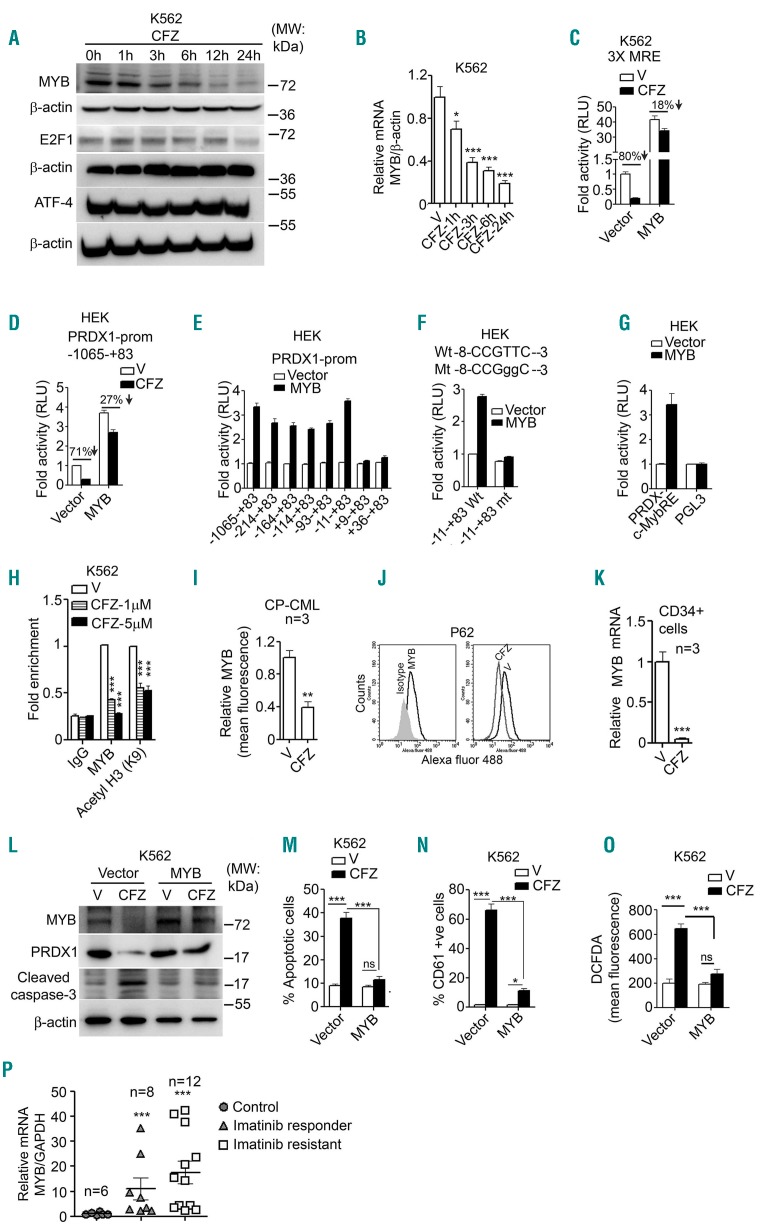
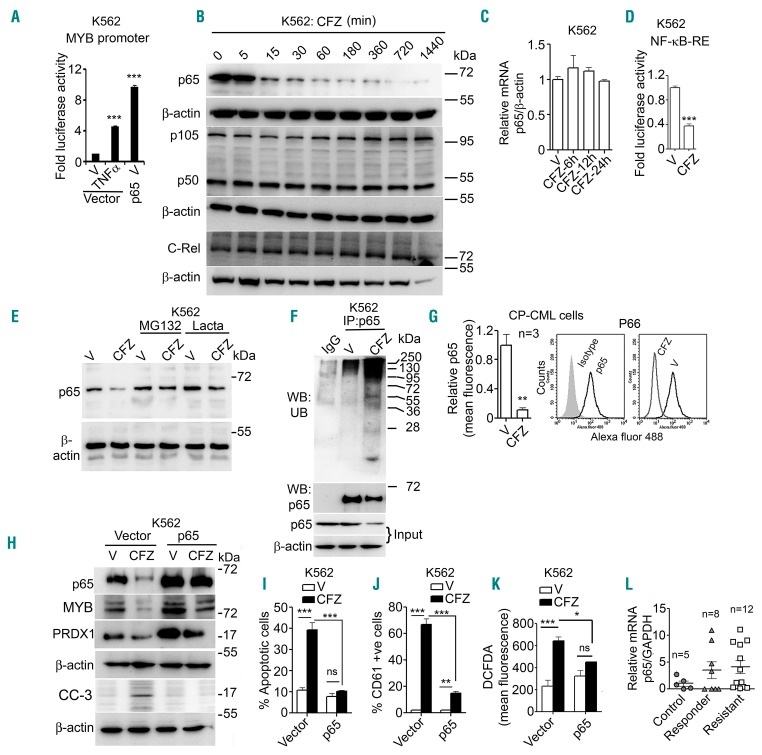
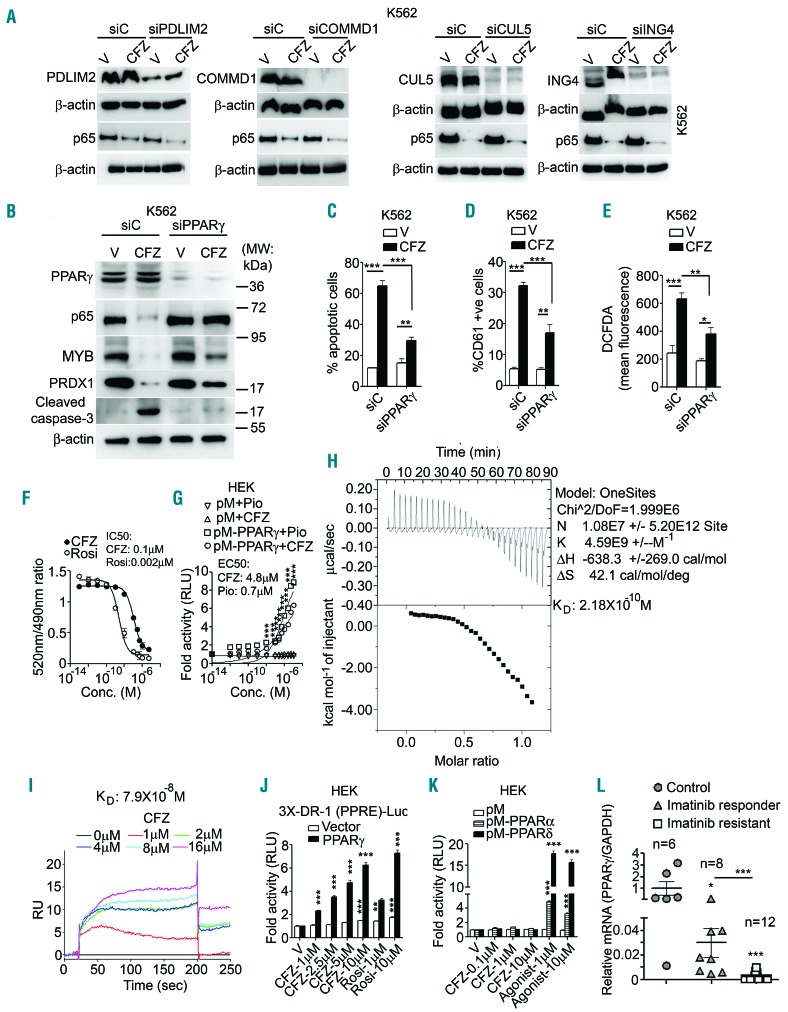
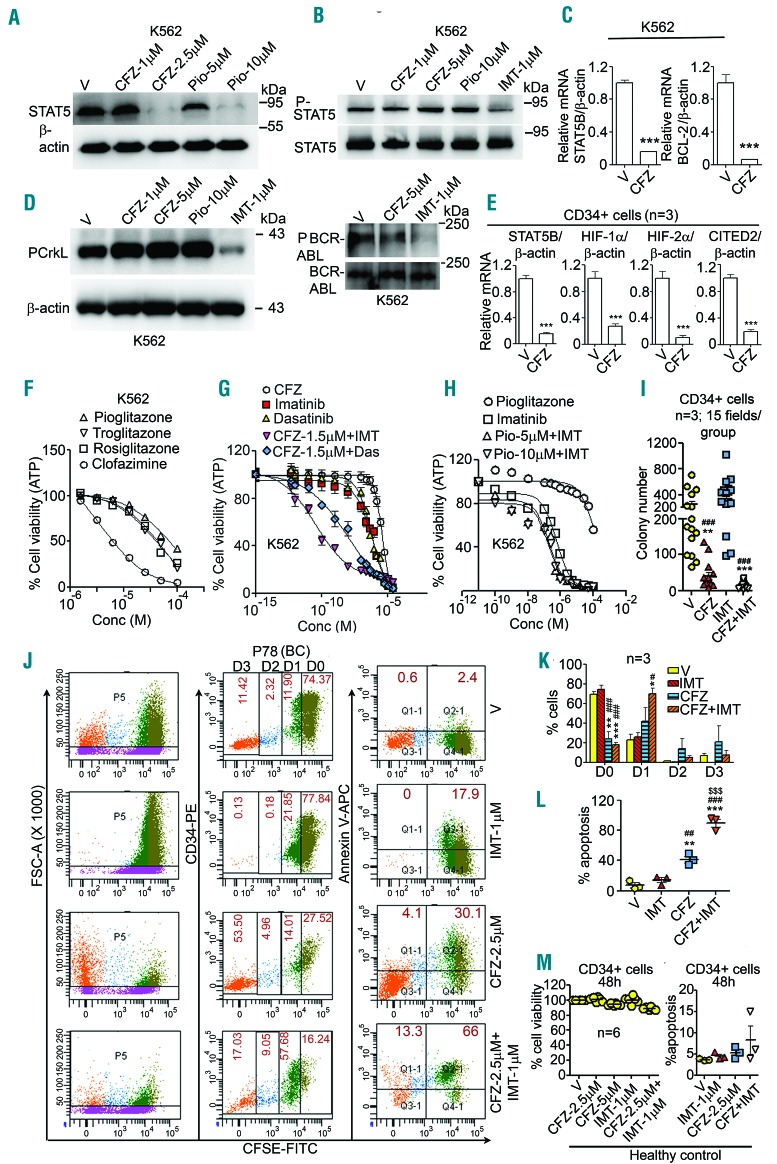
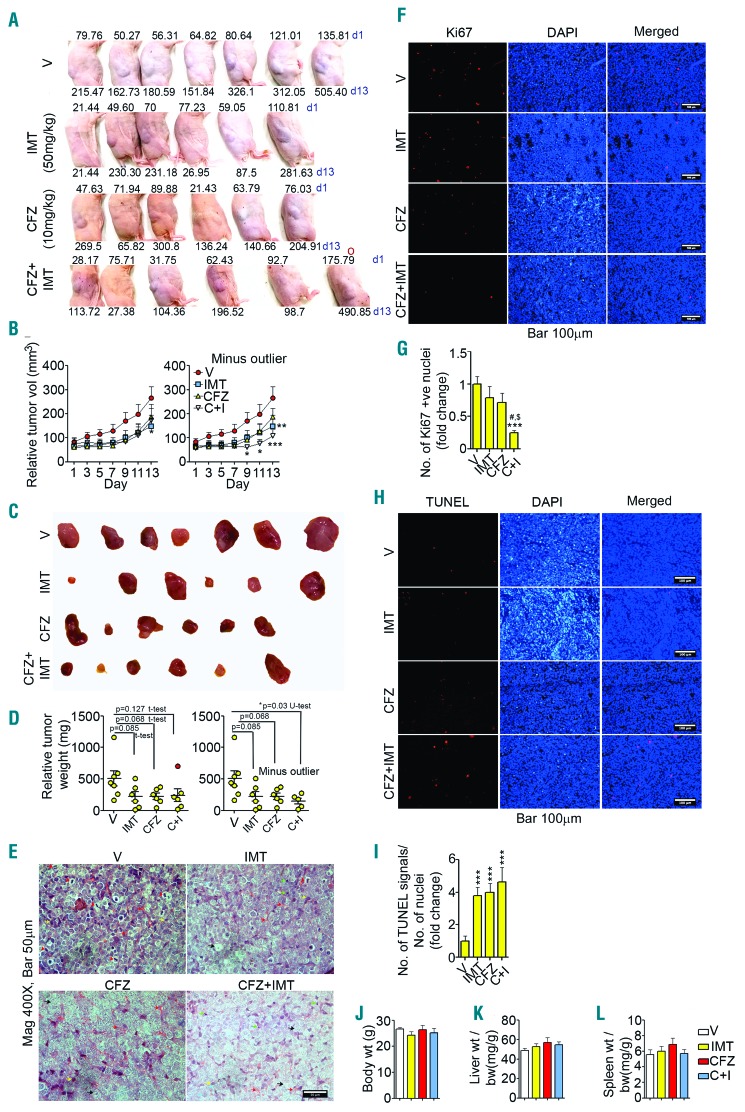
Leukemia stem cells contribute to drug-resistance and relapse in chronic myeloid leukemia (CML) and BCR-ABL1 inhibitor monotherapy fails to eliminate these cells, thereby necessitating alternate therapeutic strategies for patients CML. The peroxisome proliferator-activated receptor-γ (PPARγ) agonist pioglitazone downregulates signal transducer and activator of transcription 5 (STAT5) and in combination with imatinib induces complete molecular response in imatinib-refractory patients by eroding leukemia stem cells. Thiazolidinediones such as pioglitazone are, however, associated with severe side effects. To identify alternate therapeutic strategies for CML we screened Food and Drug Administration-approved drugs in K562 cells and identified the leprosy drug clofazimine as an inhibitor of viability of these cells. Here we show that clofazimine induced apoptosis of blood mononuclear cells derived from patients with CML, with a particularly robust effect in imatinib-resistant cells. Clofazimine also induced apoptosis of CD34+38- progenitors and quiescent CD34+ cells from CML patients but not of hematopoietic progenitor cells from healthy donors. Mechanistic evaluation revealed that clofazimine, via physical interaction with PPARγ, induced nuclear factor kB-p65 proteasomal degradation, which led to sequential myeloblastoma oncoprotein and peroxiredoxin 1 downregulation and concomitant induction of reactive oxygen species-mediated apoptosis. Clofazimine also suppressed STAT5 expression and consequently downregulated stem cell maintenance factors hypoxia-inducible factor-1α and -2α and Cbp/P300 interacting transactivator with Glu/Asp-rich carboxy-terminal domain 2 (CITED2). Combining imatinib with clofazimine caused a far superior synergy than that with pioglitazone, with clofazimine reducing the half maximal inhibitory concentration (IC50) of imatinib by >4 logs and remarkably eroding quiescent CD34+ cells. In a K562 xenograft study clofazimine and imatinib co-treatment showed more robust efficacy than the individual treatments. We propose clinical evaluation of clofazimine in imatinib-refractory CML.


Figures

Figure 1.
Figure 1.
Clofazimine induces apoptosis and differentiation in K562 and chronic phase chronic myeloid leukemia cells and reduces leukemia stem cell load. (A, B) Clofazimine (CFZ) reduces K562 cell viability and induces apoptosis. (A) CFZ dose response, as determined by a CellTiter-Glo assay. (B) Apoptosis (n=3; representative dot plot in Online Supplementary Figure S1B). (C) Poly (ADP-ribose) polymerase cleavage in K562 cells. (D) CFZ induces cytochrome C release, caspase cleavage, BAX expression and suppresses BCL-2 in K562 cells. (E, F) CFZ (all drugs 5 μM) induces apoptosis in chronic phase chronic myeloid leukemia (CP-CML) cells (annexin/propidium iodide (PI) staining; dot plots in Online Supplementary Figure S1D). (F) Percentage apoptosis in cells from imatinib-resistant patients in Figure 1E, harboring the indicated BCR-ABL1 mutations (upper panel) and CP-CML cells in which no BCR-ABL1 mutations were detected (lower panel). (G) CFZ (or salinomycin; both at a concentration of 5 µM) reduced aldehyde dehydrogenase activity, determined by percentage aldefluor activity in CP-CML cells (dot plots in Online Supplementary Figure S2A). (H) CFZ reduces the number of colony-forming cells in soft agar (images in Online Supplementary Figure S2C; imatinib 1 μM, CFZ 2.5 μM). (I, J) CFZ induces apoptosis in CP-CML CD34+ cells. (I) CD34+ cells from imatinib-resistant patients were isolated using a CD34 microbead kit (Miltenyi Biotech) and were treated with 5 μM CFZ or salinomycin for 48 h. Cells were then divided into two groups. One group was assessed by immunostaining for CD34 and the other group was stained with annexin V/PI and the cells were then analyzed by flow cytometry (dot plots in Online Supplementary Figure S2B). (J) The CD34+ population from imatinib-resistant CP-CML cells was treated with CFZ (2.5 μM) for 96 h, stained with anti-CD34 and anti-CD38 antibodies and assessed for apoptosis. (K, L) CFZ does not affect viability of hematopoietic progenitors from healthy controls. (K) Cell viability, determined by a CellTiter-Glo assay. (L) Apoptosis by annexin V staining (dot plots in Online Supplementary Figure S2D). (M) CFZ (1 μM) induces CD61 and CD41 in CP-CML cells (dot plots in Online Supplementary Figure S4E, F). (N) CFZ induces monocyte-like morphology in CD34+ cells (cropped images shown; corresponding original images in Online Supplementary Figure S4G). (O, P) CFZ (1 μM) induces CD11b (O) and CD61 (P) in CD34+ CP-CML cells (histograms in Online Supplementary Figure S4H). Graphs illustrate the mean ± standard error mean. *P<0.05, **P<0.01, ***P<0.001; one-way analysis of variance followed by the Bonferroni post-test (except J, O, P; unpaired two-tailed t-test, H; Kruskal-Wallis test followed by the Dunn test, M; left panel, as indicated and right panel; Mann-Whitney U test). *Vehicle vs. treatment, #imatinib vs. other treatments, $dasatinib vs. CFZ. Microscopic images; n=3 (Leica DMI6000B, 30 fields/group). Blots are representative of three independent experiments (all full blots in Online Supplementary Figure S14). A letter P followed by a number (in N and subsequent figures) designates the patient’s identity. PARP: poly (ADP-ribose) polymerase; Cyt C: cytochrome C; CC; cleaved caspase; V: vehicle; IMT; imatinib; Dasa; dasatinib; FD; freshly diagnosed, Resp; imatinib-responder, Res; imatinib-resistant.
Figure 2.
Figure 2.
Clofazimine downregulates PRDX1 expression, which leads to reactive oxygen species-dependent differentiation and apoptosis. (A) Phorbol myristate acetate (10 ng/mL) but not clofazimine (CFZ) (2.5 μM)-induced CD41 expression in K562 cells is blocked by U0126 (10 μM; 30 min pre-treatment). Representative histograms are shown in Online Supplementary Figure S5A. (B) CFZ does not induce ERK phosphorylation. (C-F) CFZ induces the production of cellular reactive oxygen species (ROS). Total ROS (C; representative histograms in Online Supplementary Figure S5B), total superoxide (D), mitochondrial superoxide (E), and H2O2 (F). (G) CFZ induces mitochondrial membrane depolarization (dot plot in Online Supplementary Figure S5C). (H) α-tocopherol completely blocks CFZ-induced loss of K562 viability. (I) α-tocopherol (200 μM) blocks CFZ (2.5 μM)-induced CD41 expression in K562 cells (representative histograms in Online Supplementary Figure S5D). (J) CFZ reduces peroxiredoxin 1 (PRDX1) protein level within 12 h. (K) CFZ reduces PRDX1 mRNA within 6 h in K562 cells. (L) CFZ reduces a PRDX1 (−1096−+83) promoter-driven luciferase reporter activity in HEK-293 cells. (M) CFZ reduces PRDX1 protein in cells from patients with imatinib-resistant chronic phase chronic myeloid leukemia. Immunoblots are representative of three independent experiments. Graphs illustrate the mean ± standard error of mean. **P<0.01, ***P<0.001 (A,C,F,H,I,K; one-way analysis of variance followed by the Bonferroni post-test. D,E,G,M; unpaired two-tailed Student t-test). V: vehicle; PMA: phorbol myristate acetate, ERK: extracellular signal-regulated kinase; MW: molecular weight; DHE: dihydroethidium; MMP: matrix metalloproteinase; DPI: diphenyleneiodonium; NAC: N-acetyl-L-cysteine; SOD: superoxide dismutase; NFE2L2: Nuclear factor erythroid 2 like 2; CP-CML: chronic phase chronic myeloid leukemia.
Figure 3.
Figure 3.
Introduction of exogenous PRDX1 in cells compromises clofazimine-induced reactive oxygen species generation, apoptosis and differentiation. (A-D) Overexpression of peroxiredoxin 1 (PRDX1) in K562 cells ameliorates clofazimine (CFZ)-induced reactive oxygen species generation (A), caspase cleavage and BAX expression (B), apoptosis (C; representative dot plots in Online Supplementary Figure S6A), and CD61 expression (D; representative histograms in Online Supplementary Figure S6B). (E-H). CD34+ chronic myeloid leukemia (CML) cells transfected with PRDX1 are protected from CFZ-induced ROS generation and apop-tosis. (E, F) CD34+ cells were isolated from chronic phase (CP)-CML cells as described above and were transfected with empty vector or a PRDX1 expression plasmid. Cells were then treated with CFZ (5 μM; 24 h) and dihydroethidium fluorescence was measured by flow cytometry (E; graphical representation, F; representative dot plots). (G, H) CD34+ cells transfected with empty vector or PRDX1 were treated with CFZ (5 μM; 48 h) and apoptosis was assessed by annexin V staining followed by flow cytometry (G; graphical representation, H; representative dot plots). (I) PRDX1 mRNA expression in CP-CML cells determined by quantitative real-time polymerase chain reaction (QRT-PCR). (J) PRDX1 mRNA expression in CD3438+, CD34+38+ and CD34+38 cells by QRT-PCR. Graphs (except I & J) are mean ± standard error of mean of three independent experiments. Immunoblots are representative of three independent experiments. **P<0.01, ***P<0.001 (A,C,D-E,G; two-way analysis of variance followed by the Bonferroni post-test. I,J; Kruskal-Wallis test followed by the Dunn test). DCFDA: 2′,7′-dichlorofluorescein diacetate; V: vehicle; SSC; side scatter; DHE: dihydroethidium; PE: phycoerythrin.
Figure 4.
Figure 4.
Clofazimine modulates PRXD1 expression via transcriptional regulation of MYB. (A, B) Clofazimine (CFZ) (5 μM) reduces myeloblastoma oncoprotein (MYB) protein (A), mRNA (B) expression in K562 cells. (C) CFZ (5 μM, 24 h) reduces a three copy MYB consensus response element-containing reporter activity in K562 cells and overexpression of MYB, mitigates this repression. (D) CFZ (5 μM, 24 h) represses the peroxiredoxin 1 (PRDX1) promoter-luc and overexpression of MYB activates this reporter and ameliorates its CFZ-mediated repression. (E) Deletion mapping of the ~1 kb PRDX1 promoter in HEK-293 cells reveals MYB response between the −11 to +9 region in the MYB promoter. (F) MYB activates a reporter containing −11 to +83 wildtype (Wt) but not mutated (mt; mutated bases in lower case letters) PRDX1 promoter sequence in HEK-293 cells. (G) MYB activates a reporter containing the −11 to +9 PRDX1 promoter sequence in three tandem repeats in HEK-293 cells. (H) MYB is recruited to the endogenous PRDX1 promoter in K562 cells and CFZ (24 h) reduces its recruitment and concomitantly reduces histone 3 (K9) acetylation. (I, J) CFZ (5 µM, 24 h) reduces MYB protein in imatinib-resistant chronic phase chronic myeloid leukemia (CP-CML) cells (I; graphical representation, J; representative histogram). (K). CFZ (5 µM, 24 h) suppresses MYB expression in CD34+ cells. (L-O; treatment concentration and duration same as Figure 3A-D) Overexpression of MYB in K562 cells mitigates CFZ-mediated downregulation of PRDX1 protein level, and induction of caspase-3 cleavage (L), enhanced K562 apoptosis (M; dot plots in Online Supplementary Figure S8A), CD61 expression (N; histograms in Online Supplementary Figure S8B) and cellular reactive oxygen species (O). (P) MYB mRNA expression in CP-CML cells. Graphs, except (P), show the mean ± standard error of mean of three independent experiments. Immunoblots are one representative of three independent experiments. *P<0.05, **P<0.01, ***P<0.001. (B, H) one-way, (M-O) two-way ANOVA followed by the Bonferroni post-test. (I, K); unpaired two-tailed Student t-test. (P) Kruskal-Wallis test followed by the Dunn test. E2F1; E2F transcription factor ATF-4: activating transcription factor 4; RLU: relative light unit; 3X MRE: three copy MYB consensus response element; V; vehicle; DCFDA: 2′,7′-dichlorofluo-rescein diacetate; GAPDH: glyceraldehyde 3-phosphate dehydrogenase.
Figure 5.
Figure 5.
Clofazimine regulates myeloblastoma oncoprotein expression via rapid proteasomal degradation of p65 NFκB. (A) Transfected p65 or tumor necrosis factor-α (10 ng/mL) activates a myeloblastoma oncoprotein (MYB) promoter (−687−+204)-driven luciferase reporter in K562 cells. (B, C) Clofazimine (CFZ) (5 μM) rapidly reduces p65 protein level (B) but does not alter p65 mRNA (C) in K562 cells. (D) CFZ (5 μM, 24 h) reduces a nuclear factor kappa B response element-driven reporter in K562 cells. (E) MG132 or lactacystin (10 μM, 6 h pretreatment) prevents the CFZ (5 μM, 1 h)-mediated reduction in p65 protein level in K562 cells. (F) CFZ (5 μM, 1 h) induces ubiquitination of p65. Proteins were immunoprecipitated with a rabbit p65 antibody followed by western blotting with mouse ubiquitin or p65 antibodies. To avoid the possibility of detection of IgG heavy chain (~50 kDa), an IgG light chain-specific secondary antibody was used. (G) CFZ (5 μM, 24 h) reduces p65 protein in imatinib-resistant chronic phase chronic myeloid leukemia (CP-CML) cells. (H-K; treatment concentration and duration same as in Figure 3A-D) p65 overexpression in K562 cells mitigates CFZ-induced downregulation of MYB and peroxiredoxin 1 and upregulation of caspase 3 cleavage (H), CFZ-mediated apoptosis (I; dot plots in Online Supplementary Figure S9A), CD61 expression (J; dot plots in Online Supplementary Figure S9B) and generation of cellular reactive oxygen species (K). (L) p65 expression in CP-CML cells. Graphs (except L) illustrate the mean ± standard error of mean of three independent experiments. (B,E,H) are one representative of three independent experiments. (F) is one representative of two independent experiments. *P<0.05, **P<0.01, ***P<0.001. (A) One-way analysis of variance (ANOVA), (I-K) Two-way ANOVA followed by the Bonferroni post-test. (C, L); Kruskal-Wallis test followed by the Dunn test. (D, G) Unpaired two-tailed Student t-test. MYB: myeloblastoma oncoprotein; V: vehicle; NFκB: uclear factor kappa B; TNF-α: tumor necrosis factor-alpha; Lacta: lactacystin; IP: immunoprecipitation; WB: western blot; UB: ubiquitin; PRDX1: peroxiredoxin 1; CC; cleaved caspase; DCFDA: 2′,7′-dichlorofluorescein diacetate; GAPDH: glyceraldehyde 3-phosphate dehydrogenase.
Figure 6.
Figure 6.
Clofazimine regulates p65 level, apoptosis and differentiation via a direct interaction with PPARγ. (A) Depletion of ubiquitin ligases PDLIM2, COMMD1, Cul5 and ING4 does not affect clofazimine (CFZ) (5 μM, 24 h)-mediated decrease in p65 protein (B-E). Treatment concentration and duration same as in Figure 3A-D). Peroxisome proliferator-activated receptor (PPAR)-γ depletion in K562 cells compromises CFZ-induced downregulation of p65, myeloblastoma oncoprotein (MYB), and peroxiredoxin 1 (PRDX1) and upregulation of cleaved caspase-3 (B), apoptosis (C; dot plots in Online Supplementary Figure S10A), CD61 expression (D; histograms in Online Supplementary Figure S10B) and generation of reactive oxygen species (E). (F-J) CFZ physically interacts with PPARγ and increases its transcriptional activity. (F) The PPARγ-CFZ interaction as determined by a cell-free time-resolved fluorescence resonance energy transfer lanthascreen assay. (G) CFZ increases transcriptional activity of a Gal4DBD-PPARγLBD fusion protein (pM-PPARγ) on a GAL4 response element-containing reporter (GAL4-UAS-Luc) in transfected HEK-293 cells (H) CFZ alters thermodynamic properties of purified PPARγLBD. Isothermal titration calorimetry to probe interaction of CFZ with PPARγLBD (protein purification and characterization in Online Supplementary Figure S11A-D); CFZ (250 μM) was titrated into PPARγLBD solution (50 μM). The titration curve shows a series of endothermic reactions followed by exothermic isotherms. (I) The interaction between PPARγ-LBD and CFZ was evaluated using a Biacore 3000 instrument. SPR sensogram curves showing the interactions between the indicated concentrations of CFZ and his-tagged PPARγLBD captured over an anti-his antibody immobilized CM5 chip. (J) CFZ increases three-copy DR-1 PPRE luc reporter activity in HEK-293 cells transfected with a PPARγ expression plasmid. (K) CFZ does not alter transcriptional activities of PPARα or PPARδ (agonists used; GW7647 for PPARα and GW0742 for PPARδ; all treatments 24 h). (L) PPARγ mRNA expression in CP-CML cells. Graphs (except L) are mean±SEM of three independent experiments. Blots are one representative of three independent experiments. (H-I) One representative of two independent experiments. *P<0.05, **P<0.01, ***P<0.001 (C-E, G). Two-wayanalysis of variance (ANOVA), (J-K) One-way ANOVA followed by the Bonferroni post-test. L; (K) Kruskal-Wallis test followed by the Dunn test.
Figure 7.
Figure 7.
Clofazimine modulates PPARγ target gene expression and shows synergy with imatinib. (A) Clofazimine (CFZ) and pioglitazone (Pio) reduce signal transducer and activator of transcription 5 (STAT5) protein level in K562 cells (96 h). (B) Imatinib (IMT) but not CFZ or Pio (30 min) reduces STAT5-Y694 phosphorylation. (C) CFZ (5 μM, 24 h) reduces STAT5B and BCL-2 transcripts in K562 cells. (D) IMT, but not CFZ or Pio (30 min), reduces CrkL-Y207 and BCR-ABL1 (ABL1-Y245) phosphorylation. (E) CFZ (5 μM, 24 h) reduces STAT5B, hypoxia-inducible factor (HIF)-1α, HIF-2α and CITED2 transcripts in CD34+ cells isolated from IMT-resistant chronic phase chronic myeloid leukemia (CP-CML) cells. (F) CFZ (72 h) shows superior cytotoxicity to thiazolidinediones in K562 cells. (G, H) CFZ (48 h) shows superior cytotoxic synergy with IMT in K562 cells (G) than Pio (H). (I) CFZ alone or in combination with IMT reduces colony-forming cells in soft agar assay (images in Online Supplementary Figure S2C, I; same set of data as Figure 1H, with the addition of the CFZ+IMT group). (J-L) CFZ alone or in combination with IMT erodes the quiescent CD34+ population and induces apoptosis in these cells. The CD34+ population from IMT-resistant CP-CML cells (n=3) were labeled with 2 μM carboxyfluorescein succidimidyl ester (CFSE) and treated as indicated (96 h). Cells were gated on the basis of CFSE intensity. The distribution (%) of CFSE/CD34+cells in each cell division is shown by different colored dots (D0-D3 represent the cell division number). Apoptosis in these cells was determined by annexin V staining. (J) Representative dot plots corresponding to patient 78 (P78) who was in blast crisis. (K) Cell numbers (%) on D0-D3 from three patients (dot plots corresponding to other patients are presented in Online Supplementary Figure S12). (L) Percentage mean apoptosis from three patients whose data are plotted (see also Online Supplementary Figure S12). (M, N) CFZ alone or in combination with IMT does not alter viability (M) of CD34+ cells from healthy controls or induce apoptosis in these cells (N; dot plots in Online Supplementary Figure S2D). (M, N) Same set of data as in Figure 1K, with the addition of the CFZ+IMT group. Immunoblots are one representative of three independent experiments. Graphs are mean ± standard error of mean of three independent experiments. *,#P<0.05, **, ##P<0.01, ***,###,$$$P<0.001. *V vs. treatment, #IMT vs. CFZ, $CFZ vs. IMT+CFZ. (C, E); Mann-Whitney U test. (I) Kruskal-Wallis test followed by the Dunn test. (K, L, N) One-way analysis of variance followed by the Bonferroni post test.
Figure 8.
Figure 8.
Effects of clofazimine and clofazamine + imatinib on K562 xenografts. (A) Photographs of mice with tumor, tumor volumes on day 1 (d1) and day 13 (d13) are given. The red ‘O’ represents an outlier based on d1 tumor volume (>150 mm3). (B) Relative tumor volume (day wise), left panel; all data included, right panel; minus the outlier (as shown in A). (C) Photographs of tumors. (D) Tumor weight, left panel; all data included (outlier marked in red); right panel: minus outlier. (E) Hematoxylin & eosin staining of tumor sections (red arrowhead: mitotic cells; red arrow: vasculature; yellow arrow: myeloblasts; green arrow: pyknotic nuclei; cyan arrow; karyorrhexis; black arrow: degenerating cells). (F) Ki67 staining. (G) Number of Ki67-positive nuclei. (H) Terminal deoxynucleotidyl transferase dUTP nick end labeling (TUNEL) assay. (I) Number of TUNEL signals/ number of nuclei in a field. (E-I) Eighteen fields/group (6 animals/group). (J-L) Body weight (J), body weight normalized liver weight (K), and body weight normalized spleen weight. (J-L) Vehicle; n=7, all treatment groups, n=6 per group. Microscopy was performed with a Leica DMI6000B microscope (Leica) and the findings were quantified with Image J software. (F, H) For counting, intensity of all images was enhanced in Microsoft office picture manager at a mid-tone setting of 80. Cropped images with uniformly increased brightness are given here for clarity; corresponding full-size images are presented in Online Supplementary Figure S13A, B. *,#,$P<0.05, **P<0.01, ***P<0.001. (B) Two-way analysis of variance (ANOVA), (J-L) One-way ANOVA followed by the Bonferroni post-test, (D) As indicated. (G, I) Kruskal-Wallis test followed by the Dunn test.

Similar articles

Cited by

References

    1. Prost S, Relouzat F, Spentchian M, et al. Erosion of the chronic myeloid leukaemia stem cell pool by PPARγ agonists. Nature. 2015;525(7569):380–383. - PubMed
    1. Glodkowska-Mrowka E, Manda-Handzlik A, Stelmaszczyk-Emmel A, et al. PPARγ ligands increase antileukemic activity of second- and third-generation tyrosine kinase inhibitors in chronic myeloid leukemia cells. Blood Cancer J. 2016;6:e377. - PMC - PubMed
    1. Tuccori M, Filion KB, Yin H, Yu OH, Platt RW, Azoulay L. Pioglitazone use and risk of bladder cancer: population based cohort study. BMJ. 2016;352(i)1541. - PMC - PubMed
    1. Nissen SE, Wolski K. Effect of rosiglitazone on the risk of myocardial infarction and death from cardiovascular causes. N Engl J Med. 2007;356(24):2457–2471. - PubMed
    1. Gopal M, Padayatchi N, Metcalfe JZ, O’Donnell MR. Systematic review of clofazimine for the treatment of drug-resistant tuberculosis. Int J Tuberc Lung Dis. 2013;17(8):1001–1007. - PMC - PubMed

Publication types